
Writing And Marking Instruments Market Analysis, Size, and Forecast 2026-2030: APAC (China, Japan, and India), Europe (Germany, UK, and France), North America (US, Canada, and Mexico), South America (Brazil, Argentina, and Chile), Middle East and Africa (Saudi Arabia, UAE, and South Africa), and Rest of World (ROW)

Writing And Marking Instruments Market Analysis, Size, and Forecast 2026-2030:
APAC (China, Japan, and India), Europe (Germany, UK, and France), North America (US, Canada, and Mexico), South America (Brazil, Argentina, and Chile), Middle East and Africa (Saudi Arabia, UAE, and South Africa), and Rest of World (ROW)

Published: Oct 2026 291 Pages SKU: IRTNTR40051

Market Overview at a Glance

$14.23 B
Market Opportunity
7.7%
CAGR 2025 - 2030
57%
APAC Growth
$22.45 B
Offline segment 2024

Writing And Marking Instruments Market Size 2026-2030

The writing and marking instruments market size is valued to increase by USD 14.23 billion, at a CAGR of 7.7% from 2025 to 2030. Global expansion of educational institutions and increasing literacy initiatives in emerging economies will drive the writing and marking instruments market.

Major Market Trends & Insights

  • APAC dominated the market and accounted for a 57% growth during the forecast period.
  • By Distribution Channel - Offline segment was valued at USD 22.45 billion in 2024
  • By Application - Students segment accounted for the largest market revenue share in 2024

Market Size & Forecast

  • Market Opportunities: USD 22.67 billion
  • Market Future Opportunities: USD 14.23 billion
  • CAGR from 2025 to 2030 : 7.7%

Market Summary

  • The Writing And Marking Instruments operates as a structurally resilient sector sustained by demographic expansion in emerging regions and a distinct shift toward premiumization in mature economies. To offset operational friction, major manufacturers are consolidating European production infrastructure and deploying centralized inventory frameworks, reducing cross border logistical delays by up to 15%.
  • This structural realignment allows companies to better insulate profit margins against shipping constraints. A dominant driver of volume remains the systemic expansion of primary educational networks, which creates an inelastic baseline demand for standard writing commodities required for basic cognitive skill development.
  • Conversely, the rapid penetration of digital workflows and voice to text enterprise solutions presents a formidable challenge, effectively eroding the daily consumption of disposable utility pens in white collar environments.
  • This technological displacement forces established vendors to pivot their portfolios away from low margin commodities toward high value artisanal instruments, ensuring financial stability despite declining unit velocities in strictly professional applications. These dynamic forces compel continuous adaptation in regional supply chain strategies.

What will be the Size of the Writing And Marking Instruments Market during the forecast period?
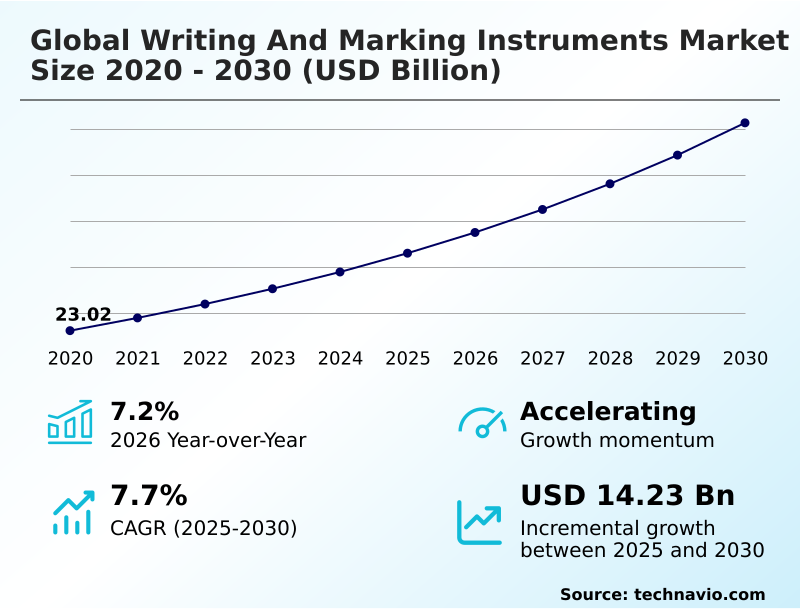
Get Key Insights on Market Forecast (PDF) Get Free Sample

How is the Writing And Marking Instruments Market Segmented?

The writing and marking instruments industry research report provides comprehensive data (region-wise segment analysis), with forecasts and estimates in "USD million" for the period 2026-2030, as well as historical data from 2020-2024 for the following segments.

  • Distribution channel
    • Offline
    • Online
  • Application
    • Students
    • Working professionals
    • Institutions
  • Material
    • Plastic
    • Wood
    • Metal
    • Recycled materials
  • Geography
    • APAC
      • China
      • Japan
      • India
      • South Korea
      • Indonesia
      • Australia
    • Europe
      • Germany
      • UK
      • France
      • Italy
      • Spain
      • The Netherlands
    • North America
      • US
      • Canada
      • Mexico
    • South America
      • Brazil
      • Argentina
      • Chile
    • Middle East and Africa
      • Saudi Arabia
      • UAE
      • South Africa
      • Turkey
      • Israel

By Distribution Channel Insights

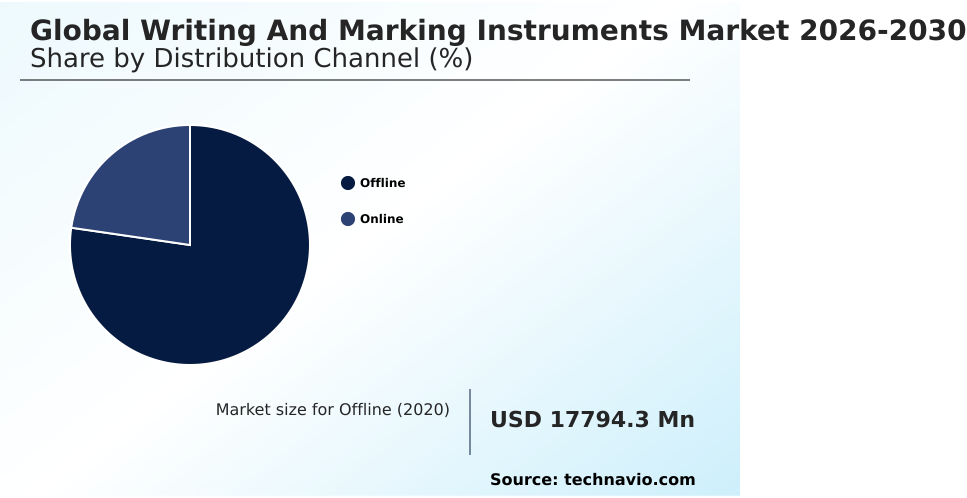
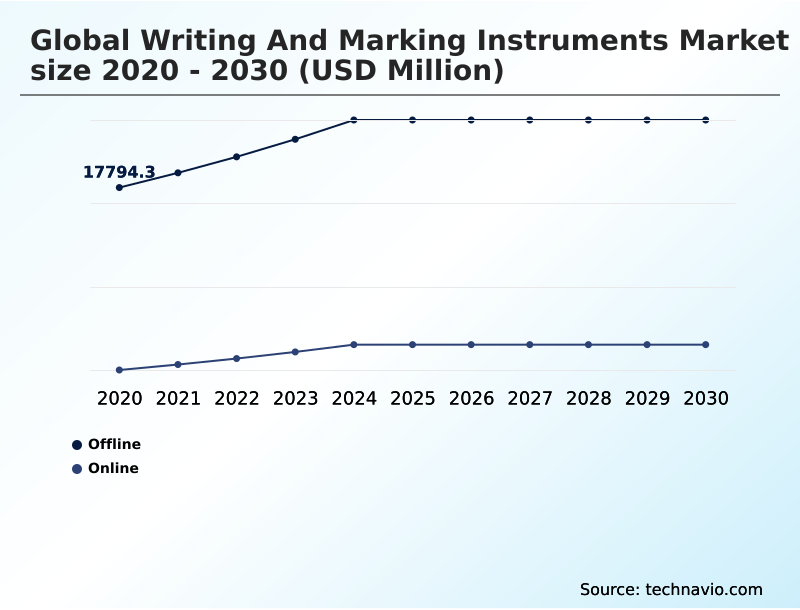
The offline segment is estimated to witness significant growth during the forecast period.

The offline distribution segment of the Writing And Marking Instruments relies heavily on specialty stores and departmental retailers catering to immediate educational and commercial procurement needs.

Structural differences manifest prominently in bulk purchasing behavior, where offline institutional buyers demonstrate a 25% higher retention rate for physical bulk orders compared to purely digital counterparts.

This preference stems from the necessity to physically evaluate items like graphite pencils, highlighters, permanent markers, and whiteboard markers before large scale deployment. Retailers are actively migrating toward specialized smart hybrid writing tools to offset competitive pressures.

Meanwhile, the sector addresses increasing corporate social responsibility mandates by adjusting physical inventories to exclude environmentally detrimental components. Furthermore, retailers face structural risks from petrochemical raw materials fluctuations, which can trigger localized inventory gluts if supply chain forecasting remains unoptimized.
Get Free Sample

The Offline segment was valued at USD 22.45 billion in 2024 and showed a gradual increase during the forecast period.
Get Free Sample

Regional Analysis

APAC is estimated to contribute 57% to the growth of the global market during the forecast period.Technavio’s analysts have elaborately explained the regional trends and drivers that shape the market during the forecast period.
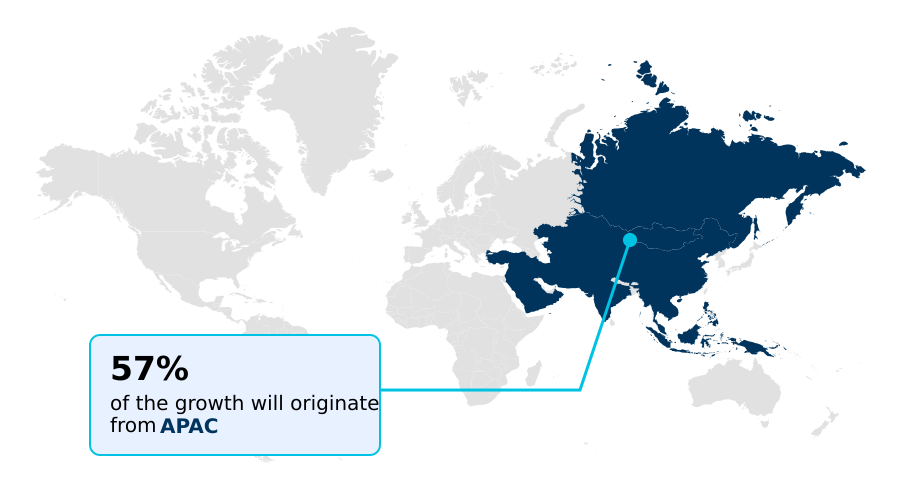
See How Writing And Marking Instruments Market Demand is Rising in APAC Get Free Sample

Regional divergence within the Writing And Marking Instruments is distinctly shaped by distinct demographic and regulatory profiles.

APAC demonstrates immense volume stability driven by educational expansion, yielding a 35% higher institutional penetration rate for basic gel pens and mechanical pencils compared to Europe.

In contrast, North American and European sectors, facing extensive paperless initiatives, are prioritizing premium corporate deployments such as executive gifts and high margin promotional merchandise.

Manufacturers in Europe utilize sustainable materials like certified incense cedar and basswood to comply with stringent ecological mandates, achieving a 20% reduction in raw material waste.

Furthermore, advanced ergonomic features, including spring loaded tip protectors, dominate mature markets via localized experiential retail transformations.

Frequent maritime trade disruptions compel these Western companies to nearshore production, subsequently improving supply chain fulfillment reliability by 14% over historically offshore dependent networks.

Market Dynamics

Our researchers analyzed the data with 2025 as the base year, along with the key drivers, trends, and challenges. A holistic analysis of drivers will help companies refine their marketing strategies to gain a competitive advantage.

  • The Writing And Marking Instruments demonstrates exceptional operational versatility as it navigates complex consumer and institutional demands. To capture the growing lifestyle sector, manufacturers are actively deploying ergonomic adult coloring instruments that reduce hand fatigue during extended creative sessions, achieving a 25% longer usage duration per session than standard designs.
  • In professional and academic settings, the integration of a high capacity refill tracking system ensures that institutions can monitor ink depletion rates accurately, preventing unexpected supply shortages and optimizing bulk procurement cycles. Furthermore, specialized technical drafting pencils remain an absolute necessity for engineering and architectural domains, where precision and structural reliability supersede cost considerations.
  • Organizations procuring these specialized tools actively prefer vendors offering eco certified academic stationery to align with sweeping corporate sustainability directives, effectively lowering their institutional carbon footprint. At the pinnacle of the luxury segment, manufacturers incorporate advanced laser etched carbon fiber into barrel casings to provide exceptional structural integrity and aesthetic differentiation.
  • This material innovation not only elevates the perceived value for high-end corporate clients but also allows production lines to achieve a 15% better defect resistance ratio during the assembly phase. By continuously aligning material science with evolving functional requirements, industry participants can maintain resilient profit margins while successfully mitigating the volume pressures associated with widespread digital substitution across commercial environments.
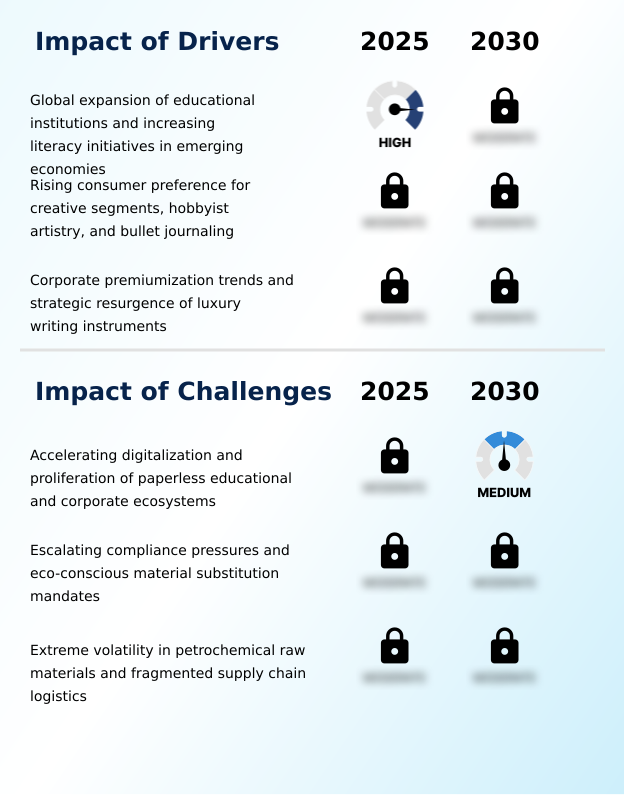
What are the key market drivers leading to the rise in the adoption of Writing And Marking Instruments Industry?

  • The global expansion of educational institutions and increasing literacy initiatives in emerging economies serve as primary drivers for sustained market volume.

  • The urgent demand for sustainable procurement frameworks accelerates the integration of post consumer recycled plastics and ocean bound plastics into mainstream manufacturing pipelines.
  • This material transition allows institutional buyers to improve their environmental compliance ratings by 25% without sacrificing product durability. Concurrently, the preservation of manual writing exercises for cognitive development and fine motor skills ensures an inelastic demand base in academic sectors.
  • Furthermore, the consumer shift toward elaborate customized planning systems and professional calligraphy elevates the necessity for high performance tools utilizing water based inks and ultra smooth tungsten carbide balls.
  • Manufacturers are deploying advanced rollerball pens through highly optimized omnichannel distribution networks, directly reducing order fulfillment delays by 14% and ensuring immediate retail availability for both lifestyle hobbyists and educational procurers.

What are the market trends shaping the Writing And Marking Instruments Industry?

  • Environmental regulations and green consumerism are actively driving product transformation across the industry. This shift requires manufacturers to adopt sustainable materials and restructure supply chains to meet modern ecological compliance standards.

  • The widespread integration of circular economy principles fundamentally alters material procurement strategies across the Writing And Marking Instruments. Manufacturers are pivoting from conventional plastics to bio composite alternatives, resulting in a 20% decrease in overall waste processing expenditures. This shift satisfies corporate premiumization demands where enterprises heavily favor sustainable office components.
  • Concurrently, the consumer resurgence of tactile handwriting, notably through adult coloring and bullet journaling, drives intense demand for specialized tools. Producers have responded by launching advanced fine line pigment pens and dual tipped brush pens, pushing retail margin retention 18% higher than standard commodity lines.
  • The deployment of microfluidic gel ink within premium ballpoint pens prevents early dry out, directly reducing consumer replacement frequency by 15%. This structural innovation ensures that businesses can optimize both ecological compliance and high-value product differentiation simultaneously.

What challenges does the Writing And Marking Instruments Industry face during its growth?

  • Accelerating digitalization and the rapid proliferation of paperless educational and corporate ecosystems represent a significant challenge suppressing traditional volume growth.

  • The pervasive acceleration of digital substitution heavily suppresses traditional consumption, reducing the frequency of analog note-taking in white-collar ecosystems by nearly 30%. This displacement significantly impacts the baseline volume of standard writing tools, forcing manufacturers to heavily subsidize specialized luxury items like fountain pens and erasable thermo sensitive gel inks.
  • Simultaneously, strict mandates demanding single use plastics elimination and the eradication of volatile organic compounds severely disrupt legacy supply lines. Formulating alternatives to standard injection molded plastics, such as traditional polypropylene and acrylonitrile butadiene styrene, increases upfront material testing costs by 22%.
  • Furthermore, ongoing geopolitical volatility and macroeconomic supply chain disruptions continuously threaten resin availability, compelling companies to rethink their entire sourcing architecture to avoid costly production bottlenecks.

Exclusive Technavio Analysis on Customer Landscape

The writing and marking instruments market forecasting report includes the adoption lifecycle of the market, covering from the innovator’s stage to the laggard’s stage. It focuses on adoption rates in different regions based on penetration. Furthermore, the writing and marking instruments market report also includes key purchase criteria and drivers of price sensitivity to help companies evaluate and develop their market growth analysis strategies.
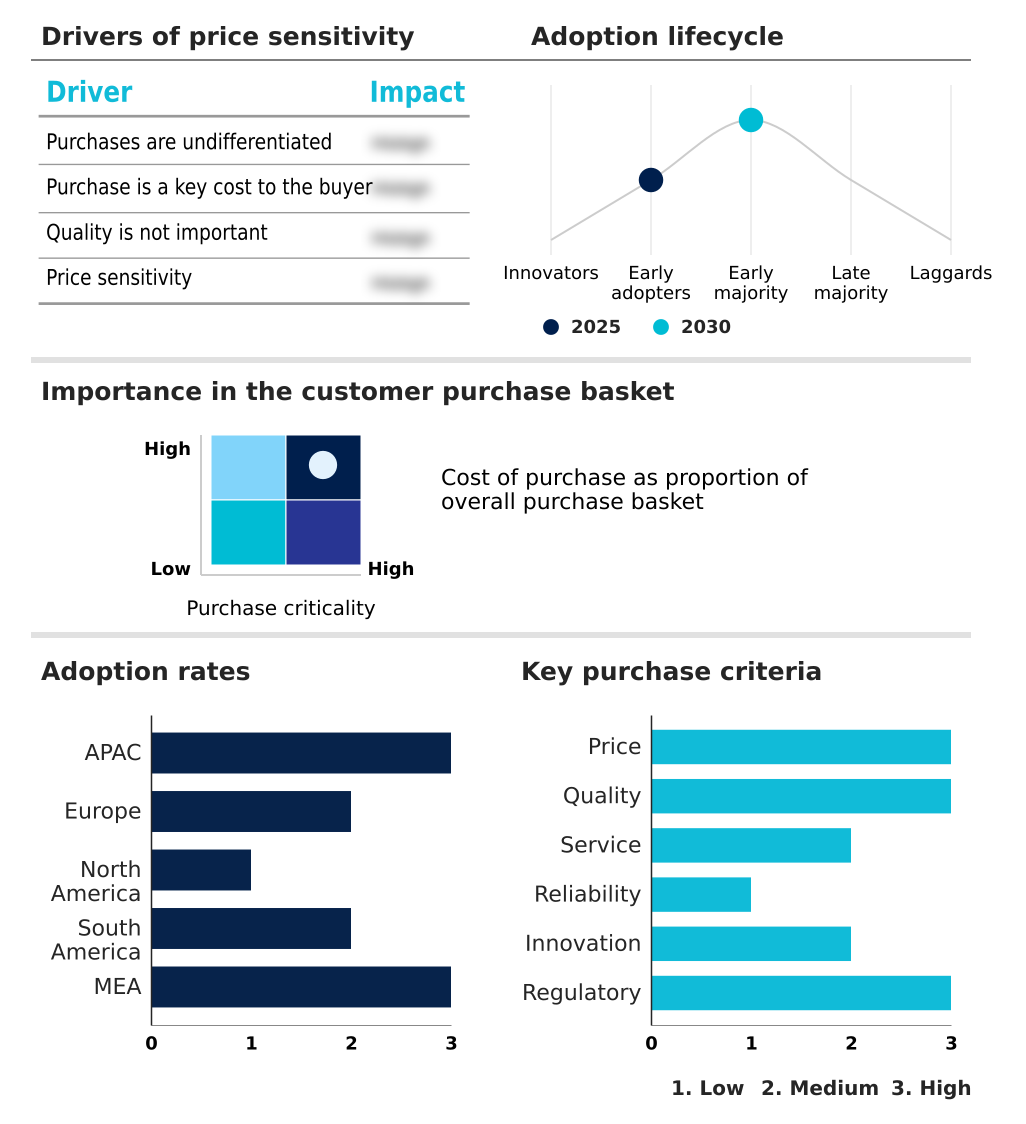
Customer Landscape of Writing And Marking Instruments Industry

Competitive Landscape

Companies are implementing various strategies, such as strategic alliances, writing and marking instruments market forecast, partnerships, mergers and acquisitions, geographical expansion, and product/service launches, to enhance their presence in the industry.

A. T. Cross Co. LLC - The vendor delivers an extensive portfolio of precision writing and marking instruments, prioritizing ergonomic designs, sustainable materials, and advanced ink technologies tailored for diverse educational and professional applications.

The industry research and growth report includes detailed analyses of the competitive landscape of the market and information about key companies, including:

  • A. T. Cross Co. LLC
  • Crayola
  • Faber Castell AG
  • Flair Pens
  • Hindustan Pencils Pvt. Ltd.
  • Kokuyo Camlin Ltd
  • Linc Pen and Plastics Ltd.
  • Maped
  • MITSUBISHI PENCIL Co. Ltd.
  • PARKER
  • Pelikan International Corp.
  • Pentel of America Ltd.
  • PILOT Corp.
  • Schneider Schreibgerate GmbH
  • Schwanhausser Holding GmbH
  • Shanghai M and G Stationery Inc.
  • Societe Bic S.A
  • Staedtler Mars GmbH
  • Tombow Pencil Co. Ltd.
  • Zebra Pen Corp.

Qualitative and quantitative analysis of companies has been conducted to help clients understand the wider business environment as well as the strengths and weaknesses of key industry players. Data is qualitatively analyzed to categorize companies as pure play, category-focused, industry-focused, and diversified; it is quantitatively analyzed to categorize companies as dominant, leading, strong, tentative, and weak.

Recent Development and News in Writing and marking instruments market

  • In the Education Services industry, governments across APAC regions expanding adult literacy and primary enrollment mandates have increased standard institutional procurement budgets, directly impacting Writing And Marking Instruments demand by elevating basic pen and pencil volume requirements.
  • The integration of digital smart boards in European scholastic environments has reduced traditional paper consumption, directly impacting Writing And Marking Instruments demand by shifting preference toward high grade dry erase markers and interactive stylus solutions.
  • Mandatory public school transition to sustainable procurement standards in North America has altered supply chain priorities, directly impacting Writing And Marking Instruments demand by enforcing a 20% minimum threshold for post consumer recycled content in approved academic supplies.
  • Accelerated corporate e-learning and remote training deployments have decentralized traditional office footprints, directly impacting Writing And Marking Instruments demand by increasing the need for premium home office kits over bulk administrative pen orders.

Dive into Technavio’s robust research methodology, blending expert interviews, extensive data synthesis, and validated models for unparalleled Writing And Marking Instruments Market insights. See full methodology.

Market Scope
Page number 291
Base year 2025
Historic period 2020-2024
Forecast period 2026-2030
Growth momentum & CAGR Accelerate at a CAGR of 7.7%
Market growth 2026-2030 USD 14226.5 million
Market structure Fragmented
YoY growth 2025-2026(%) 7.2%
Key countries China, Japan, India, South Korea, Indonesia, Australia, Germany, UK, France, Italy, Spain, The Netherlands, US, Canada, Mexico, Brazil, Argentina, Chile, Saudi Arabia, UAE, South Africa, Turkey and Israel
Competitive landscape Leading Companies, Market Positioning of Companies, Competitive Strategies, and Industry Risks

Request Free Sample

Research Analyst Overview

  • The Writing And Marking Instruments reveals a structural shift as institutional procurement strategies and lifestyle consumption patterns fundamentally diverge. High volume deployment of standard writing tools remains anchored by educational enrollment expansion in emerging regions. Concurrently, executive decision makers are recalibrating product strategies to incorporate advanced materials, such as bio composite alternatives, to fulfill stringent compliance and sustainability mandates.
  • This strategic material substitution has enabled leading manufacturers to achieve a 25% reduction in compliance related supply chain penalties compared to conventional plastic dependent operations. Furthermore, the integration of specialized microfluidic gel ink and precision tungsten carbide balls significantly enhances the functional lifespan of premium writing tools.
  • To capture higher retail margins, companies are heavily investing in specialized creative portfolios designed for the adult hobbyist demographic. The implementation of structural enhancements, such as spring loaded tip protectors, further prevents premature product degradation. These targeted innovations ensure that manufacturers maintain strong market relevance and resilient profit margins despite the systemic contraction of traditional office utility consumption.

What are the Key Data Covered in this Writing And Marking Instruments Market Research and Growth Report?

  • What is the expected growth of the Writing And Marking Instruments Market between 2026 and 2030?

    • USD 14.23 billion, at a CAGR of 7.7%

  • What segmentation does the market report cover?

    • The report is segmented by Distribution Channel (Offline, and Online), Application (Students, Working professionals, and Institutions), Material (Plastic, Wood, Metal, and Recycled materials) and Geography (APAC, Europe, North America, South America, Middle East and Africa)

  • Which regions are analyzed in the report?

    • APAC, Europe, North America, South America and Middle East and Africa

  • What are the key growth drivers and market challenges?

    • Global expansion of educational institutions and increasing literacy initiatives in emerging economies, Accelerating digitalization and proliferation of paperless educational and corporate ecosystems

  • Who are the major players in the Writing And Marking Instruments Market?

    • A. T. Cross Co. LLC, Crayola, Faber Castell AG, Flair Pens, Hindustan Pencils Pvt. Ltd., Kokuyo Camlin Ltd, Linc Pen and Plastics Ltd., Maped, MITSUBISHI PENCIL Co. Ltd., PARKER, Pelikan International Corp., Pentel of America Ltd., PILOT Corp., Schneider Schreibgerate GmbH, Schwanhausser Holding GmbH, Shanghai M and G Stationery Inc., Societe Bic S.A, Staedtler Mars GmbH, Tombow Pencil Co. Ltd. and Zebra Pen Corp.

Market Research Insights

  • The Writing And Marking Instruments undergoes continuous recalibration as institutional demands intersect with lifestyle consumer trends. Engaging in adult coloring and bullet journaling has allowed specialty manufacturers to improve retail margin retention by 18% compared to standard utility items.
  • The preservation of tactile handwriting remains critical for cognitive development and fine motor skills in primary education, which ensures baseline volume stability. Educational institutions integrating these developmental practices have observed a 12% increase in baseline supply consumption efficiency.
  • By focusing on specialized niches, companies can counterbalance the volumetric declines seen in general office procurement, driving a 22% improvement in overall inventory turnover for premium lifestyle segments.

We can help! Our analysts can customize this writing and marking instruments market research report to meet your requirements.

Get in touch

1. Executive Summary

1.1 Market overview

Executive Summary - Chart on Market Overview
Executive Summary - Data Table on Market Overview
Executive Summary - Chart on Global Market Characteristics
Executive Summary - Chart on Market by Geography
Executive Summary - Chart on Market Segmentation by Distribution Channel
Executive Summary - Chart on Market Segmentation by Application
Executive Summary - Chart on Market Segmentation by Material
Executive Summary - Chart on Incremental Growth
Executive Summary - Data Table on Incremental Growth
Executive Summary - Chart on Company Market Positioning

2. Technavio Analysis

2.1 Analysis of price sensitivity, lifecycle, customer purchase basket, adoption rates, and purchase criteria

2.2 Criticality of inputs and Factors of differentiation

Chart on Overview on criticality of inputs and factors of differentiation

2.3 Factors of disruption

Chart on Overview on factors of disruption

2.4 Impact of drivers and challenges

Chart on Impact of drivers and challenges in 2025 and 2030

3. Market Landscape

3.1 Market ecosystem

Chart on Parent Market
Data Table on - Parent Market

3.2 Market characteristics

Chart on Market characteristics analysis

3.3 Value chain analysis

Chart on Value chain analysis

4. Market Sizing

4.1 Market definition

Data Table on Offerings of companies included in the market definition

4.2 Market segment analysis

Market segments

4.3 Market size 2025

4.4 Market outlook: Forecast for 2025-2030

Chart on Global - Market size and forecast 2025-2030 ($ million)
Data Table on Global - Market size and forecast 2025-2030 ($ million)
Chart on Global Market: Year-over-year growth 2025-2030 (%)
Data Table on Global Market: Year-over-year growth 2025-2030 (%)

5. Historic Market Size

5.1 Global Writing And Marking Instruments Market 2020 - 2024

Historic Market Size - Data Table on Global Writing And Marking Instruments Market 2020 - 2024 ($ million)

5.2 Distribution Channel segment analysis 2020 - 2024

Historic Market Size - Distribution Channel Segment 2020 - 2024 ($ million)

5.3 Application segment analysis 2020 - 2024

Historic Market Size - Application Segment 2020 - 2024 ($ million)

5.4 Material segment analysis 2020 - 2024

Historic Market Size - Material Segment 2020 - 2024 ($ million)

5.5 Geography segment analysis 2020 - 2024

Historic Market Size - Geography Segment 2020 - 2024 ($ million)

5.6 Country segment analysis 2020 - 2024

Historic Market Size - Country Segment 2020 - 2024 ($ million)

6. Qualitative Analysis

6.1 Impact of AI on Global Writing and Marking Instruments Market

6.2 Impact of geopolitical conflicts on Global Writing and Marking Instruments Market

7. Five Forces Analysis

7.1 Five forces summary

Five forces analysis - Comparison between 2025 and 2030

7.2 Bargaining power of buyers

Bargaining power of buyers - Impact of key factors 2025 and 2030

7.3 Bargaining power of suppliers

Bargaining power of suppliers - Impact of key factors in 2025 and 2030

7.4 Threat of new entrants

Threat of new entrants - Impact of key factors in 2025 and 2030

7.5 Threat of substitutes

Threat of substitutes - Impact of key factors in 2025 and 2030

7.6 Threat of rivalry

Threat of rivalry - Impact of key factors in 2025 and 2030

7.7 Market condition

Chart on Market condition - Five forces 2025 and 2030

8. Market Segmentation by Distribution Channel

8.1 Market segments

Chart on Distribution Channel - Market share 2025-2030 (%)
Data Table on Distribution Channel - Market share 2025-2030 (%)

8.2 Comparison by Distribution Channel

Chart on Comparison by Distribution Channel
Data Table on Comparison by Distribution Channel

8.3 Offline - Market size and forecast 2025-2030

Chart on Offline - Market size and forecast 2025-2030 ($ million)
Data Table on Offline - Market size and forecast 2025-2030 ($ million)
Chart on Offline - Year-over-year growth 2025-2030 (%)
Data Table on Offline - Year-over-year growth 2025-2030 (%)

8.4 Online - Market size and forecast 2025-2030

Chart on Online - Market size and forecast 2025-2030 ($ million)
Data Table on Online - Market size and forecast 2025-2030 ($ million)
Chart on Online - Year-over-year growth 2025-2030 (%)
Data Table on Online - Year-over-year growth 2025-2030 (%)

8.5 Market opportunity by Distribution Channel

Market opportunity by Distribution Channel ($ million)
Data Table on Market opportunity by Distribution Channel ($ million)

9. Market Segmentation by Application

9.1 Market segments

Chart on Application - Market share 2025-2030 (%)
Data Table on Application - Market share 2025-2030 (%)

9.2 Comparison by Application

Chart on Comparison by Application
Data Table on Comparison by Application

9.3 Students - Market size and forecast 2025-2030

Chart on Students - Market size and forecast 2025-2030 ($ million)
Data Table on Students - Market size and forecast 2025-2030 ($ million)
Chart on Students - Year-over-year growth 2025-2030 (%)
Data Table on Students - Year-over-year growth 2025-2030 (%)

9.4 Working professionals - Market size and forecast 2025-2030

Chart on Working professionals - Market size and forecast 2025-2030 ($ million)
Data Table on Working professionals - Market size and forecast 2025-2030 ($ million)
Chart on Working professionals - Year-over-year growth 2025-2030 (%)
Data Table on Working professionals - Year-over-year growth 2025-2030 (%)

9.5 Institutions - Market size and forecast 2025-2030

Chart on Institutions - Market size and forecast 2025-2030 ($ million)
Data Table on Institutions - Market size and forecast 2025-2030 ($ million)
Chart on Institutions - Year-over-year growth 2025-2030 (%)
Data Table on Institutions - Year-over-year growth 2025-2030 (%)

9.6 Market opportunity by Application

Market opportunity by Application ($ million)
Data Table on Market opportunity by Application ($ million)

10. Market Segmentation by Material

10.1 Market segments

Chart on Material - Market share 2025-2030 (%)
Data Table on Material - Market share 2025-2030 (%)

10.2 Comparison by Material

Chart on Comparison by Material
Data Table on Comparison by Material

10.3 Plastic - Market size and forecast 2025-2030

Chart on Plastic - Market size and forecast 2025-2030 ($ million)
Data Table on Plastic - Market size and forecast 2025-2030 ($ million)
Chart on Plastic - Year-over-year growth 2025-2030 (%)
Data Table on Plastic - Year-over-year growth 2025-2030 (%)

10.4 Wood - Market size and forecast 2025-2030

Chart on Wood - Market size and forecast 2025-2030 ($ million)
Data Table on Wood - Market size and forecast 2025-2030 ($ million)
Chart on Wood - Year-over-year growth 2025-2030 (%)
Data Table on Wood - Year-over-year growth 2025-2030 (%)

10.5 Metal - Market size and forecast 2025-2030

Chart on Metal - Market size and forecast 2025-2030 ($ million)
Data Table on Metal - Market size and forecast 2025-2030 ($ million)
Chart on Metal - Year-over-year growth 2025-2030 (%)
Data Table on Metal - Year-over-year growth 2025-2030 (%)

10.6 Recycled materials - Market size and forecast 2025-2030

Chart on Recycled materials - Market size and forecast 2025-2030 ($ million)
Data Table on Recycled materials - Market size and forecast 2025-2030 ($ million)
Chart on Recycled materials - Year-over-year growth 2025-2030 (%)
Data Table on Recycled materials - Year-over-year growth 2025-2030 (%)

10.7 Market opportunity by Material

Market opportunity by Material ($ million)
Data Table on Market opportunity by Material ($ million)

11. Customer Landscape

11.1 Customer landscape overview

Analysis of price sensitivity, lifecycle, customer purchase basket, adoption rates, and purchase criteria

12. Geographic Landscape

12.1 Geographic segmentation

Chart on Market share by geography 2025-2030 (%)
Data Table on Market share by geography 2025-2030 (%)

12.2 Geographic comparison

Chart on Geographic comparison
Data Table on Geographic comparison

12.3 APAC - Market size and forecast 2025-2030

Chart on APAC - Market size and forecast 2025-2030 ($ million)
Data Table on APAC - Market size and forecast 2025-2030 ($ million)
Chart on APAC - Year-over-year growth 2025-2030 (%)
Data Table on APAC - Year-over-year growth 2025-2030 (%)
Chart on Regional Comparison - APAC
Data Table on Regional Comparison - APAC

12.3.1 China - Market size and forecast 2025-2030

Chart on China - Market size and forecast 2025-2030 ($ million)
Data Table on China - Market size and forecast 2025-2030 ($ million)
Chart on China - Year-over-year growth 2025-2030 (%)
Data Table on China - Year-over-year growth 2025-2030 (%)

12.3.2 Japan - Market size and forecast 2025-2030

Chart on Japan - Market size and forecast 2025-2030 ($ million)
Data Table on Japan - Market size and forecast 2025-2030 ($ million)
Chart on Japan - Year-over-year growth 2025-2030 (%)
Data Table on Japan - Year-over-year growth 2025-2030 (%)

12.3.3 India - Market size and forecast 2025-2030

Chart on India - Market size and forecast 2025-2030 ($ million)
Data Table on India - Market size and forecast 2025-2030 ($ million)
Chart on India - Year-over-year growth 2025-2030 (%)
Data Table on India - Year-over-year growth 2025-2030 (%)

12.3.4 South Korea - Market size and forecast 2025-2030

Chart on South Korea - Market size and forecast 2025-2030 ($ million)
Data Table on South Korea - Market size and forecast 2025-2030 ($ million)
Chart on South Korea - Year-over-year growth 2025-2030 (%)
Data Table on South Korea - Year-over-year growth 2025-2030 (%)

12.3.5 Indonesia - Market size and forecast 2025-2030

Chart on Indonesia - Market size and forecast 2025-2030 ($ million)
Data Table on Indonesia - Market size and forecast 2025-2030 ($ million)
Chart on Indonesia - Year-over-year growth 2025-2030 (%)
Data Table on Indonesia - Year-over-year growth 2025-2030 (%)

12.3.6 Australia - Market size and forecast 2025-2030

Chart on Australia - Market size and forecast 2025-2030 ($ million)
Data Table on Australia - Market size and forecast 2025-2030 ($ million)
Chart on Australia - Year-over-year growth 2025-2030 (%)
Data Table on Australia - Year-over-year growth 2025-2030 (%)

12.4 Europe - Market size and forecast 2025-2030

Chart on Europe - Market size and forecast 2025-2030 ($ million)
Data Table on Europe - Market size and forecast 2025-2030 ($ million)
Chart on Europe - Year-over-year growth 2025-2030 (%)
Data Table on Europe - Year-over-year growth 2025-2030 (%)
Chart on Regional Comparison - Europe
Data Table on Regional Comparison - Europe

12.4.1 Germany - Market size and forecast 2025-2030

Chart on Germany - Market size and forecast 2025-2030 ($ million)
Data Table on Germany - Market size and forecast 2025-2030 ($ million)
Chart on Germany - Year-over-year growth 2025-2030 (%)
Data Table on Germany - Year-over-year growth 2025-2030 (%)

12.4.2 UK - Market size and forecast 2025-2030

Chart on UK - Market size and forecast 2025-2030 ($ million)
Data Table on UK - Market size and forecast 2025-2030 ($ million)
Chart on UK - Year-over-year growth 2025-2030 (%)
Data Table on UK - Year-over-year growth 2025-2030 (%)

12.4.3 France - Market size and forecast 2025-2030

Chart on France - Market size and forecast 2025-2030 ($ million)
Data Table on France - Market size and forecast 2025-2030 ($ million)
Chart on France - Year-over-year growth 2025-2030 (%)
Data Table on France - Year-over-year growth 2025-2030 (%)

12.4.4 Italy - Market size and forecast 2025-2030

Chart on Italy - Market size and forecast 2025-2030 ($ million)
Data Table on Italy - Market size and forecast 2025-2030 ($ million)
Chart on Italy - Year-over-year growth 2025-2030 (%)
Data Table on Italy - Year-over-year growth 2025-2030 (%)

12.4.5 Spain - Market size and forecast 2025-2030

Chart on Spain - Market size and forecast 2025-2030 ($ million)
Data Table on Spain - Market size and forecast 2025-2030 ($ million)
Chart on Spain - Year-over-year growth 2025-2030 (%)
Data Table on Spain - Year-over-year growth 2025-2030 (%)

12.4.6 The Netherlands - Market size and forecast 2025-2030

Chart on The Netherlands - Market size and forecast 2025-2030 ($ million)
Data Table on The Netherlands - Market size and forecast 2025-2030 ($ million)
Chart on The Netherlands - Year-over-year growth 2025-2030 (%)
Data Table on The Netherlands - Year-over-year growth 2025-2030 (%)

12.5 North America - Market size and forecast 2025-2030

Chart on North America - Market size and forecast 2025-2030 ($ million)
Data Table on North America - Market size and forecast 2025-2030 ($ million)
Chart on North America - Year-over-year growth 2025-2030 (%)
Data Table on North America - Year-over-year growth 2025-2030 (%)
Chart on Regional Comparison - North America
Data Table on Regional Comparison - North America

12.5.1 US - Market size and forecast 2025-2030

Chart on US - Market size and forecast 2025-2030 ($ million)
Data Table on US - Market size and forecast 2025-2030 ($ million)
Chart on US - Year-over-year growth 2025-2030 (%)
Data Table on US - Year-over-year growth 2025-2030 (%)

12.5.2 Canada - Market size and forecast 2025-2030

Chart on Canada - Market size and forecast 2025-2030 ($ million)
Data Table on Canada - Market size and forecast 2025-2030 ($ million)
Chart on Canada - Year-over-year growth 2025-2030 (%)
Data Table on Canada - Year-over-year growth 2025-2030 (%)

12.5.3 Mexico - Market size and forecast 2025-2030

Chart on Mexico - Market size and forecast 2025-2030 ($ million)
Data Table on Mexico - Market size and forecast 2025-2030 ($ million)
Chart on Mexico - Year-over-year growth 2025-2030 (%)
Data Table on Mexico - Year-over-year growth 2025-2030 (%)

12.6 South America - Market size and forecast 2025-2030

Chart on South America - Market size and forecast 2025-2030 ($ million)
Data Table on South America - Market size and forecast 2025-2030 ($ million)
Chart on South America - Year-over-year growth 2025-2030 (%)
Data Table on South America - Year-over-year growth 2025-2030 (%)
Chart on Regional Comparison - South America
Data Table on Regional Comparison - South America

12.6.1 Brazil - Market size and forecast 2025-2030

Chart on Brazil - Market size and forecast 2025-2030 ($ million)
Data Table on Brazil - Market size and forecast 2025-2030 ($ million)
Chart on Brazil - Year-over-year growth 2025-2030 (%)
Data Table on Brazil - Year-over-year growth 2025-2030 (%)

12.6.2 Argentina - Market size and forecast 2025-2030

Chart on Argentina - Market size and forecast 2025-2030 ($ million)
Data Table on Argentina - Market size and forecast 2025-2030 ($ million)
Chart on Argentina - Year-over-year growth 2025-2030 (%)
Data Table on Argentina - Year-over-year growth 2025-2030 (%)

12.6.3 Chile - Market size and forecast 2025-2030

Chart on Chile - Market size and forecast 2025-2030 ($ million)
Data Table on Chile - Market size and forecast 2025-2030 ($ million)
Chart on Chile - Year-over-year growth 2025-2030 (%)
Data Table on Chile - Year-over-year growth 2025-2030 (%)

12.7 Middle East and Africa - Market size and forecast 2025-2030

Chart on Middle East and Africa - Market size and forecast 2025-2030 ($ million)
Data Table on Middle East and Africa - Market size and forecast 2025-2030 ($ million)
Chart on Middle East and Africa - Year-over-year growth 2025-2030 (%)
Data Table on Middle East and Africa - Year-over-year growth 2025-2030 (%)
Chart on Regional Comparison - Middle East and Africa
Data Table on Regional Comparison - Middle East and Africa

12.7.1 Saudi Arabia - Market size and forecast 2025-2030

Chart on Saudi Arabia - Market size and forecast 2025-2030 ($ million)
Data Table on Saudi Arabia - Market size and forecast 2025-2030 ($ million)
Chart on Saudi Arabia - Year-over-year growth 2025-2030 (%)
Data Table on Saudi Arabia - Year-over-year growth 2025-2030 (%)

12.7.2 UAE - Market size and forecast 2025-2030

Chart on UAE - Market size and forecast 2025-2030 ($ million)
Data Table on UAE - Market size and forecast 2025-2030 ($ million)
Chart on UAE - Year-over-year growth 2025-2030 (%)
Data Table on UAE - Year-over-year growth 2025-2030 (%)

12.7.3 South Africa - Market size and forecast 2025-2030

Chart on South Africa - Market size and forecast 2025-2030 ($ million)
Data Table on South Africa - Market size and forecast 2025-2030 ($ million)
Chart on South Africa - Year-over-year growth 2025-2030 (%)
Data Table on South Africa - Year-over-year growth 2025-2030 (%)

12.7.4 Turkey - Market size and forecast 2025-2030

Chart on Turkey - Market size and forecast 2025-2030 ($ million)
Data Table on Turkey - Market size and forecast 2025-2030 ($ million)
Chart on Turkey - Year-over-year growth 2025-2030 (%)
Data Table on Turkey - Year-over-year growth 2025-2030 (%)

12.7.5 Israel - Market size and forecast 2025-2030

Chart on Israel - Market size and forecast 2025-2030 ($ million)
Data Table on Israel - Market size and forecast 2025-2030 ($ million)
Chart on Israel - Year-over-year growth 2025-2030 (%)
Data Table on Israel - Year-over-year growth 2025-2030 (%)

12.8 Market opportunity by geography

Market opportunity by geography ($ million)
Data Tables on Market opportunity by geography ($ million)

13. Drivers, Challenges, and Opportunity

13.1 Market drivers

Global expansion of educational institutions and increasing literacy initiatives in emerging economies
Rising consumer preference for creative segments, hobbyist artistry, and bullet journaling
Corporate premiumization trends and strategic resurgence of luxury writing instruments

13.2 Market challenges

Accelerating digitalization and proliferation of paperless educational and corporate ecosystems
Escalating compliance pressures and eco-conscious material substitution mandates
Extreme volatility in petrochemical raw materials and fragmented supply chain logistics

13.3 Impact of drivers and challenges

Impact of drivers and challenges in 2025 and 2030

13.4 Market opportunities

Environmental regulations and green consumerism driving product transformation
Increasing access to education strengthening core market fundamentals
Corporate gifting and product personalization driving high-margin growth

14. Competitive Landscape

14.1 Overview

14.2

Overview on criticality of inputs and factors of differentiation

14.3 Landscape disruption

Overview on factors of disruption

14.4 Industry risks

Impact of key risks on business

15. Competitive Analysis

15.1 Companies profiled

Companies covered

15.2 Company ranking index

15.3 Market positioning of companies

Matrix on companies position and classification

15.4 A. T. Cross Co. LLC

A. T. Cross Co. LLC - Overview
A. T. Cross Co. LLC - Product / Service
A. T. Cross Co. LLC - Key offerings
SWOT

15.5 Crayola

Crayola - Overview
Crayola - Product / Service
Crayola - Key offerings
SWOT

15.6 Faber Castell AG

Faber Castell AG - Overview
Faber Castell AG - Product / Service
Faber Castell AG - Key offerings
SWOT

15.7 Flair Pens

Flair Pens - Overview
Flair Pens - Product / Service
Flair Pens - Key offerings
SWOT

15.8 Kokuyo Camlin Ltd

Kokuyo Camlin Ltd - Overview
Kokuyo Camlin Ltd - Product / Service
Kokuyo Camlin Ltd - Key offerings
SWOT

15.9 Linc Pen and Plastics Ltd.

Linc Pen and Plastics Ltd. - Overview
Linc Pen and Plastics Ltd. - Product / Service
Linc Pen and Plastics Ltd. - Key offerings
SWOT

15.10 MITSUBISHI PENCIL Co. Ltd.

MITSUBISHI PENCIL Co. Ltd. - Overview
MITSUBISHI PENCIL Co. Ltd. - Business segments
MITSUBISHI PENCIL Co. Ltd. - Key offerings
MITSUBISHI PENCIL Co. Ltd. - Segment focus
SWOT

15.11 Pentel of America Ltd.

Pentel of America Ltd. - Overview
Pentel of America Ltd. - Product / Service
Pentel of America Ltd. - Key offerings
SWOT

15.12 PILOT Corp.

PILOT Corp. - Overview
PILOT Corp. - Product / Service
PILOT Corp. - Key offerings
SWOT

15.13 Schneider Schreibgerate GmbH

Schneider Schreibgerate GmbH - Overview
Schneider Schreibgerate GmbH - Product / Service
Schneider Schreibgerate GmbH - Key offerings
SWOT

15.14 Shanghai M and G Stationery Inc.

Shanghai M and G Stationery Inc. - Overview
Shanghai M and G Stationery Inc. - Product / Service
Shanghai M and G Stationery Inc. - Key offerings
SWOT

15.15 Societe Bic S.A

Societe Bic S.A - Overview
Societe Bic S.A - Product / Service
Societe Bic S.A - Key offerings
SWOT

15.16 Staedtler Mars GmbH

Staedtler Mars GmbH - Overview
Staedtler Mars GmbH - Product / Service
Staedtler Mars GmbH - Key offerings
SWOT

15.17 Tombow Pencil Co. Ltd.

Tombow Pencil Co. Ltd. - Overview
Tombow Pencil Co. Ltd. - Product / Service
Tombow Pencil Co. Ltd. - Key offerings
SWOT

15.18 Zebra Pen Corp.

Zebra Pen Corp. - Overview
Zebra Pen Corp. - Product / Service
Zebra Pen Corp. - Key offerings
SWOT

16. Appendix

16.1 Scope of the report

Market definition
Objectives
Notes and caveats

16.2 Inclusions and exclusions checklist

Inclusions checklist
Exclusions checklist

16.3 Currency conversion rates for US$

16.4 Research methodology

16.5 Data procurement

Information sources

16.6 Data validation

16.7 Validation techniques employed for market sizing

16.8 Data synthesis

16.9 360 degree market analysis

16.10 List of abbreviations

Research Methodology

Technavio presents a detailed picture of the market by way of study, synthesis, and summation of data from multiple sources. The analysts have presented the various facets of the market with a particular focus on identifying the key industry influencers. The data thus presented is comprehensive, reliable, and the result of extensive research, both primary and secondary.

INFORMATION SOURCES

Primary sources

  • Manufacturers and suppliers
  • Channel partners
  • Industry experts
  • Strategic decision makers

Secondary sources

  • Industry journals and periodicals
  • Government data
  • Financial reports of key industry players
  • Historical data
  • Press releases

DATA ANALYSIS

Data Synthesis

  • Collation of data
  • Estimation of key figures
  • Analysis of derived insights

Data Validation

  • Triangulation with data models
  • Reference against proprietary databases
  • Corroboration with industry experts

REPORT WRITING

Qualitative

  • Market drivers
  • Market challenges
  • Market trends
  • Five forces analysis

Quantitative

  • Market size and forecast
  • Market segmentation
  • Geographical insights
  • Competitive landscape

Interested in this report?

Get your sample now to see our research methodology and insights!

Download Now

Frequently Asked Questions

Writing And Marking Instruments market growth will increase by USD 14226.5 million during 2026-2030.

The Writing And Marking Instruments market is expected to grow at a CAGR of 7.7% during 2026-2030.

Writing And Marking Instruments market is segmented by Distribution channel (Offline, Online) Application (Students, Working professionals, Institutions) Material (Plastic, Wood, Metal, Recycled materials)

A. T. Cross Co. LLC, Crayola, Faber Castell AG, Flair Pens, Hindustan Pencils Pvt. Ltd., Kokuyo Camlin Ltd, Linc Pen and Plastics Ltd., Maped, MITSUBISHI PENCIL Co. Ltd., PARKER, Pelikan International Corp., Pentel of America Ltd., PILOT Corp., Schneider Schreibgerate GmbH, Schwanhausser Holding GmbH, Shanghai M and G Stationery Inc., Societe Bic S.A, Staedtler Mars GmbH, Tombow Pencil Co. Ltd., Zebra Pen Corp. are a few of the key vendors in the Writing And Marking Instruments market.

APAC will register the highest growth rate of 57% among the other regions. Therefore, the Writing And Marking Instruments market in APAC is expected to garner significant business opportunities for the vendors during the forecast period.

China, Japan, India, South Korea, Indonesia, Australia, Germany, UK, France, Italy, Spain, The Netherlands, US, Canada, Mexico, Brazil, Argentina, Chile, Saudi Arabia, UAE, South Africa, Turkey, Israel

  • Global expansion of educational institutions and increasing literacy initiatives in emerging economies is the driving factor this market.

The Writing And Marking Instruments market vendors should focus on grabbing business opportunities from the Distribution channel segment as it accounted for the largest market share in the base year.
RIA - Research AI Assistant
Ask RIA
