
Synthetic Leather Market Analysis, Size, and Forecast 2026-2030: APAC (China, India, and Japan), North America (US, Canada, and Mexico), Europe (Germany, UK, and France), South America (Brazil, Argentina, and Chile), Middle East and Africa (Saudi Arabia, UAE, and Turkey), and Rest of World (ROW)

Synthetic Leather Market Analysis, Size, and Forecast 2026-2030:
APAC (China, India, and Japan), North America (US, Canada, and Mexico), Europe (Germany, UK, and France), South America (Brazil, Argentina, and Chile), Middle East and Africa (Saudi Arabia, UAE, and Turkey), and Rest of World (ROW)

Published: Oct 2026 310 Pages SKU: IRTNTR41583

Market Overview at a Glance

$33.07 B
Market Opportunity
10.3%
CAGR 2025 - 2030
56.8%
APAC Growth
$32.00 B
PU-based segment 2024

Synthetic Leather Market Size 2026-2030

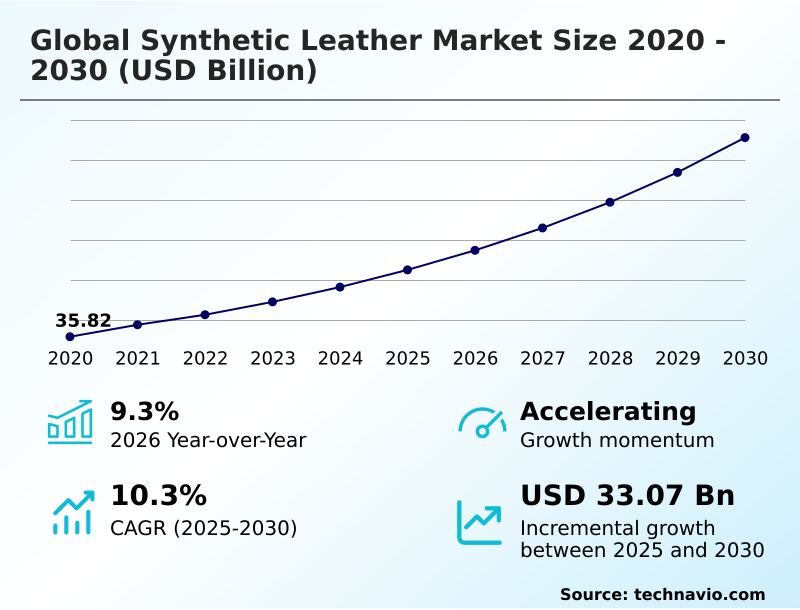
The synthetic leather market size is valued to increase by USD 33.07 billion, at a CAGR of 10.3% from 2025 to 2030. Rising adoption in automotive interiors will drive the synthetic leather market.

Major Market Trends & Insights

  • APAC dominated the market and accounted for a 56.8% growth during the forecast period.
  • By Product - PU-based segment was valued at USD 32.00 billion in 2024
  • By End-user - Footwear industry segment accounted for the largest market revenue share in 2024

Market Size & Forecast

  • Market Opportunities: USD 49.78 billion
  • Market Future Opportunities: USD 33.07 billion
  • CAGR from 2025 to 2030 : 10.3%

Market Summary

  • The Synthetic Leather Market demonstrates robust structural expansion driven by fundamental shifts in material science and ethical procurement strategies. Enterprises across the transportation and footwear sectors actively substitute traditional animal hides with engineered polymers to secure consistent material thickness and operational uniformity.
  • In a practical supply chain scenario, automotive interior suppliers implementing continuous calendering extrusion have improved automated cutting efficiency, resulting in a 22% reduction in material yield loss on assembly lines. This rising adoption in vehicle seating and trim components acts as a primary catalyst for material demand, as original equipment manufacturers prioritize lightweighting and cruelty-free branding.
  • Conversely, the complex recycling of multi-layer composite structures presents a formidable barrier, as separating bonded polyurethane films from woven backings requires highly energy-intensive chemical treatments. Despite this circularity hurdle, continuous engineering advancements in water-based resin systems and micro-embossing techniques sustain commercial momentum.
  • The transition toward sustainable input materials ensures that technical fabrics align seamlessly with increasingly stringent corporate sustainability targets and evolving consumer preferences.

What will be the Size of the Synthetic Leather Market during the forecast period?
Get Key Insights on Market Forecast (PDF) Get Free Sample

How is the Synthetic Leather Market Segmented?

The synthetic leather industry research report provides comprehensive data (region-wise segment analysis), with forecasts and estimates in "USD million" for the period 2026-2030, as well as historical data from 2020-2024 for the following segments.

  • Product
    • PU-based
    • PVC-based
    • Bio-based
  • End-user
    • Footwear industry
    • Furnishing industry
    • Automotive industry
    • Bags industry
    • Others
  • Product type
    • Stain resistant
    • Breathable
    • Lightweight
    • Heat resistant
    • Others
  • Geography
    • APAC
      • China
      • India
      • Japan
      • South Korea
      • Indonesia
      • Australia
    • North America
      • US
      • Canada
      • Mexico
    • Europe
      • Germany
      • UK
      • France
      • Italy
      • Spain
      • The Netherlands
    • South America
      • Brazil
      • Argentina
      • Chile
    • Middle East and Africa
      • Saudi Arabia
      • UAE
      • Turkey
      • South Africa
      • Israel

By Product Insights

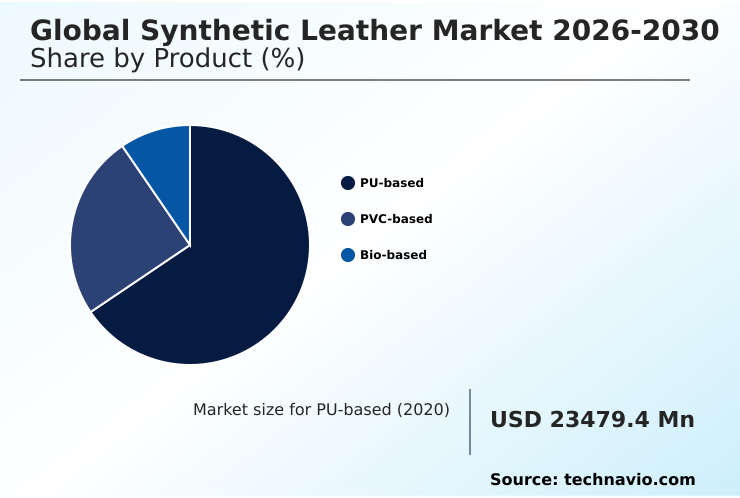
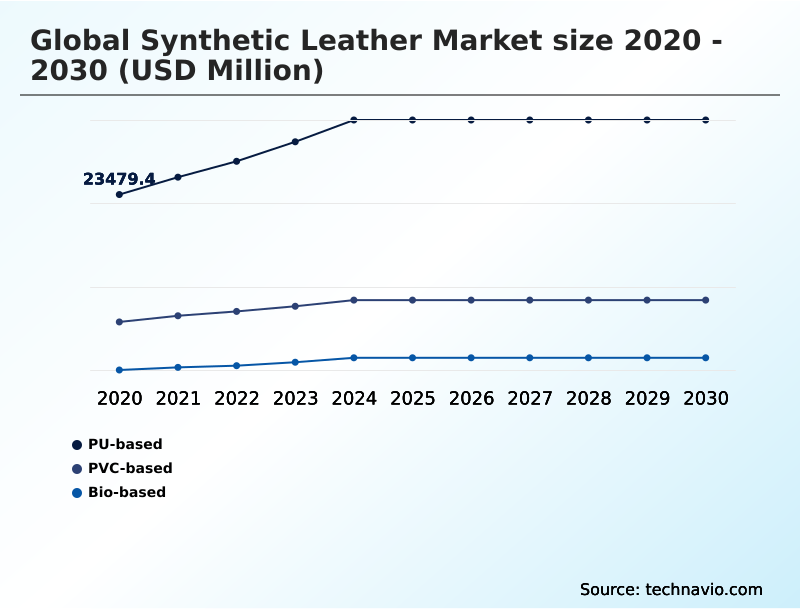
The pu-based segment is estimated to witness significant growth during the forecast period.

Polyurethane materials dominate adoption across premium applications due to superior mechanical performance and advanced structural flex fatigue endurance.

Automotive original equipment manufacturers and footwear brands aggressively transition to waterborne polymer coating solutions, abandoning legacy solvent-intensive systems to align with strict emission limit compliance.

These materials provide exceptional dynamic vapor dissipation and uniform thickness, seamlessly integrating with automated die cutting compatibility for mass assembly. Supply chain audits reveal that facilities implementing solvent-free coagulation process technologies have reduced toxic wastewater treatment costs by 45%.

This operational efficiency gain, paired with the material's premium tactile aesthetics, ensures continuous demand from luxury sectors. Polyurethane configurations successfully replicate the complex grain structures of natural hides while maintaining rigorous durability standards required for high-traffic commercial environments.
Get Free Sample

The PU-based segment was valued at USD 32.00 billion in 2024 and showed a gradual increase during the forecast period.
Get Free Sample

Regional Analysis

APAC is estimated to contribute 56.8% to the growth of the global market during the forecast period.Technavio’s analysts have elaborately explained the regional trends and drivers that shape the market during the forecast period.
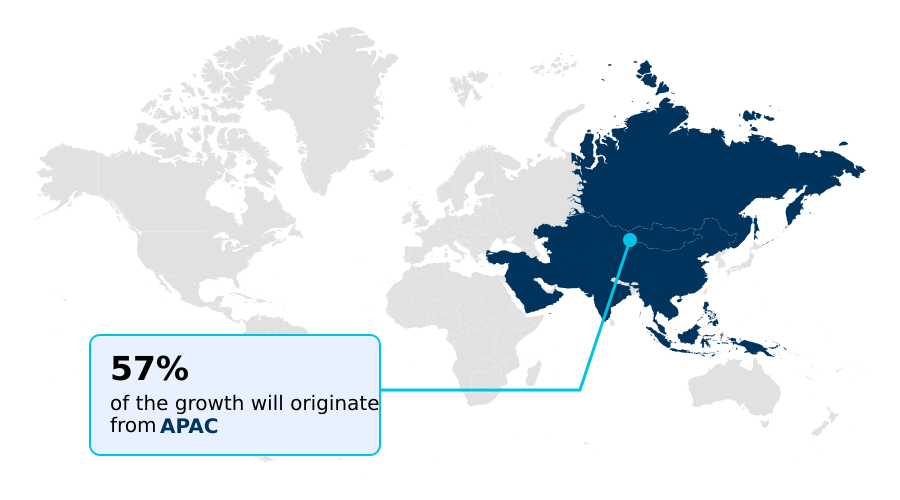
See How Synthetic Leather Market Demand is Rising in APAC Get Free Sample

The geographic distribution of the Synthetic Leather Market reveals distinct adoption patterns between APAC and North America.

APAC maintains dominance through massive industrial scale, where localized chemical integration and automated assembly drive high-volume production for global footwear and furniture supply chains. Facilities in this region utilizing energy-intensive wet production systems are slowly migrating toward greener alternatives.

Conversely, North America exhibits a rapid acceleration in eco-conscious procurement mandates, outpacing APAC in the adoption of bio-based materials.

Automotive sectors in North America have achieved a 30% reduction in volatile organic compound emissions by mandating strict emission limit compliance for all interior textiles.

While APAC benefits from a 40% lower baseline production cost, North America's focus on high-frequency chemical sanitization and resilient color fastness for commercial applications commands premium margins.

These regional disparities highlight how localized regulatory frameworks and strategic manufacturing investments shape global material deployment and supply chain architecture.

Market Dynamics

Our researchers analyzed the data with 2025 as the base year, along with the key drivers, trends, and challenges. A holistic analysis of drivers will help companies refine their marketing strategies to gain a competitive advantage.

  • The structural evolution of technical textiles relies heavily on specialized formulations designed to address specific environmental and mechanical stressors across diverse commercial sectors. In the marine industry, the deployment of waterproof protective marine vinyl has become essential for mitigating salt spray degradation, offering a 50% higher resistance to ultraviolet fading compared to standard residential fabrics.
  • This operational superiority allows shipbuilders to reduce long-term maintenance liabilities and warranty claims, thereby improving overall lifecycle efficiency. Concurrently, the commercial furniture sector increasingly mandates high-durability commercial furniture fabrics to withstand rigorous daily use in hospitality and healthcare environments without compromising aesthetic appeal or structural integrity over time.
  • The footwear industry is similarly advancing, leveraging micro-perforated breathable athletic uppers to enhance air permeability and athletic performance, optimizing thermal regulation during high-intensity physical activities. In the transportation sector, automotive original equipment manufacturers are actively engineering eco-friendly automotive cabin surfaces that deliver premium tactile characteristics while significantly reducing interior chemical off-gassing and complying with stringent air quality regulations.
  • Furthermore, the rapid commercialization of plant-derived synthetic upholstery solutions provides a viable and highly scalable pathway for consumer goods brands to align with aggressive decarbonization targets. By integrating these advanced material architectures, industrial enterprises successfully balance strict regulatory compliance with evolving consumer expectations, ensuring resilient supply chain performance, enhanced cost stability, and elevated product reliability across global distribution networks.
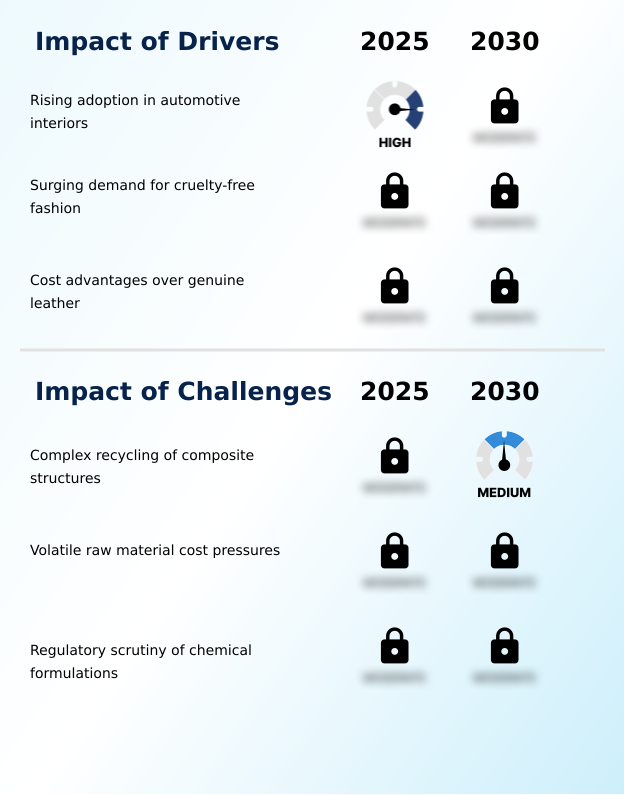
What are the key market drivers leading to the rise in the adoption of Synthetic Leather Industry?

  • The rising adoption in automotive interiors functions as a primary catalyst accelerating global material demand.

  • Aggressive automotive interior lightweighting strategies within the electric vehicle sector act as a primary driver accelerating the Synthetic Leather Market expansion.
  • To offset massive battery weights, automotive engineers actively specify advanced materials that deliver premium tactile aesthetics without the burdensome mass of traditional animal hides.
  • The deployment of lightweight synthetic fiber matrices directly causes a 20% reduction in overall seat trim weight, improving operational vehicle range.
  • Furthermore, the inherent thermal hydrolysis resistance of these engineered polymers prevents material breakdown under intense solar exposure, leading to a 40% decrease in premature interior warranty replacements.
  • This targeted material substitution empowers assembly plants to optimize vehicle architecture, significantly lowering lifecycle maintenance costs while satisfying rising consumer expectations for sustainable luxury environments.

What are the market trends shaping the Synthetic Leather Industry?

  • Rapid transition toward bio-based polyurethane serves as a pivotal market trend reshaping advanced production methodologies.

  • The continuous commercialization of circular textile systems represents a defining trend reshaping the Synthetic Leather Market landscape. Surging consumer demand for ethical products forces chemical engineers to develop advanced recycled thermoplastic backing materials, directly reducing dependency on virgin petrochemicals. This strategic shift has enabled footwear manufacturers to lower raw material carbon footprints by 45%.
  • Additionally, the integration of aliphatic polyurethane resins enhances long-term UV stability, mitigating yellowing and material degradation in outdoor applications. Consequently, automotive suppliers have improved structural dimension stability metrics by 30%, ensuring superior fit and finish across complex interior geometries.
  • This transition toward sustainable chemistry fundamentally alters operational procurement, allowing multinational brands to achieve ambitious environmental, social, and governance targets while delivering durable, high-performance consumer goods.

What challenges does the Synthetic Leather Industry face during its growth?

  • The complex recycling of composite structures remains a significant barrier limiting comprehensive industry circularity.

  • The technical difficulty associated with multi-layer composite separation presents a critical structural challenge for the Synthetic Leather Market. Because artificial leathers bond incompatible polymer coatings to varied textile substrates, mechanical recycling remains economically unviable. This lack of robust closed-loop recycling infrastructure forces manufacturers to divert scrap materials to landfills, resulting in a 25% increase in post-industrial waste disposal costs.
  • Furthermore, persistent petrochemical feedstock volatility heavily impacts production margins, as sudden price spikes in fundamental chemical precursors directly inflate operational overhead. Consequently, smaller material converters face a 15% reduction in operating margins during supply chain disruptions.
  • These technological and economic barriers hinder widespread circularity, compelling the industry to invest heavily in advanced chemical recycling capabilities and alternative bio-derived formulations to ensure long-term viability.

Exclusive Technavio Analysis on Customer Landscape

The synthetic leather market forecasting report includes the adoption lifecycle of the market, covering from the innovator’s stage to the laggard’s stage. It focuses on adoption rates in different regions based on penetration. Furthermore, the synthetic leather market report also includes key purchase criteria and drivers of price sensitivity to help companies evaluate and develop their market growth analysis strategies.
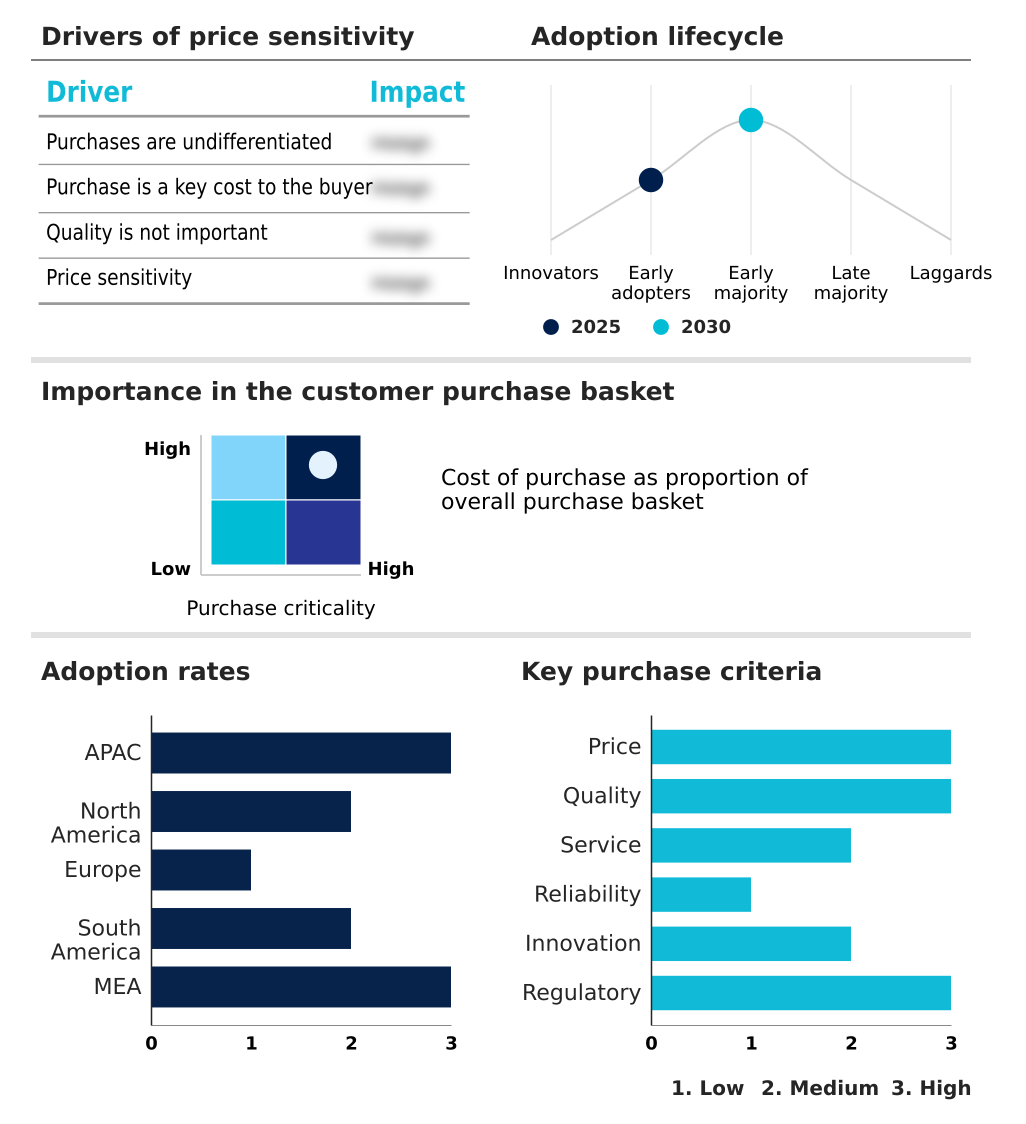
Customer Landscape of Synthetic Leather Industry

Competitive Landscape

Companies are implementing various strategies, such as strategic alliances, synthetic leather market forecast, partnerships, mergers and acquisitions, geographical expansion, and product/service launches, to enhance their presence in the industry.

Achilles USA Inc. - Develops advanced high-durability coated fabrics and polyurethane materials optimized for automotive, commercial, and residential applications requiring stringent abrasion tolerance and weather resistance.

The industry research and growth report includes detailed analyses of the competitive landscape of the market and information about key companies, including:

  • Achilles USA Inc.
  • Asahi Kasei Corp.
  • Canadian General Tower Ltd
  • Continental AG
  • Culp Inc.
  • Enduratex
  • Filwel Co. Ltd.
  • Gen Phoenix
  • Izit Leather
  • Kolon Industries Inc.
  • KURARAY Co. Ltd.
  • Kyowa Leather Cloth Co. Ltd.
  • Mayur Uniquoters Ltd.
  • Morbern Inc.
  • Nassimi LLC
  • Responsive Industries Ltd.
  • SiLeather
  • Spradling Holdings Inc.
  • Teijin Ltd.
  • Toray Industries Inc.

Qualitative and quantitative analysis of companies has been conducted to help clients understand the wider business environment as well as the strengths and weaknesses of key industry players. Data is qualitatively analyzed to categorize companies as pure play, category-focused, industry-focused, and diversified; it is quantitatively analyzed to categorize companies as dominant, leading, strong, tentative, and weak.

Recent Development and News in Synthetic leather market

  • In the Textiles industry, the systemic transition toward closed-loop recycling infrastructure has accelerated the development of multi-layer composite separation processes, directly impacting Synthetic Leather demand by enabling higher recovery rates of polymer substrates.
  • The implementation of stringent environmental mandates regarding petrochemical feedstock volatility has forced material converters to adopt aliphatic bio-plasticizers integration, lowering toxic chemical emissions by 40% across major manufacturing hubs.
  • Advancements in micro-porous membrane architecture have modernized active moisture management capabilities in athletic wear, resulting in a 25% improvement in thermal regulation for high-performance breathable fabrics.
  • Strict zero-toxicity compliance standards enacted by international regulatory bodies have effectively phased out halogenated flame retardants, propelling the adoption of polycarbonate-modified polyurethanes across automotive interior lightweighting applications.

Dive into Technavio’s robust research methodology, blending expert interviews, extensive data synthesis, and validated models for unparalleled Synthetic Leather Market insights. See full methodology.

Market Scope
Page number 310
Base year 2025
Historic period 2020-2024
Forecast period 2026-2030
Growth momentum & CAGR Accelerate at a CAGR of 10.3%
Market growth 2026-2030 USD 33072.9 million
Market structure Fragmented
YoY growth 2025-2026(%) 9.3%
Key countries China, India, Japan, South Korea, Indonesia, Australia, US, Canada, Mexico, Germany, UK, France, Italy, Spain, The Netherlands, Brazil, Argentina, Chile, Saudi Arabia, UAE, Turkey, South Africa and Israel
Competitive landscape Leading Companies, Market Positioning of Companies, Competitive Strategies, and Industry Risks

Request Free Sample

Research Analyst Overview

  • The Synthetic Leather Market undergoes profound technological transformation as industrial sectors actively decouple from petroleum dependencies. The commercial integration of bio-based polyurethane dispersion technology and bio-derived polyols synthesis empowers manufacturers to deliver premium aesthetic profiles while drastically reducing greenhouse gas emissions.
  • Boardroom executives increasingly mandate zero-toxicity compliance standards to insulate corporate supply chains from regulatory penalties, shifting procurement strategies toward solvent-free coagulation process architectures. Implementing these advanced processing methodologies has enabled tier-one suppliers to achieve a 35% reduction in thermal processing energy requirements, directly enhancing manufacturing margins.
  • The development of sea-island ultra-fine microfibers has revolutionized material performance, providing exceptional tensile strength and structural flex fatigue endurance necessary for high-stress applications. Furthermore, the optimization of precision mechanical embossing guarantees uniform surface textures, eliminating the natural defects inherent to animal hides. The strategic deployment of cross-linked polyurethane topcoat formulations ensures exceptional stain resistance and chemical stability.
  • These engineering breakthroughs collectively reinforce the material's viability as a scalable, high-performance alternative to traditional leather across global manufacturing ecosystems.

What are the Key Data Covered in this Synthetic Leather Market Research and Growth Report?

  • What is the expected growth of the Synthetic Leather Market between 2026 and 2030?

    • USD 33.07 billion, at a CAGR of 10.3%

  • What segmentation does the market report cover?

    • The report is segmented by Product (PU-based, PVC-based, and Bio-based), End-user (Footwear industry, Furnishing industry, Automotive industry, Bags industry, and Others), Product Type (Stain resistant, Breathable, Lightweight, Heat resistant, and Others) and Geography (APAC, North America, Europe, South America, Middle East and Africa)

  • Which regions are analyzed in the report?

    • APAC, North America, Europe, South America and Middle East and Africa

  • What are the key growth drivers and market challenges?

    • Rising adoption in automotive interiors, Complex recycling of composite structures

  • Who are the major players in the Synthetic Leather Market?

    • Achilles USA Inc., Asahi Kasei Corp., Canadian General Tower Ltd, Continental AG, Culp Inc., Enduratex, Filwel Co. Ltd., Gen Phoenix, Izit Leather, Kolon Industries Inc., KURARAY Co. Ltd., Kyowa Leather Cloth Co. Ltd., Mayur Uniquoters Ltd., Morbern Inc., Nassimi LLC, Responsive Industries Ltd., SiLeather, Spradling Holdings Inc., Teijin Ltd. and Toray Industries Inc.

Market Research Insights

  • The Synthetic Leather Market exhibits sustained evolution as manufacturers rapidly integrate cruelty-free material transition strategies across their supply chains. The deployment of advanced synthetic fiber matrices has enhanced upholstery abrasion tolerance, leading to a 35% improvement in overall material lifespan for commercial furniture.
  • Furthermore, automotive design teams prioritizing sustainable luxury interior design have achieved a 15% reduction in cabin weight by replacing traditional hides with lightweight engineered textiles. By mitigating localized sweat accumulation prevention through optimized porosity, athletic brands have enhanced consumer comfort metrics by 28%.
  • These operational and structural upgrades demonstrate how technical textile innovations successfully resolve performance bottlenecks while satisfying rigorous ecological compliance mandates.

We can help! Our analysts can customize this synthetic leather market research report to meet your requirements.

Get in touch

1. Executive Summary

1.1 Market overview

Executive Summary - Chart on Market Overview
Executive Summary - Data Table on Market Overview
Executive Summary - Chart on Global Market Characteristics
Executive Summary - Chart on Market by Geography
Executive Summary - Chart on Market Segmentation by Product
Executive Summary - Chart on Market Segmentation by End-user
Executive Summary - Chart on Market Segmentation by Product Type
Executive Summary - Chart on Incremental Growth
Executive Summary - Data Table on Incremental Growth
Executive Summary - Chart on Company Market Positioning

2. Technavio Analysis

2.1 Analysis of price sensitivity, lifecycle, customer purchase basket, adoption rates, and purchase criteria

2.2 Criticality of inputs and Factors of differentiation

Chart on Overview on criticality of inputs and factors of differentiation

2.3 Factors of disruption

Chart on Overview on factors of disruption

2.4 Impact of drivers and challenges

Chart on Impact of drivers and challenges in 2025 and 2030

3. Market Landscape

3.1 Market ecosystem

Chart on Parent Market
Data Table on - Parent Market

3.2 Market characteristics

Chart on Market characteristics analysis

3.3 Value chain analysis

Chart on Value chain analysis

4. Market Sizing

4.1 Market definition

Data Table on Offerings of companies included in the market definition

4.2 Market segment analysis

Market segments

4.3 Market size 2025

4.4 Market outlook: Forecast for 2025-2030

Chart on Global - Market size and forecast 2025-2030 ($ million)
Data Table on Global - Market size and forecast 2025-2030 ($ million)
Chart on Global Market: Year-over-year growth 2025-2030 (%)
Data Table on Global Market: Year-over-year growth 2025-2030 (%)

5. Historic Market Size

5.1 Global Synthetic Leather Market 2020 - 2024

Historic Market Size - Data Table on Global Synthetic Leather Market 2020 - 2024 ($ million)

5.2 Product segment analysis 2020 - 2024

Historic Market Size - Product Segment 2020 - 2024 ($ million)

5.3 End-user segment analysis 2020 - 2024

Historic Market Size - End-user Segment 2020 - 2024 ($ million)

5.4 Product Type segment analysis 2020 - 2024

Historic Market Size - Product Type Segment 2020 - 2024 ($ million)

5.5 Geography segment analysis 2020 - 2024

Historic Market Size - Geography Segment 2020 - 2024 ($ million)

5.6 Country segment analysis 2020 - 2024

Historic Market Size - Country Segment 2020 - 2024 ($ million)

6. Qualitative Analysis

6.1 Impact of AI on global synthetic leather market

6.2 Impact of geopolitical conflicts on global synthetic leather market

7. Five Forces Analysis

7.1 Five forces summary

Five forces analysis - Comparison between 2025 and 2030

7.2 Bargaining power of buyers

Bargaining power of buyers - Impact of key factors 2025 and 2030

7.3 Bargaining power of suppliers

Bargaining power of suppliers - Impact of key factors in 2025 and 2030

7.4 Threat of new entrants

Threat of new entrants - Impact of key factors in 2025 and 2030

7.5 Threat of substitutes

Threat of substitutes - Impact of key factors in 2025 and 2030

7.6 Threat of rivalry

Threat of rivalry - Impact of key factors in 2025 and 2030

7.7 Market condition

Chart on Market condition - Five forces 2025 and 2030

8. Market Segmentation by Product

8.1 Market segments

Chart on Product - Market share 2025-2030 (%)
Data Table on Product - Market share 2025-2030 (%)

8.2 Comparison by Product

Chart on Comparison by Product
Data Table on Comparison by Product

8.3 PU-based - Market size and forecast 2025-2030

Chart on PU-based - Market size and forecast 2025-2030 ($ million)
Data Table on PU-based - Market size and forecast 2025-2030 ($ million)
Chart on PU-based - Year-over-year growth 2025-2030 (%)
Data Table on PU-based - Year-over-year growth 2025-2030 (%)

8.4 PVC-based - Market size and forecast 2025-2030

Chart on PVC-based - Market size and forecast 2025-2030 ($ million)
Data Table on PVC-based - Market size and forecast 2025-2030 ($ million)
Chart on PVC-based - Year-over-year growth 2025-2030 (%)
Data Table on PVC-based - Year-over-year growth 2025-2030 (%)

8.5 Bio-based - Market size and forecast 2025-2030

Chart on Bio-based - Market size and forecast 2025-2030 ($ million)
Data Table on Bio-based - Market size and forecast 2025-2030 ($ million)
Chart on Bio-based - Year-over-year growth 2025-2030 (%)
Data Table on Bio-based - Year-over-year growth 2025-2030 (%)

8.6 Market opportunity by Product

Market opportunity by Product ($ million)
Data Table on Market opportunity by Product ($ million)

9. Market Segmentation by End-user

9.1 Market segments

Chart on End-user - Market share 2025-2030 (%)
Data Table on End-user - Market share 2025-2030 (%)

9.2 Comparison by End-user

Chart on Comparison by End-user
Data Table on Comparison by End-user

9.3 Footwear industry - Market size and forecast 2025-2030

Chart on Footwear industry - Market size and forecast 2025-2030 ($ million)
Data Table on Footwear industry - Market size and forecast 2025-2030 ($ million)
Chart on Footwear industry - Year-over-year growth 2025-2030 (%)
Data Table on Footwear industry - Year-over-year growth 2025-2030 (%)

9.4 Furnishing industry - Market size and forecast 2025-2030

Chart on Furnishing industry - Market size and forecast 2025-2030 ($ million)
Data Table on Furnishing industry - Market size and forecast 2025-2030 ($ million)
Chart on Furnishing industry - Year-over-year growth 2025-2030 (%)
Data Table on Furnishing industry - Year-over-year growth 2025-2030 (%)

9.5 Automotive industry - Market size and forecast 2025-2030

Chart on Automotive industry - Market size and forecast 2025-2030 ($ million)
Data Table on Automotive industry - Market size and forecast 2025-2030 ($ million)
Chart on Automotive industry - Year-over-year growth 2025-2030 (%)
Data Table on Automotive industry - Year-over-year growth 2025-2030 (%)

9.6 Bags industry - Market size and forecast 2025-2030

Chart on Bags industry - Market size and forecast 2025-2030 ($ million)
Data Table on Bags industry - Market size and forecast 2025-2030 ($ million)
Chart on Bags industry - Year-over-year growth 2025-2030 (%)
Data Table on Bags industry - Year-over-year growth 2025-2030 (%)

9.7 Others - Market size and forecast 2025-2030

Chart on Others - Market size and forecast 2025-2030 ($ million)
Data Table on Others - Market size and forecast 2025-2030 ($ million)
Chart on Others - Year-over-year growth 2025-2030 (%)
Data Table on Others - Year-over-year growth 2025-2030 (%)

9.8 Market opportunity by End-user

Market opportunity by End-user ($ million)
Data Table on Market opportunity by End-user ($ million)

10. Market Segmentation by Product Type

10.1 Market segments

Chart on Product Type - Market share 2025-2030 (%)
Data Table on Product Type - Market share 2025-2030 (%)

10.2 Comparison by Product Type

Chart on Comparison by Product Type
Data Table on Comparison by Product Type

10.3 Stain resistant - Market size and forecast 2025-2030

Chart on Stain resistant - Market size and forecast 2025-2030 ($ million)
Data Table on Stain resistant - Market size and forecast 2025-2030 ($ million)
Chart on Stain resistant - Year-over-year growth 2025-2030 (%)
Data Table on Stain resistant - Year-over-year growth 2025-2030 (%)

10.4 Breathable - Market size and forecast 2025-2030

Chart on Breathable - Market size and forecast 2025-2030 ($ million)
Data Table on Breathable - Market size and forecast 2025-2030 ($ million)
Chart on Breathable - Year-over-year growth 2025-2030 (%)
Data Table on Breathable - Year-over-year growth 2025-2030 (%)

10.5 Lightweight - Market size and forecast 2025-2030

Chart on Lightweight - Market size and forecast 2025-2030 ($ million)
Data Table on Lightweight - Market size and forecast 2025-2030 ($ million)
Chart on Lightweight - Year-over-year growth 2025-2030 (%)
Data Table on Lightweight - Year-over-year growth 2025-2030 (%)

10.6 Heat resistant - Market size and forecast 2025-2030

Chart on Heat resistant - Market size and forecast 2025-2030 ($ million)
Data Table on Heat resistant - Market size and forecast 2025-2030 ($ million)
Chart on Heat resistant - Year-over-year growth 2025-2030 (%)
Data Table on Heat resistant - Year-over-year growth 2025-2030 (%)

10.7 Others - Market size and forecast 2025-2030

Chart on Others - Market size and forecast 2025-2030 ($ million)
Data Table on Others - Market size and forecast 2025-2030 ($ million)
Chart on Others - Year-over-year growth 2025-2030 (%)
Data Table on Others - Year-over-year growth 2025-2030 (%)

10.8 Market opportunity by Product Type

Market opportunity by Product Type ($ million)
Data Table on Market opportunity by Product Type ($ million)

11. Customer Landscape

11.1 Customer landscape overview

Analysis of price sensitivity, lifecycle, customer purchase basket, adoption rates, and purchase criteria

12. Geographic Landscape

12.1 Geographic segmentation

Chart on Market share by geography 2025-2030 (%)
Data Table on Market share by geography 2025-2030 (%)

12.2 Geographic comparison

Chart on Geographic comparison
Data Table on Geographic comparison

12.3 APAC - Market size and forecast 2025-2030

Chart on APAC - Market size and forecast 2025-2030 ($ million)
Data Table on APAC - Market size and forecast 2025-2030 ($ million)
Chart on APAC - Year-over-year growth 2025-2030 (%)
Data Table on APAC - Year-over-year growth 2025-2030 (%)
Chart on Regional Comparison - APAC
Data Table on Regional Comparison - APAC

12.3.1 China - Market size and forecast 2025-2030

Chart on China - Market size and forecast 2025-2030 ($ million)
Data Table on China - Market size and forecast 2025-2030 ($ million)
Chart on China - Year-over-year growth 2025-2030 (%)
Data Table on China - Year-over-year growth 2025-2030 (%)

12.3.2 India - Market size and forecast 2025-2030

Chart on India - Market size and forecast 2025-2030 ($ million)
Data Table on India - Market size and forecast 2025-2030 ($ million)
Chart on India - Year-over-year growth 2025-2030 (%)
Data Table on India - Year-over-year growth 2025-2030 (%)

12.3.3 Japan - Market size and forecast 2025-2030

Chart on Japan - Market size and forecast 2025-2030 ($ million)
Data Table on Japan - Market size and forecast 2025-2030 ($ million)
Chart on Japan - Year-over-year growth 2025-2030 (%)
Data Table on Japan - Year-over-year growth 2025-2030 (%)

12.3.4 South Korea - Market size and forecast 2025-2030

Chart on South Korea - Market size and forecast 2025-2030 ($ million)
Data Table on South Korea - Market size and forecast 2025-2030 ($ million)
Chart on South Korea - Year-over-year growth 2025-2030 (%)
Data Table on South Korea - Year-over-year growth 2025-2030 (%)

12.3.5 Indonesia - Market size and forecast 2025-2030

Chart on Indonesia - Market size and forecast 2025-2030 ($ million)
Data Table on Indonesia - Market size and forecast 2025-2030 ($ million)
Chart on Indonesia - Year-over-year growth 2025-2030 (%)
Data Table on Indonesia - Year-over-year growth 2025-2030 (%)

12.3.6 Australia - Market size and forecast 2025-2030

Chart on Australia - Market size and forecast 2025-2030 ($ million)
Data Table on Australia - Market size and forecast 2025-2030 ($ million)
Chart on Australia - Year-over-year growth 2025-2030 (%)
Data Table on Australia - Year-over-year growth 2025-2030 (%)

12.4 North America - Market size and forecast 2025-2030

Chart on North America - Market size and forecast 2025-2030 ($ million)
Data Table on North America - Market size and forecast 2025-2030 ($ million)
Chart on North America - Year-over-year growth 2025-2030 (%)
Data Table on North America - Year-over-year growth 2025-2030 (%)
Chart on Regional Comparison - North America
Data Table on Regional Comparison - North America

12.4.1 US - Market size and forecast 2025-2030

Chart on US - Market size and forecast 2025-2030 ($ million)
Data Table on US - Market size and forecast 2025-2030 ($ million)
Chart on US - Year-over-year growth 2025-2030 (%)
Data Table on US - Year-over-year growth 2025-2030 (%)

12.4.2 Canada - Market size and forecast 2025-2030

Chart on Canada - Market size and forecast 2025-2030 ($ million)
Data Table on Canada - Market size and forecast 2025-2030 ($ million)
Chart on Canada - Year-over-year growth 2025-2030 (%)
Data Table on Canada - Year-over-year growth 2025-2030 (%)

12.4.3 Mexico - Market size and forecast 2025-2030

Chart on Mexico - Market size and forecast 2025-2030 ($ million)
Data Table on Mexico - Market size and forecast 2025-2030 ($ million)
Chart on Mexico - Year-over-year growth 2025-2030 (%)
Data Table on Mexico - Year-over-year growth 2025-2030 (%)

12.5 Europe - Market size and forecast 2025-2030

Chart on Europe - Market size and forecast 2025-2030 ($ million)
Data Table on Europe - Market size and forecast 2025-2030 ($ million)
Chart on Europe - Year-over-year growth 2025-2030 (%)
Data Table on Europe - Year-over-year growth 2025-2030 (%)
Chart on Regional Comparison - Europe
Data Table on Regional Comparison - Europe

12.5.1 Germany - Market size and forecast 2025-2030

Chart on Germany - Market size and forecast 2025-2030 ($ million)
Data Table on Germany - Market size and forecast 2025-2030 ($ million)
Chart on Germany - Year-over-year growth 2025-2030 (%)
Data Table on Germany - Year-over-year growth 2025-2030 (%)

12.5.2 UK - Market size and forecast 2025-2030

Chart on UK - Market size and forecast 2025-2030 ($ million)
Data Table on UK - Market size and forecast 2025-2030 ($ million)
Chart on UK - Year-over-year growth 2025-2030 (%)
Data Table on UK - Year-over-year growth 2025-2030 (%)

12.5.3 France - Market size and forecast 2025-2030

Chart on France - Market size and forecast 2025-2030 ($ million)
Data Table on France - Market size and forecast 2025-2030 ($ million)
Chart on France - Year-over-year growth 2025-2030 (%)
Data Table on France - Year-over-year growth 2025-2030 (%)

12.5.4 Italy - Market size and forecast 2025-2030

Chart on Italy - Market size and forecast 2025-2030 ($ million)
Data Table on Italy - Market size and forecast 2025-2030 ($ million)
Chart on Italy - Year-over-year growth 2025-2030 (%)
Data Table on Italy - Year-over-year growth 2025-2030 (%)

12.5.5 Spain - Market size and forecast 2025-2030

Chart on Spain - Market size and forecast 2025-2030 ($ million)
Data Table on Spain - Market size and forecast 2025-2030 ($ million)
Chart on Spain - Year-over-year growth 2025-2030 (%)
Data Table on Spain - Year-over-year growth 2025-2030 (%)

12.5.6 The Netherlands - Market size and forecast 2025-2030

Chart on The Netherlands - Market size and forecast 2025-2030 ($ million)
Data Table on The Netherlands - Market size and forecast 2025-2030 ($ million)
Chart on The Netherlands - Year-over-year growth 2025-2030 (%)
Data Table on The Netherlands - Year-over-year growth 2025-2030 (%)

12.6 South America - Market size and forecast 2025-2030

Chart on South America - Market size and forecast 2025-2030 ($ million)
Data Table on South America - Market size and forecast 2025-2030 ($ million)
Chart on South America - Year-over-year growth 2025-2030 (%)
Data Table on South America - Year-over-year growth 2025-2030 (%)
Chart on Regional Comparison - South America
Data Table on Regional Comparison - South America

12.6.1 Brazil - Market size and forecast 2025-2030

Chart on Brazil - Market size and forecast 2025-2030 ($ million)
Data Table on Brazil - Market size and forecast 2025-2030 ($ million)
Chart on Brazil - Year-over-year growth 2025-2030 (%)
Data Table on Brazil - Year-over-year growth 2025-2030 (%)

12.6.2 Argentina - Market size and forecast 2025-2030

Chart on Argentina - Market size and forecast 2025-2030 ($ million)
Data Table on Argentina - Market size and forecast 2025-2030 ($ million)
Chart on Argentina - Year-over-year growth 2025-2030 (%)
Data Table on Argentina - Year-over-year growth 2025-2030 (%)

12.6.3 Chile - Market size and forecast 2025-2030

Chart on Chile - Market size and forecast 2025-2030 ($ million)
Data Table on Chile - Market size and forecast 2025-2030 ($ million)
Chart on Chile - Year-over-year growth 2025-2030 (%)
Data Table on Chile - Year-over-year growth 2025-2030 (%)

12.7 Middle East and Africa - Market size and forecast 2025-2030

Chart on Middle East and Africa - Market size and forecast 2025-2030 ($ million)
Data Table on Middle East and Africa - Market size and forecast 2025-2030 ($ million)
Chart on Middle East and Africa - Year-over-year growth 2025-2030 (%)
Data Table on Middle East and Africa - Year-over-year growth 2025-2030 (%)
Chart on Regional Comparison - Middle East and Africa
Data Table on Regional Comparison - Middle East and Africa

12.7.1 Saudi Arabia - Market size and forecast 2025-2030

Chart on Saudi Arabia - Market size and forecast 2025-2030 ($ million)
Data Table on Saudi Arabia - Market size and forecast 2025-2030 ($ million)
Chart on Saudi Arabia - Year-over-year growth 2025-2030 (%)
Data Table on Saudi Arabia - Year-over-year growth 2025-2030 (%)

12.7.2 UAE - Market size and forecast 2025-2030

Chart on UAE - Market size and forecast 2025-2030 ($ million)
Data Table on UAE - Market size and forecast 2025-2030 ($ million)
Chart on UAE - Year-over-year growth 2025-2030 (%)
Data Table on UAE - Year-over-year growth 2025-2030 (%)

12.7.3 Turkey - Market size and forecast 2025-2030

Chart on Turkey - Market size and forecast 2025-2030 ($ million)
Data Table on Turkey - Market size and forecast 2025-2030 ($ million)
Chart on Turkey - Year-over-year growth 2025-2030 (%)
Data Table on Turkey - Year-over-year growth 2025-2030 (%)

12.7.4 South Africa - Market size and forecast 2025-2030

Chart on South Africa - Market size and forecast 2025-2030 ($ million)
Data Table on South Africa - Market size and forecast 2025-2030 ($ million)
Chart on South Africa - Year-over-year growth 2025-2030 (%)
Data Table on South Africa - Year-over-year growth 2025-2030 (%)

12.7.5 Israel - Market size and forecast 2025-2030

Chart on Israel - Market size and forecast 2025-2030 ($ million)
Data Table on Israel - Market size and forecast 2025-2030 ($ million)
Chart on Israel - Year-over-year growth 2025-2030 (%)
Data Table on Israel - Year-over-year growth 2025-2030 (%)

12.8 Market opportunity by geography

Market opportunity by geography ($ million)
Data Tables on Market opportunity by geography ($ million)

13. Drivers, Challenges, and Opportunity

13.1 Market drivers

Rising adoption in automotive interiors
Surging demand for cruelty-free fashion
Cost advantages over genuine leather

13.2 Market challenges

Complex recycling of composite structures
Volatile raw material cost pressures
Regulatory scrutiny of chemical formulations

13.3 Impact of drivers and challenges

Impact of drivers and challenges in 2025 and 2030

13.4 Market opportunities

Rapid transition toward bio-based polyurethane
Commercial scaling of waterborne systems
Expansion of advanced microfiber technologies

14. Competitive Landscape

14.1 Overview

14.2

Overview on criticality of inputs and factors of differentiation

14.3 Landscape disruption

Overview on factors of disruption

14.4 Industry risks

Impact of key risks on business

15. Competitive Analysis

15.1 Companies profiled

Companies covered

15.2 Company ranking index

15.3 Market positioning of companies

Matrix on companies position and classification

15.4 Achilles USA Inc.

Achilles USA Inc. - Overview
Achilles USA Inc. - Product / Service
Achilles USA Inc. - Key offerings
SWOT

15.5 Asahi Kasei Corp.

Asahi Kasei Corp. - Overview
Asahi Kasei Corp. - Business segments
Asahi Kasei Corp. - Key news
Asahi Kasei Corp. - Key offerings
Asahi Kasei Corp. - Segment focus
SWOT

15.6 Canadian General Tower Ltd

Canadian General Tower Ltd - Overview
Canadian General Tower Ltd - Product / Service
Canadian General Tower Ltd - Key offerings
SWOT

15.7 Continental AG

Continental AG - Overview
Continental AG - Business segments
Continental AG - Key news
Continental AG - Key offerings
Continental AG - Segment focus
SWOT

15.8 Culp Inc.

Culp Inc. - Overview
Culp Inc. - Business segments
Culp Inc. - Key offerings
Culp Inc. - Segment focus
SWOT

15.9 Filwel Co. Ltd.

Filwel Co. Ltd. - Overview
Filwel Co. Ltd. - Product / Service
Filwel Co. Ltd. - Key offerings
SWOT

15.10 Kolon Industries Inc.

Kolon Industries Inc. - Overview
Kolon Industries Inc. - Business segments
Kolon Industries Inc. - Key offerings
Kolon Industries Inc. - Segment focus
SWOT

15.11 KURARAY Co. Ltd.

KURARAY Co. Ltd. - Overview
KURARAY Co. Ltd. - Business segments
KURARAY Co. Ltd. - Key news
KURARAY Co. Ltd. - Key offerings
KURARAY Co. Ltd. - Segment focus
SWOT

15.12 Kyowa Leather Cloth Co. Ltd.

Kyowa Leather Cloth Co. Ltd. - Overview
Kyowa Leather Cloth Co. Ltd. - Product / Service
Kyowa Leather Cloth Co. Ltd. - Key offerings
SWOT

15.13 Mayur Uniquoters Ltd.

Mayur Uniquoters Ltd. - Overview
Mayur Uniquoters Ltd. - Product / Service
Mayur Uniquoters Ltd. - Key offerings
SWOT

15.14 Morbern Inc.

Morbern Inc. - Overview
Morbern Inc. - Product / Service
Morbern Inc. - Key offerings
SWOT

15.15 Responsive Industries Ltd.

Responsive Industries Ltd. - Overview
Responsive Industries Ltd. - Product / Service
Responsive Industries Ltd. - Key offerings
SWOT

15.16 Spradling Holdings Inc.

Spradling Holdings Inc. - Overview
Spradling Holdings Inc. - Product / Service
Spradling Holdings Inc. - Key offerings
SWOT

15.17 Teijin Ltd.

Teijin Ltd. - Overview
Teijin Ltd. - Business segments
Teijin Ltd. - Key offerings
Teijin Ltd. - Segment focus
SWOT

15.18 Toray Industries Inc.

Toray Industries Inc. - Overview
Toray Industries Inc. - Business segments
Toray Industries Inc. - Key news
Toray Industries Inc. - Key offerings
Toray Industries Inc. - Segment focus
SWOT

16. Appendix

16.1 Scope of the report

Market definition
Objectives
Notes and caveats

16.2 Inclusions and exclusions checklist

Inclusions checklist
Exclusions checklist

16.3 Currency conversion rates for US$

16.4 Research methodology

16.5 Data procurement

Information sources

16.6 Data validation

16.7 Validation techniques employed for market sizing

16.8 Data synthesis

16.9 360 degree market analysis

16.10 List of abbreviations

Research Methodology

Technavio presents a detailed picture of the market by way of study, synthesis, and summation of data from multiple sources. The analysts have presented the various facets of the market with a particular focus on identifying the key industry influencers. The data thus presented is comprehensive, reliable, and the result of extensive research, both primary and secondary.

INFORMATION SOURCES

Primary sources

  • Manufacturers and suppliers
  • Channel partners
  • Industry experts
  • Strategic decision makers

Secondary sources

  • Industry journals and periodicals
  • Government data
  • Financial reports of key industry players
  • Historical data
  • Press releases

DATA ANALYSIS

Data Synthesis

  • Collation of data
  • Estimation of key figures
  • Analysis of derived insights

Data Validation

  • Triangulation with data models
  • Reference against proprietary databases
  • Corroboration with industry experts

REPORT WRITING

Qualitative

  • Market drivers
  • Market challenges
  • Market trends
  • Five forces analysis

Quantitative

  • Market size and forecast
  • Market segmentation
  • Geographical insights
  • Competitive landscape

Interested in this report?

Get your sample now to see our research methodology and insights!

Download Now

Frequently Asked Questions

Synthetic Leather market growth will increase by USD 33072.9 million during 2026-2030.

The Synthetic Leather market is expected to grow at a CAGR of 10.3% during 2026-2030.

Synthetic Leather market is segmented by Product (PU-based, PVC-based, Bio-based) End-user (Footwear industry, Furnishing industry, Automotive industry, Bags industry, Others) Product type (Stain resistant, Breathable, Lightweight, Heat resistant, Others)

Achilles USA Inc., Asahi Kasei Corp., Canadian General Tower Ltd, Continental AG, Culp Inc., Enduratex, Filwel Co. Ltd., Gen Phoenix, Izit Leather, Kolon Industries Inc., KURARAY Co. Ltd., Kyowa Leather Cloth Co. Ltd., Mayur Uniquoters Ltd., Morbern Inc., Nassimi LLC, Responsive Industries Ltd., SiLeather, Spradling Holdings Inc., Teijin Ltd., Toray Industries Inc. are a few of the key vendors in the Synthetic Leather market.

APAC will register the highest growth rate of 56.8% among the other regions. Therefore, the Synthetic Leather market in APAC is expected to garner significant business opportunities for the vendors during the forecast period.

China, India, Japan, South Korea, Indonesia, Australia, US, Canada, Mexico, Germany, UK, France, Italy, Spain, The Netherlands, Brazil, Argentina, Chile, Saudi Arabia, UAE, Turkey, South Africa, Israel

  • Rising adoption in automotive interiors is the driving factor this market.

The Synthetic Leather market vendors should focus on grabbing business opportunities from the Product segment as it accounted for the largest market share in the base year.
RIA - Research AI Assistant
Ask RIA
