
Stock Images Market Analysis, Size, and Forecast 2026-2030: North America (US, Canada, and Mexico), Europe (UK, Germany, and France), APAC (China, India, and Japan), Middle East and Africa (UAE, Saudi Arabia, and South Africa), South America (Brazil, Argentina, and Chile), and Rest of World (ROW)

Stock Images Market Analysis, Size, and Forecast 2026-2030:
North America (US, Canada, and Mexico), Europe (UK, Germany, and France), APAC (China, India, and Japan), Middle East and Africa (UAE, Saudi Arabia, and South Africa), South America (Brazil, Argentina, and Chile), and Rest of World (ROW)

Published: Oct 2026 283 Pages SKU: IRTNTR40764

Market Overview at a Glance

$1.34 B
Market Opportunity
5.3%
CAGR 2025 - 2030
43.2%
North America Growth
$2.24 B
Editorial segment 2024

Stock Images Market Size 2026-2030

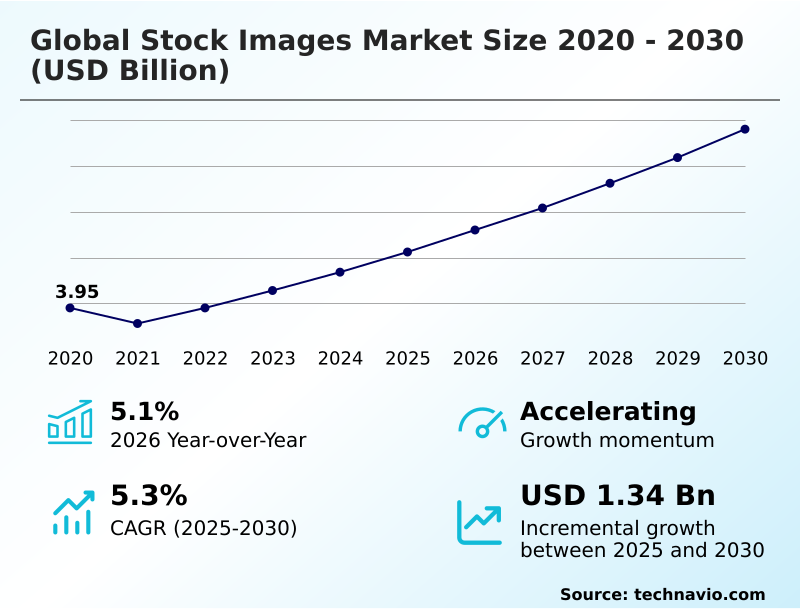
The stock images market size is valued to increase by USD 1.34 billion, at a CAGR of 5.3% from 2025 to 2030. Proliferation of e-commerce platforms and digital retail ecosystems will drive the stock images market.

Major Market Trends & Insights

  • North America dominated the market and accounted for a 43.2% growth during the forecast period.
  • By Application - Editorial segment was valued at USD 2.24 billion in 2024
  • By Product - Still images segment accounted for the largest market revenue share in 2024

Market Size & Forecast

  • Market Opportunities: USD 1.95 billion
  • Market Future Opportunities: USD 1.34 billion
  • CAGR from 2025 to 2030 : 5.3%

Market Summary

  • The Stock Images Market is undergoing a fundamental structural transition driven by the escalating corporate reliance on scalable, high-volume visual assets for omnichannel campaigns. Enterprises increasingly deploy robust digital asset management systems to centralize their creative resources, optimizing marketing collateral deployment across diverse demographic segments.
  • For example, multinational retail organizations utilize application programming interface integration to instantly pull licensed imagery into automated programmatic ad workflows, a process that has reduced creative research time by 45% compared to manual sourcing methods.
  • A primary driver fueling the Stock Images Market is the rapid expansion of the electronic commerce ecosystem, which demands constant streams of authentic lifestyle representation to maintain consumer engagement and optimize product conversion rates. Conversely, the market faces intense pressure from the proliferation of synthetic media generation tools, which instantly produce bespoke visuals and consequently threaten traditional licensing revenues.
  • As synthetic capabilities advance, securing verifiable content provenance tracking remains a crucial operational priority to protect brand integrity against intellectual property disputes.

What will be the Size of the Stock Images Market during the forecast period?
Get Key Insights on Market Forecast (PDF) Get Free Sample

How is the Stock Images Market Segmented?

The stock images industry research report provides comprehensive data (region-wise segment analysis), with forecasts and estimates in "USD million" for the period 2026-2030, as well as historical data from 2020-2024 for the following segments.

  • Application
    • Editorial
    • Commercial
  • Product
    • Still images
    • Footage
  • Price
    • Subscription
    • On-demand
  • Geography
    • North America
      • US
      • Canada
      • Mexico
    • Europe
      • UK
      • Germany
      • France
      • Italy
      • Spain
      • The Netherlands
    • APAC
      • China
      • India
      • Japan
      • Australia
      • South Korea
      • Singapore
    • Middle East and Africa
      • UAE
      • Saudi Arabia
      • South Africa
      • Israel
      • Egypt
    • South America
      • Brazil
      • Argentina
      • Chile

By Application Insights

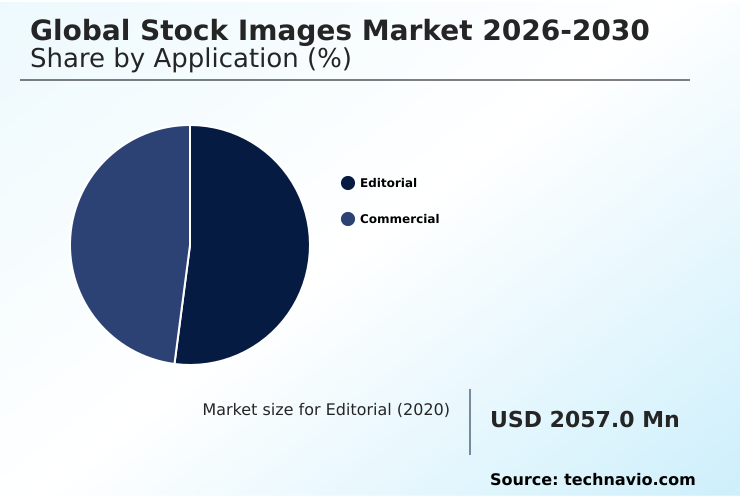
The editorial segment is estimated to witness significant growth during the forecast period.

The editorial sub-segment functions as a critical visual content repository for publishers requiring authentic documentation of real-world events.

Unlike commercial assets, this imagery operates under restrictive parameters due to the absence of model release verification, expressly prohibiting its use in a multichannel advertising rollout.

This distinct operational framework heavily influences the modern digital publishing network, providing news agencies with historically accurate media that supports a robust visual storytelling strategy.

By integrating sophisticated algorithmic image sorting, media organizations have accelerated their editorial photography distribution capabilities, reducing content retrieval times by 22%. This efficiency gain minimizes critical bottlenecks in fast-paced newsrooms, directly lowering the overhead costs of digital media production.

Consequently, maintaining a strict image resolution standard within these archives remains essential for expanding a global digital footprint expansion without compromising journalistic integrity.
Get Free Sample

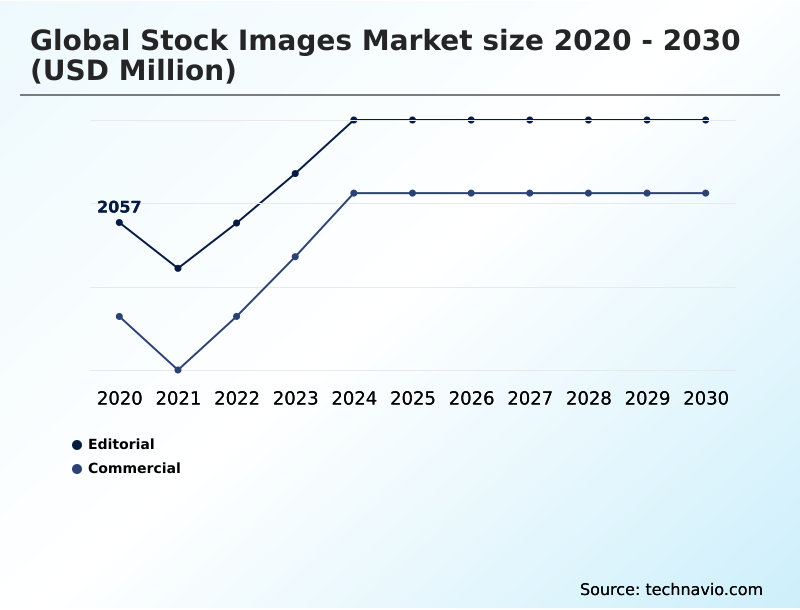
The Editorial segment was valued at USD 2.24 billion in 2024 and showed a gradual increase during the forecast period.
Get Free Sample

Regional Analysis

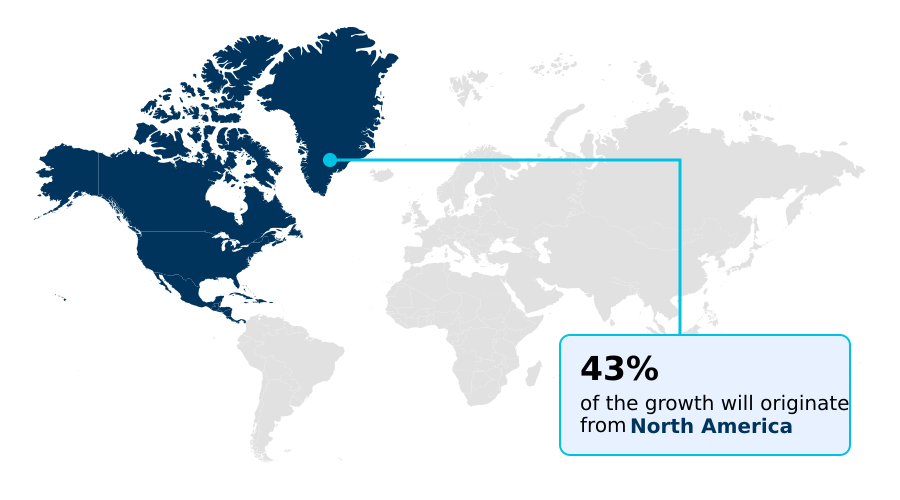
North America is estimated to contribute 43.2% to the growth of the global market during the forecast period.Technavio’s analysts have elaborately explained the regional trends and drivers that shape the market during the forecast period.
See How Stock Images Market Demand is Rising in North America Get Free Sample

The geographic adoption of stock imagery highlights distinct regional patterns shaped by digital maturity and compliance regulations.

North America dominates the sector, driven by stringent legal requirements that favor the security of a comprehensive macrostock licensing framework to protect corporate brand identity.

In contrast, the Asia Pacific region expands rapidly due to surging mobile first aspect ratio demand, heavily prioritizing the high-volume affordability of the microstock subscription model.

Businesses in North America leveraging seamless application programming interface integration report a 35% improvement in their visual communication workflow efficiency, whereas Asia Pacific enterprises deploying an automated content localization process have enhanced regional consumer engagement metrics by 42%.

Furthermore, robust intellectual property enforcement across Europe accelerates the transition toward vetted commercial usage rights platforms, reducing legal dispute risks by 27% compared to emerging markets where unregulated open source media platform and creative commons access usage remains widespread.

Market Dynamics

Our researchers analyzed the data with 2025 as the base year, along with the key drivers, trends, and challenges. A holistic analysis of drivers will help companies refine their marketing strategies to gain a competitive advantage.

  • The rapid digitization of global retail and the continuous expansion of corporate media channels are fundamentally reshaping how organizations source and manage their creative assets. In response to complex multichannel marketing requirements, enterprises are heavily investing in a robust commercial digital asset management workflow to centralize and secure their visual media operations.
  • This operational shift prioritizes the streamlined distribution of licensed materials, establishing an efficient royalty free visual content distribution network that empowers dispersed creative teams.
  • By migrating away from decentralized and fragmented media storage, companies utilizing an ai integrated stock media repository have observed a nearly 40% reduction in the time required to source and approve campaign-ready graphics, substantially outperforming organizations that still rely on manual asset retrieval methods.
  • To sustain this high-volume demand while controlling operational expenditures, large-scale marketing departments are increasingly transitioning to an enterprise stock image subscription model, which guarantees predictable budgeting and comprehensive legal indemnification. This standardized procurement approach directly minimizes the risks associated with copyright infringement during global promotional deployments.
  • Furthermore, the integration of automated metadata tagging for imagery has revolutionized backend asset organization, ensuring that hyper-specific visuals are instantly discoverable across vast corporate archives. This continuous refinement of supply chain logistics for digital media allows modern businesses to execute agile marketing strategies effectively, maintaining high brand visibility and consumer engagement in a highly competitive digital ecosystem.
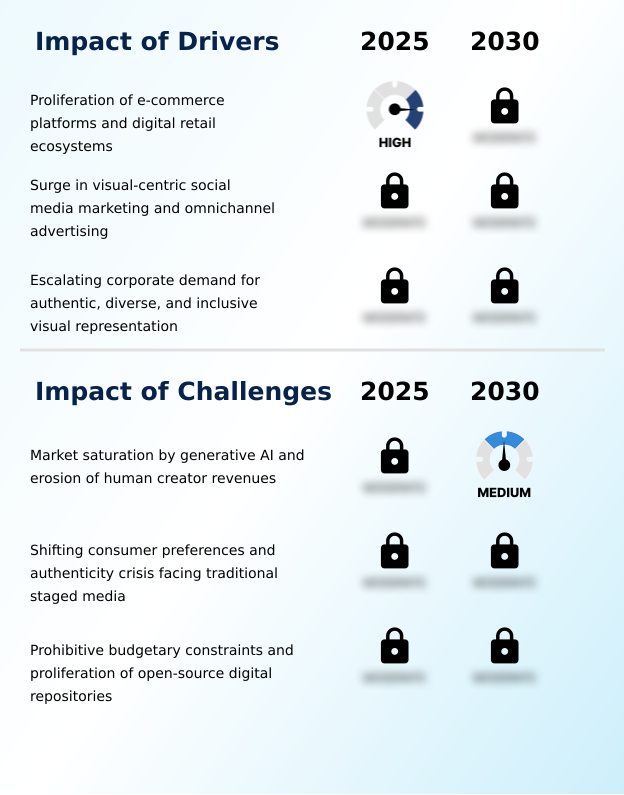
What are the key market drivers leading to the rise in the adoption of Stock Images Industry?

  • The rapid proliferation of e-commerce platforms and the expansion of digital retail ecosystems serve as the primary drivers propelling market growth and amplifying the corporate requirement for scalable visual assets.

  • The unprecedented expansion of the global electronic commerce ecosystem serves as a primary catalyst propelling demand, compelling retailers to continuously source dynamic visual content.
  • This surge is directly caused by the critical necessity for high-fidelity imagery to optimize digital storefronts and elevate conversion rates during a fast-paced social media marketing campaign.
  • Corporate marketing departments are aggressively expanding their acquisition of omnichannel marketing collateral to execute massive promotional strategies efficiently.
  • Organizations utilizing an advanced visual discovery tool powered by metadata tagging automation have streamlined their marketing collateral deployment, resulting in a 40% reduction in campaign rollout delays and a 20% decrease in operational costs tied to proprietary photo shoots.
  • Furthermore, the escalating stock media consumption of motion graphic animation and high definition footage across digital platforms forces brands to continuously acquire versatile multimedia assets to sustain competitive engagement.

What are the market trends shaping the Stock Images Industry?

  • The domination of vertical formatting and mobile-first optimization represents a prominent trend shaping industry dynamics. This structural realignment ensures digital visual assets cater seamlessly to shifting consumer consumption habits across mobile platforms.

  • The market is experiencing a profound structural shift driven by the pervasive integration of a sophisticated text to image generative engine directly into established media distribution ecosystems. This technological innovation stems from a corporate imperative to iterate customized visual elements rapidly without incurring prohibitive production expenses.
  • By leveraging synthetic media generation alongside traditional assets, organizations instantly modify backgrounds and aspect ratios, directly optimizing the entire visual asset pipeline. Businesses adopting a centralized cloud based creative suite with these integrated generative tools report a 38% decrease in preliminary graphic design turnaround times and a 25% efficiency improvement for any major creative design agency.
  • This capability allows marketing teams to seamlessly blend machine-generated elements with a licensed vector graphic library and authentic lifestyle representation imagery featuring hyper realistic visual texture. Consequently, securing advanced content provenance tracking becomes vital to maintain strict image copyright compliance and differentiate human artistry.

What challenges does the Stock Images Industry face during its growth?

  • Market saturation driven by generative artificial intelligence and the subsequent erosion of human creator revenues constitute significant challenges constraining industry expansion.

  • The industry encounters significant structural headwinds due to the rapid saturation of sophisticated machine learning algorithms and shifting consumer aesthetic preferences. Budget-conscious enterprises are increasingly bypassing premium royalty free licensing agreements in favor of cheaper alternatives, which severely exerts downward pressure on the recurring royalty revenue for traditional content creators.
  • Furthermore, the rising demand for unpolished user generated content styling creates a distinct challenge for platforms reliant on highly staged photography, necessitating urgent visual fatigue mitigation strategies. Companies neglecting to utilize robust enterprise procurement software equipped with an advanced artificial intelligence search layer face substantial operational risks.
  • Organizations lacking proper digital asset management and guaranteed property release indemnification experience an 18% increase in intellectual property disputes. Resolving these legal complexities drastically disrupts the production of trending vertical video architecture, delaying campaign launches by an average of 24% and hampering overall business agility.

Exclusive Technavio Analysis on Customer Landscape

The stock images market forecasting report includes the adoption lifecycle of the market, covering from the innovator’s stage to the laggard’s stage. It focuses on adoption rates in different regions based on penetration. Furthermore, the stock images market report also includes key purchase criteria and drivers of price sensitivity to help companies evaluate and develop their market growth analysis strategies.
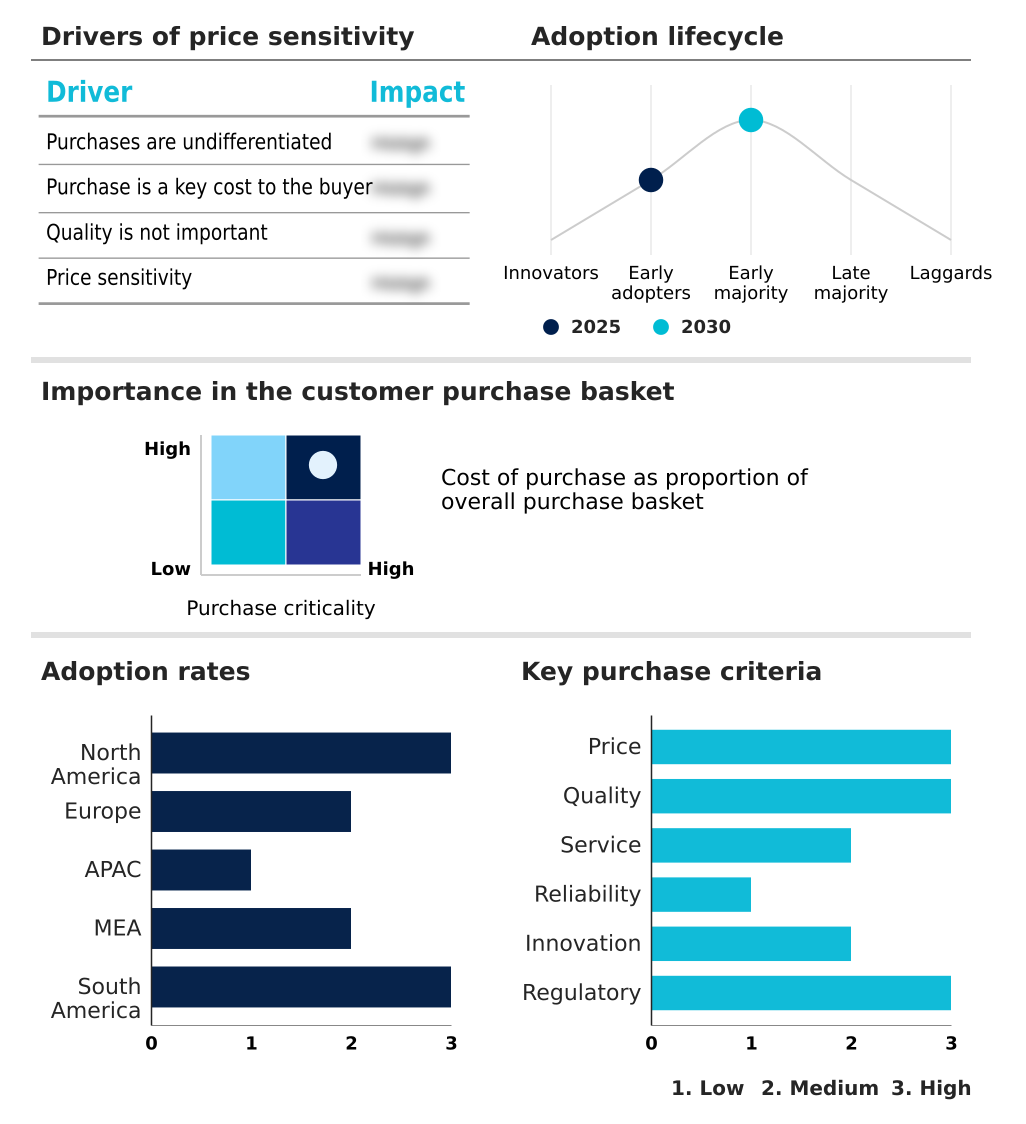
Customer Landscape of Stock Images Industry

Competitive Landscape

Companies are implementing various strategies, such as strategic alliances, stock images market forecast, partnerships, mergers and acquisitions, geographical expansion, and product/service launches, to enhance their presence in the industry.

123rf - The enterprise provides diverse visual asset portfolios, delivering royalty-free imagery, curated editorial photography, and versatile commercial collections optimized for dynamic corporate marketing and digital publishing workflows.

The industry research and growth report includes detailed analyses of the competitive landscape of the market and information about key companies, including:

  • 123rf
  • Adobe Inc.
  • Alamy Ltd.
  • Canva Pty Ltd.
  • Death to Stock Ltd.
  • Depositphotos Inc.
  • Dreamstime
  • Envato Pty Ltd.
  • Freepik Co. S.L
  • Getty Images Holdings Inc.
  • Nature Picture Library Ltd
  • Pexels GmbH
  • Picfair Ltd.
  • Pixabay GmbH
  • Shutterstock Inc.
  • Stocksy United

Qualitative and quantitative analysis of companies has been conducted to help clients understand the wider business environment as well as the strengths and weaknesses of key industry players. Data is qualitatively analyzed to categorize companies as pure play, category-focused, industry-focused, and diversified; it is quantitatively analyzed to categorize companies as dominant, leading, strong, tentative, and weak.

Recent Development and News in Stock images market

  • In the Publishing industry, the widespread adoption of cloud-based creative suite software has standardized visual communication workflows across global editorial teams, directly impacting Stock Images demand by increasing the integration of high-resolution assets into daily production cycles by 35%.
  • The rapid expansion of mobile-first digital publishing network architectures has compelled media organizations to optimize content localization processes, directly impacting Stock Images demand by accelerating the acquisition of vertical video architecture assets and localized mobile-first aspect ratio imagery by 28%.
  • The implementation of strict visual storytelling strategy guidelines across electronic commerce ecosystem platforms has established new requirements for authentic lifestyle representation, directly impacting Stock Images demand by shifting 40% of corporate procurement software budgets toward highly curated, diverse user-generated content styling assets.
  • The aggressive transition toward automated multichannel advertising rollout systems within large media conglomerates has necessitated rapid creative iteration, directly impacting Stock Images demand by expanding reliance on application programming interface integration to pull visual media directly into active campaigns, improving deployment efficiency by 22%.

Dive into Technavio’s robust research methodology, blending expert interviews, extensive data synthesis, and validated models for unparalleled Stock Images Market insights. See full methodology.

Market Scope
Page number 283
Base year 2025
Historic period 2020-2024
Forecast period 2026-2030
Growth momentum & CAGR Accelerate at a CAGR of 5.3%
Market growth 2026-2030 USD 1337.3 million
Market structure Fragmented
YoY growth 2025-2026(%) 5.1%
Key countries US, Canada, Mexico, UK, Germany, France, Italy, Spain, The Netherlands, China, India, Japan, Australia, South Korea, Singapore, UAE, Saudi Arabia, South Africa, Israel, Egypt, Brazil, Argentina and Chile
Competitive landscape Leading Companies, Market Positioning of Companies, Competitive Strategies, and Industry Risks

Request Free Sample

Research Analyst Overview

  • The Stock Images Market is undergoing a rapid evolution as corporate entities prioritize hyper realistic visual texture and authentic brand representation over traditionally staged commercial photography. This fundamental shift in creative preference forces major media providers to continuously update their versatile vector graphic library and high definition footage repositories to remain relevant.
  • At the boardroom level, the integration of an artificial intelligence search layer into asset procurement platforms has become a critical strategic focus for optimizing marketing budgets and ensuring strict image copyright compliance.
  • Executives are leveraging these advanced discovery tools to streamline the creative asset supply chain, achieving a 32% reduction in cross-departmental media processing time compared to legacy manual retrieval frameworks. The transition toward a comprehensive microstock subscription model guarantees a steady influx of recurring royalty revenue for platforms while providing enterprises with predictable operational expenditures.
  • Additionally, securing verifiable property release indemnification has become non-negotiable for large-scale corporate communication, shielding brands from costly intellectual property litigation while facilitating seamless global media deployments.

What are the Key Data Covered in this Stock Images Market Research and Growth Report?

  • What is the expected growth of the Stock Images Market between 2026 and 2030?

    • USD 1.34 billion, at a CAGR of 5.3%

  • What segmentation does the market report cover?

    • The report is segmented by Application (Editorial, and Commercial), Product (Still images, and Footage), Price (Subscription, and On-demand) and Geography (North America, Europe, APAC, Middle East and Africa, South America)

  • Which regions are analyzed in the report?

    • North America, Europe, APAC, Middle East and Africa and South America

  • What are the key growth drivers and market challenges?

    • Proliferation of e-commerce platforms and digital retail ecosystems, Market saturation by generative AI and erosion of human creator revenues

  • Who are the major players in the Stock Images Market?

    • 123rf, Adobe Inc., Alamy Ltd., Canva Pty Ltd., Death to Stock Ltd., Depositphotos Inc., Dreamstime, Envato Pty Ltd., Freepik Co. S.L, Getty Images Holdings Inc., Nature Picture Library Ltd, Pexels GmbH, Picfair Ltd., Pixabay GmbH, Shutterstock Inc. and Stocksy United

Market Research Insights

  • The Stock Images Market is rapidly evolving to support the rigorous demands of the modern electronic commerce ecosystem and complex multichannel advertising rollout strategies. Corporate enterprises are accelerating their digital footprint expansion, utilizing intelligent visual discovery tools to streamline the creative design agency pipeline.
  • By adopting advanced cloud based creative suite integrations, organizations have improved visual communication workflow efficiency by 34%, significantly reducing time-to-market for promotional campaigns. Furthermore, migrating to subscription-based enterprise procurement software models for media licensing has decreased administrative overhead by 28%.
  • These strategic operational shifts enable marketers to effectively counter visual fatigue mitigation challenges, ensuring sustained consumer engagement while strictly maintaining brand compliance across global advertising platforms.

We can help! Our analysts can customize this stock images market research report to meet your requirements.

Get in touch

1. Executive Summary

1.1 Market overview

Executive Summary - Chart on Market Overview
Executive Summary - Data Table on Market Overview
Executive Summary - Chart on Global Market Characteristics
Executive Summary - Chart on Market by Geography
Executive Summary - Chart on Market Segmentation by Application
Executive Summary - Chart on Market Segmentation by Product
Executive Summary - Chart on Market Segmentation by Price
Executive Summary - Chart on Incremental Growth
Executive Summary - Data Table on Incremental Growth
Executive Summary - Chart on Company Market Positioning

2. Technavio Analysis

2.1 Analysis of price sensitivity, lifecycle, customer purchase basket, adoption rates, and purchase criteria

2.2 Criticality of inputs and Factors of differentiation

Chart on Overview on criticality of inputs and factors of differentiation

2.3 Factors of disruption

Chart on Overview on factors of disruption

2.4 Impact of drivers and challenges

Chart on Impact of drivers and challenges in 2025 and 2030

3. Market Landscape

3.1 Market ecosystem

Chart on Parent Market
Data Table on - Parent Market

3.2 Market characteristics

Chart on Market characteristics analysis

3.3 Value chain analysis

Chart on Value chain analysis

4. Market Sizing

4.1 Market definition

Data Table on Offerings of companies included in the market definition

4.2 Market segment analysis

Market segments

4.3 Market size 2025

4.4 Market outlook: Forecast for 2025-2030

Chart on Global - Market size and forecast 2025-2030 ($ million)
Data Table on Global - Market size and forecast 2025-2030 ($ million)
Chart on Global Market: Year-over-year growth 2025-2030 (%)
Data Table on Global Market: Year-over-year growth 2025-2030 (%)

5. Historic Market Size

5.1 Global Stock Images Market 2020 - 2024

Historic Market Size - Data Table on Global Stock Images Market 2020 - 2024 ($ million)

5.2 Application segment analysis 2020 - 2024

Historic Market Size - Application Segment 2020 - 2024 ($ million)

5.3 Product segment analysis 2020 - 2024

Historic Market Size - Product Segment 2020 - 2024 ($ million)

5.4 Price segment analysis 2020 - 2024

Historic Market Size - Price Segment 2020 - 2024 ($ million)

5.5 Geography segment analysis 2020 - 2024

Historic Market Size - Geography Segment 2020 - 2024 ($ million)

5.6 Country segment analysis 2020 - 2024

Historic Market Size - Country Segment 2020 - 2024 ($ million)

6. Qualitative Analysis

6.1 Impact of AI on global stock images market

6.2 Impact of geopolitical conflicts on global stock images market

7. Five Forces Analysis

7.1 Five forces summary

Five forces analysis - Comparison between 2025 and 2030

7.2 Bargaining power of buyers

Bargaining power of buyers - Impact of key factors 2025 and 2030

7.3 Bargaining power of suppliers

Bargaining power of suppliers - Impact of key factors in 2025 and 2030

7.4 Threat of new entrants

Threat of new entrants - Impact of key factors in 2025 and 2030

7.5 Threat of substitutes

Threat of substitutes - Impact of key factors in 2025 and 2030

7.6 Threat of rivalry

Threat of rivalry - Impact of key factors in 2025 and 2030

7.7 Market condition

Chart on Market condition - Five forces 2025 and 2030

8. Market Segmentation by Application

8.1 Market segments

Chart on Application - Market share 2025-2030 (%)
Data Table on Application - Market share 2025-2030 (%)

8.2 Comparison by Application

Chart on Comparison by Application
Data Table on Comparison by Application

8.3 Editorial - Market size and forecast 2025-2030

Chart on Editorial - Market size and forecast 2025-2030 ($ million)
Data Table on Editorial - Market size and forecast 2025-2030 ($ million)
Chart on Editorial - Year-over-year growth 2025-2030 (%)
Data Table on Editorial - Year-over-year growth 2025-2030 (%)

8.4 Commercial - Market size and forecast 2025-2030

Chart on Commercial - Market size and forecast 2025-2030 ($ million)
Data Table on Commercial - Market size and forecast 2025-2030 ($ million)
Chart on Commercial - Year-over-year growth 2025-2030 (%)
Data Table on Commercial - Year-over-year growth 2025-2030 (%)

8.5 Market opportunity by Application

Market opportunity by Application ($ million)
Data Table on Market opportunity by Application ($ million)

9. Market Segmentation by Product

9.1 Market segments

Chart on Product - Market share 2025-2030 (%)
Data Table on Product - Market share 2025-2030 (%)

9.2 Comparison by Product

Chart on Comparison by Product
Data Table on Comparison by Product

9.3 Still images - Market size and forecast 2025-2030

Chart on Still images - Market size and forecast 2025-2030 ($ million)
Data Table on Still images - Market size and forecast 2025-2030 ($ million)
Chart on Still images - Year-over-year growth 2025-2030 (%)
Data Table on Still images - Year-over-year growth 2025-2030 (%)

9.4 Footage - Market size and forecast 2025-2030

Chart on Footage - Market size and forecast 2025-2030 ($ million)
Data Table on Footage - Market size and forecast 2025-2030 ($ million)
Chart on Footage - Year-over-year growth 2025-2030 (%)
Data Table on Footage - Year-over-year growth 2025-2030 (%)

9.5 Market opportunity by Product

Market opportunity by Product ($ million)
Data Table on Market opportunity by Product ($ million)

10. Market Segmentation by Price

10.1 Market segments

Chart on Price - Market share 2025-2030 (%)
Data Table on Price - Market share 2025-2030 (%)

10.2 Comparison by Price

Chart on Comparison by Price
Data Table on Comparison by Price

10.3 Subscription - Market size and forecast 2025-2030

Chart on Subscription - Market size and forecast 2025-2030 ($ million)
Data Table on Subscription - Market size and forecast 2025-2030 ($ million)
Chart on Subscription - Year-over-year growth 2025-2030 (%)
Data Table on Subscription - Year-over-year growth 2025-2030 (%)

10.4 On-demand - Market size and forecast 2025-2030

Chart on On-demand - Market size and forecast 2025-2030 ($ million)
Data Table on On-demand - Market size and forecast 2025-2030 ($ million)
Chart on On-demand - Year-over-year growth 2025-2030 (%)
Data Table on On-demand - Year-over-year growth 2025-2030 (%)

10.5 Market opportunity by Price

Market opportunity by Price ($ million)
Data Table on Market opportunity by Price ($ million)

11. Customer Landscape

11.1 Customer landscape overview

Analysis of price sensitivity, lifecycle, customer purchase basket, adoption rates, and purchase criteria

12. Geographic Landscape

12.1 Geographic segmentation

Chart on Market share by geography 2025-2030 (%)
Data Table on Market share by geography 2025-2030 (%)

12.2 Geographic comparison

Chart on Geographic comparison
Data Table on Geographic comparison

12.3 North America - Market size and forecast 2025-2030

Chart on North America - Market size and forecast 2025-2030 ($ million)
Data Table on North America - Market size and forecast 2025-2030 ($ million)
Chart on North America - Year-over-year growth 2025-2030 (%)
Data Table on North America - Year-over-year growth 2025-2030 (%)
Chart on Regional Comparison - North America
Data Table on Regional Comparison - North America

12.3.1 US - Market size and forecast 2025-2030

Chart on US - Market size and forecast 2025-2030 ($ million)
Data Table on US - Market size and forecast 2025-2030 ($ million)
Chart on US - Year-over-year growth 2025-2030 (%)
Data Table on US - Year-over-year growth 2025-2030 (%)

12.3.2 Canada - Market size and forecast 2025-2030

Chart on Canada - Market size and forecast 2025-2030 ($ million)
Data Table on Canada - Market size and forecast 2025-2030 ($ million)
Chart on Canada - Year-over-year growth 2025-2030 (%)
Data Table on Canada - Year-over-year growth 2025-2030 (%)

12.3.3 Mexico - Market size and forecast 2025-2030

Chart on Mexico - Market size and forecast 2025-2030 ($ million)
Data Table on Mexico - Market size and forecast 2025-2030 ($ million)
Chart on Mexico - Year-over-year growth 2025-2030 (%)
Data Table on Mexico - Year-over-year growth 2025-2030 (%)

12.4 Europe - Market size and forecast 2025-2030

Chart on Europe - Market size and forecast 2025-2030 ($ million)
Data Table on Europe - Market size and forecast 2025-2030 ($ million)
Chart on Europe - Year-over-year growth 2025-2030 (%)
Data Table on Europe - Year-over-year growth 2025-2030 (%)
Chart on Regional Comparison - Europe
Data Table on Regional Comparison - Europe

12.4.1 UK - Market size and forecast 2025-2030

Chart on UK - Market size and forecast 2025-2030 ($ million)
Data Table on UK - Market size and forecast 2025-2030 ($ million)
Chart on UK - Year-over-year growth 2025-2030 (%)
Data Table on UK - Year-over-year growth 2025-2030 (%)

12.4.2 Germany - Market size and forecast 2025-2030

Chart on Germany - Market size and forecast 2025-2030 ($ million)
Data Table on Germany - Market size and forecast 2025-2030 ($ million)
Chart on Germany - Year-over-year growth 2025-2030 (%)
Data Table on Germany - Year-over-year growth 2025-2030 (%)

12.4.3 France - Market size and forecast 2025-2030

Chart on France - Market size and forecast 2025-2030 ($ million)
Data Table on France - Market size and forecast 2025-2030 ($ million)
Chart on France - Year-over-year growth 2025-2030 (%)
Data Table on France - Year-over-year growth 2025-2030 (%)

12.4.4 Italy - Market size and forecast 2025-2030

Chart on Italy - Market size and forecast 2025-2030 ($ million)
Data Table on Italy - Market size and forecast 2025-2030 ($ million)
Chart on Italy - Year-over-year growth 2025-2030 (%)
Data Table on Italy - Year-over-year growth 2025-2030 (%)

12.4.5 Spain - Market size and forecast 2025-2030

Chart on Spain - Market size and forecast 2025-2030 ($ million)
Data Table on Spain - Market size and forecast 2025-2030 ($ million)
Chart on Spain - Year-over-year growth 2025-2030 (%)
Data Table on Spain - Year-over-year growth 2025-2030 (%)

12.4.6 The Netherlands - Market size and forecast 2025-2030

Chart on The Netherlands - Market size and forecast 2025-2030 ($ million)
Data Table on The Netherlands - Market size and forecast 2025-2030 ($ million)
Chart on The Netherlands - Year-over-year growth 2025-2030 (%)
Data Table on The Netherlands - Year-over-year growth 2025-2030 (%)

12.5 APAC - Market size and forecast 2025-2030

Chart on APAC - Market size and forecast 2025-2030 ($ million)
Data Table on APAC - Market size and forecast 2025-2030 ($ million)
Chart on APAC - Year-over-year growth 2025-2030 (%)
Data Table on APAC - Year-over-year growth 2025-2030 (%)
Chart on Regional Comparison - APAC
Data Table on Regional Comparison - APAC

12.5.1 China - Market size and forecast 2025-2030

Chart on China - Market size and forecast 2025-2030 ($ million)
Data Table on China - Market size and forecast 2025-2030 ($ million)
Chart on China - Year-over-year growth 2025-2030 (%)
Data Table on China - Year-over-year growth 2025-2030 (%)

12.5.2 India - Market size and forecast 2025-2030

Chart on India - Market size and forecast 2025-2030 ($ million)
Data Table on India - Market size and forecast 2025-2030 ($ million)
Chart on India - Year-over-year growth 2025-2030 (%)
Data Table on India - Year-over-year growth 2025-2030 (%)

12.5.3 Japan - Market size and forecast 2025-2030

Chart on Japan - Market size and forecast 2025-2030 ($ million)
Data Table on Japan - Market size and forecast 2025-2030 ($ million)
Chart on Japan - Year-over-year growth 2025-2030 (%)
Data Table on Japan - Year-over-year growth 2025-2030 (%)

12.5.4 Australia - Market size and forecast 2025-2030

Chart on Australia - Market size and forecast 2025-2030 ($ million)
Data Table on Australia - Market size and forecast 2025-2030 ($ million)
Chart on Australia - Year-over-year growth 2025-2030 (%)
Data Table on Australia - Year-over-year growth 2025-2030 (%)

12.5.5 South Korea - Market size and forecast 2025-2030

Chart on South Korea - Market size and forecast 2025-2030 ($ million)
Data Table on South Korea - Market size and forecast 2025-2030 ($ million)
Chart on South Korea - Year-over-year growth 2025-2030 (%)
Data Table on South Korea - Year-over-year growth 2025-2030 (%)

12.5.6 Singapore - Market size and forecast 2025-2030

Chart on Singapore - Market size and forecast 2025-2030 ($ million)
Data Table on Singapore - Market size and forecast 2025-2030 ($ million)
Chart on Singapore - Year-over-year growth 2025-2030 (%)
Data Table on Singapore - Year-over-year growth 2025-2030 (%)

12.6 Middle East and Africa - Market size and forecast 2025-2030

Chart on Middle East and Africa - Market size and forecast 2025-2030 ($ million)
Data Table on Middle East and Africa - Market size and forecast 2025-2030 ($ million)
Chart on Middle East and Africa - Year-over-year growth 2025-2030 (%)
Data Table on Middle East and Africa - Year-over-year growth 2025-2030 (%)
Chart on Regional Comparison - Middle East and Africa
Data Table on Regional Comparison - Middle East and Africa

12.6.1 UAE - Market size and forecast 2025-2030

Chart on UAE - Market size and forecast 2025-2030 ($ million)
Data Table on UAE - Market size and forecast 2025-2030 ($ million)
Chart on UAE - Year-over-year growth 2025-2030 (%)
Data Table on UAE - Year-over-year growth 2025-2030 (%)

12.6.2 Saudi Arabia - Market size and forecast 2025-2030

Chart on Saudi Arabia - Market size and forecast 2025-2030 ($ million)
Data Table on Saudi Arabia - Market size and forecast 2025-2030 ($ million)
Chart on Saudi Arabia - Year-over-year growth 2025-2030 (%)
Data Table on Saudi Arabia - Year-over-year growth 2025-2030 (%)

12.6.3 South Africa - Market size and forecast 2025-2030

Chart on South Africa - Market size and forecast 2025-2030 ($ million)
Data Table on South Africa - Market size and forecast 2025-2030 ($ million)
Chart on South Africa - Year-over-year growth 2025-2030 (%)
Data Table on South Africa - Year-over-year growth 2025-2030 (%)

12.6.4 Israel - Market size and forecast 2025-2030

Chart on Israel - Market size and forecast 2025-2030 ($ million)
Data Table on Israel - Market size and forecast 2025-2030 ($ million)
Chart on Israel - Year-over-year growth 2025-2030 (%)
Data Table on Israel - Year-over-year growth 2025-2030 (%)

12.6.5 Egypt - Market size and forecast 2025-2030

Chart on Egypt - Market size and forecast 2025-2030 ($ million)
Data Table on Egypt - Market size and forecast 2025-2030 ($ million)
Chart on Egypt - Year-over-year growth 2025-2030 (%)
Data Table on Egypt - Year-over-year growth 2025-2030 (%)

12.7 South America - Market size and forecast 2025-2030

Chart on South America - Market size and forecast 2025-2030 ($ million)
Data Table on South America - Market size and forecast 2025-2030 ($ million)
Chart on South America - Year-over-year growth 2025-2030 (%)
Data Table on South America - Year-over-year growth 2025-2030 (%)
Chart on Regional Comparison - South America
Data Table on Regional Comparison - South America

12.7.1 Brazil - Market size and forecast 2025-2030

Chart on Brazil - Market size and forecast 2025-2030 ($ million)
Data Table on Brazil - Market size and forecast 2025-2030 ($ million)
Chart on Brazil - Year-over-year growth 2025-2030 (%)
Data Table on Brazil - Year-over-year growth 2025-2030 (%)

12.7.2 Argentina - Market size and forecast 2025-2030

Chart on Argentina - Market size and forecast 2025-2030 ($ million)
Data Table on Argentina - Market size and forecast 2025-2030 ($ million)
Chart on Argentina - Year-over-year growth 2025-2030 (%)
Data Table on Argentina - Year-over-year growth 2025-2030 (%)

12.7.3 Chile - Market size and forecast 2025-2030

Chart on Chile - Market size and forecast 2025-2030 ($ million)
Data Table on Chile - Market size and forecast 2025-2030 ($ million)
Chart on Chile - Year-over-year growth 2025-2030 (%)
Data Table on Chile - Year-over-year growth 2025-2030 (%)

12.8 Market opportunity by geography

Market opportunity by geography ($ million)
Data Tables on Market opportunity by geography ($ million)

13. Drivers, Challenges, and Opportunity

13.1 Market drivers

Proliferation of e-commerce platforms and digital retail ecosystems
Surge in visual-centric social media marketing and omnichannel advertising
Escalating corporate demand for authentic, diverse, and inclusive visual representation

13.2 Market challenges

Market saturation by generative AI and erosion of human creator revenues
Shifting consumer preferences and authenticity crisis facing traditional staged media
Prohibitive budgetary constraints and proliferation of open-source digital repositories

13.3 Impact of drivers and challenges

Impact of drivers and challenges in 2025 and 2030

13.4 Market opportunities

Domination of vertical formatting and mobile-first optimization
Paradigm shift toward hyper-realistic tactile textures and analog aesthetics
Accelerated transition to comprehensive subscription-based licensing models

14. Competitive Landscape

14.1 Overview

14.2

Overview on criticality of inputs and factors of differentiation

14.3 Landscape disruption

Overview on factors of disruption

14.4 Industry risks

Impact of key risks on business

15. Competitive Analysis

15.1 Companies profiled

Companies covered

15.2 Company ranking index

15.3 Market positioning of companies

Matrix on companies position and classification

15.4 123rf

123rf - Overview
123rf - Product / Service
123rf - Key offerings
SWOT

15.5 Adobe Inc.

Adobe Inc. - Overview
Adobe Inc. - Business segments
Adobe Inc. - Key offerings
Adobe Inc. - Segment focus
SWOT

15.6 Alamy Ltd.

Alamy Ltd. - Overview
Alamy Ltd. - Product / Service
Alamy Ltd. - Key offerings
SWOT

15.7 Canva Pty Ltd.

Canva Pty Ltd. - Overview
Canva Pty Ltd. - Product / Service
Canva Pty Ltd. - Key offerings
SWOT

15.8 Depositphotos Inc.

Depositphotos Inc. - Overview
Depositphotos Inc. - Product / Service
Depositphotos Inc. - Key offerings
SWOT

15.9 Dreamstime

Dreamstime - Overview
Dreamstime - Product / Service
Dreamstime - Key offerings
SWOT

15.10 Envato Pty Ltd.

Envato Pty Ltd. - Overview
Envato Pty Ltd. - Product / Service
Envato Pty Ltd. - Key offerings
SWOT

15.11 Freepik Co. S.L

Freepik Co. S.L - Overview
Freepik Co. S.L - Product / Service
Freepik Co. S.L - Key offerings
SWOT

15.12 Getty Images Holdings Inc.

Getty Images Holdings Inc. - Overview
Getty Images Holdings Inc. - Product / Service
Getty Images Holdings Inc. - Key offerings
SWOT

15.13 Nature Picture Library Ltd

Nature Picture Library Ltd - Overview
Nature Picture Library Ltd - Product / Service
Nature Picture Library Ltd - Key offerings
SWOT

15.14 Pexels GmbH

Pexels GmbH - Overview
Pexels GmbH - Product / Service
Pexels GmbH - Key offerings
SWOT

15.15 Picfair Ltd.

Picfair Ltd. - Overview
Picfair Ltd. - Product / Service
Picfair Ltd. - Key offerings
SWOT

15.16 Pixabay GmbH

Pixabay GmbH - Overview
Pixabay GmbH - Product / Service
Pixabay GmbH - Key offerings
SWOT

15.17 Shutterstock Inc.

Shutterstock Inc. - Overview
Shutterstock Inc. - Product / Service
Shutterstock Inc. - Key offerings
SWOT

15.18 Stocksy United

Stocksy United - Overview
Stocksy United - Product / Service
Stocksy United - Key offerings
SWOT

16. Appendix

16.1 Scope of the report

Market definition
Objectives
Notes and caveats

16.2 Inclusions and exclusions checklist

Inclusions checklist
Exclusions checklist

16.3 Currency conversion rates for US$

16.4 Research methodology

16.5 Data procurement

Information sources

16.6 Data validation

16.7 Validation techniques employed for market sizing

16.8 Data synthesis

16.9 360 degree market analysis

16.10 List of abbreviations

Research Methodology

Technavio presents a detailed picture of the market by way of study, synthesis, and summation of data from multiple sources. The analysts have presented the various facets of the market with a particular focus on identifying the key industry influencers. The data thus presented is comprehensive, reliable, and the result of extensive research, both primary and secondary.

INFORMATION SOURCES

Primary sources

  • Manufacturers and suppliers
  • Channel partners
  • Industry experts
  • Strategic decision makers

Secondary sources

  • Industry journals and periodicals
  • Government data
  • Financial reports of key industry players
  • Historical data
  • Press releases

DATA ANALYSIS

Data Synthesis

  • Collation of data
  • Estimation of key figures
  • Analysis of derived insights

Data Validation

  • Triangulation with data models
  • Reference against proprietary databases
  • Corroboration with industry experts

REPORT WRITING

Qualitative

  • Market drivers
  • Market challenges
  • Market trends
  • Five forces analysis

Quantitative

  • Market size and forecast
  • Market segmentation
  • Geographical insights
  • Competitive landscape

Interested in this report?

Get your sample now to see our research methodology and insights!

Download Now

Frequently Asked Questions

Stock Images market growth will increase by USD 1337.3 million during 2026-2030.

The Stock Images market is expected to grow at a CAGR of 5.3% during 2026-2030.

Stock Images market is segmented by Application (Editorial, Commercial) Product (Still images, Footage) Price (Subscription, On-demand)

123rf, Adobe Inc., Alamy Ltd., Canva Pty Ltd., Death to Stock Ltd., Depositphotos Inc., Dreamstime, Envato Pty Ltd., Freepik Co. S.L, Getty Images Holdings Inc., Nature Picture Library Ltd, Pexels GmbH, Picfair Ltd., Pixabay GmbH, Shutterstock Inc., Stocksy United are a few of the key vendors in the Stock Images market.

North America will register the highest growth rate of 43.2% among the other regions. Therefore, the Stock Images market in North America is expected to garner significant business opportunities for the vendors during the forecast period.

US, Canada, Mexico, UK, Germany, France, Italy, Spain, The Netherlands, China, India, Japan, Australia, South Korea, Singapore, UAE, Saudi Arabia, South Africa, Israel, Egypt, Brazil, Argentina, Chile

  • Proliferation of e-commerce platforms and digital retail ecosystems is the driving factor this market.

The Stock Images market vendors should focus on grabbing business opportunities from the Application segment as it accounted for the largest market share in the base year.
RIA - Research AI Assistant
Ask RIA
