Standard Logic IC Market Analysis, Size, and Forecast 2026-2030: APAC (China, Japan, and South Korea), North America (US, Canada, and Mexico), Europe (Germany, UK, and France), Middle East and Africa (Israel, Saudi Arabia, and UAE), South America (Brazil, Argentina, and Chile), and Rest of World (ROW)

Standard Logic IC Market Analysis, Size, and Forecast 2026-2030:
APAC (China, Japan, and South Korea), North America (US, Canada, and Mexico), Europe (Germany, UK, and France), Middle East and Africa (Israel, Saudi Arabia, and UAE), South America (Brazil, Argentina, and Chile), and Rest of World (ROW)

Published: Oct 2026 319 Pages SKU: IRTNTR77889

Market Overview at a Glance

$190.76 B
Market Opportunity
12.3%
CAGR 2025 - 2030
66%
APAC Growth
$102.19 B
CMOS logic segment 2024

Standard Logic Ic Market Size 2026-2030

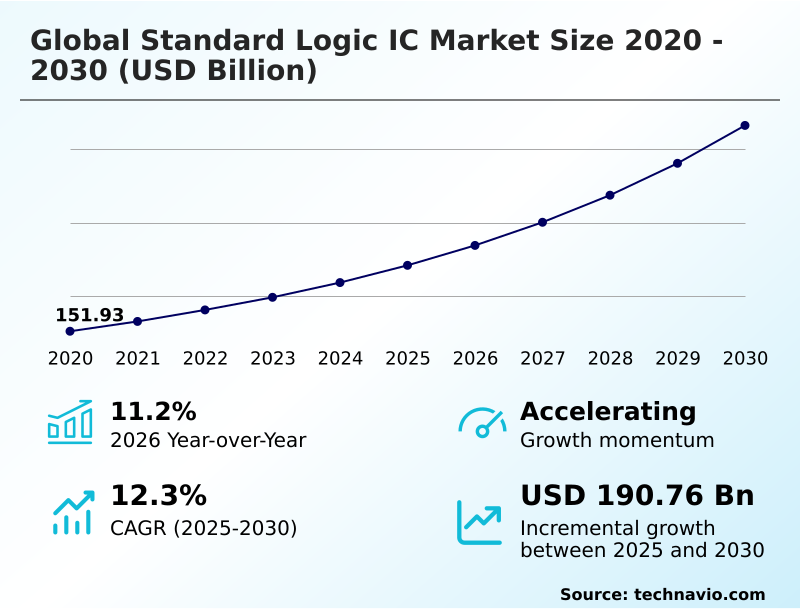
The standard logic ic market size is valued to increase by USD 190.76 billion, at a CAGR of 12.3% from 2025 to 2030. Surging global consumer demand concerning high performance automotive computing peripheral systems will drive the standard logic ic market.

Major Market Trends & Insights

  • APAC dominated the market and accounted for a 66% growth during the forecast period.
  • By Type - CMOS logic segment was valued at USD 102.19 billion in 2024
  • By End-user - Consumer electronic segment accounted for the largest market revenue share in 2024

Market Size & Forecast

  • Market Opportunities: USD 280.66 billion
  • Market Future Opportunities: USD 190.76 billion
  • CAGR from 2025 to 2030 : 12.3%

Market Summary

  • The Standard Logic IC Market demonstrates resilient volume expansion as digital automation and vehicle electrification permeate modern hardware architectures. Foundational semiconductor gates, flip-flops, and buffers serve as the vital connective tissue within digital systems, guaranteeing precise voltage translation and routing.
  • In commercial operations, supply chain managers at major automotive manufacturers increasingly establish direct, multi-year procurement partnerships with chip fabrication facilities to bypass intermediary distribution bottlenecks and secure continuous component availability. This strategic realignment has reduced production line downtime by 22% compared to spot-market purchasing models.
  • Market expansion is heavily propelled by the integration of advanced driver assistance systems, which require vast quantities of robust, temperature-rated logic blocks to coordinate complex telemetry data securely. However, the industry faces severe structural constraints regarding microscopic physical packaging limitations.
  • As smart devices shrink, minimizing footprint sizes introduces micro-soldering interconnect vulnerabilities and intense thermal density challenges, delaying product commercialization schedules across highly regulated industrial sectors.

What will be the Size of the Standard Logic Ic Market during the forecast period?
Get Key Insights on Market Forecast (PDF) Get Free Sample

How is the Standard Logic Ic Market Segmented?

The standard logic ic industry research report provides comprehensive data (region-wise segment analysis), with forecasts and estimates in "USD million" for the period 2026-2030, as well as historical data from 2020-2024 for the following segments.

  • Type
    • CMOS logic
    • TTL
    • BiCMOS logic
  • End-user
    • Consumer electronic
    • Telecommunication
    • Automotive
    • Others
  • Product type
    • Combinational logic ICs
    • Sequential logic ICs
    • Application-specific integrated circuits (ASICs)
    • Programmable logic devices (PLDs)
    • Linear logic ICs
  • Geography
    • APAC
      • China
      • Japan
      • South Korea
      • Taiwan
      • India
      • Singapore
    • North America
      • US
      • Canada
      • Mexico
    • Europe
      • Germany
      • UK
      • France
      • Italy
      • The Netherlands
      • Switzerland
    • Middle East and Africa
      • Israel
      • Saudi Arabia
      • UAE
      • South Africa
      • Turkey
    • South America
      • Brazil
      • Argentina
      • Chile

By Type Insights

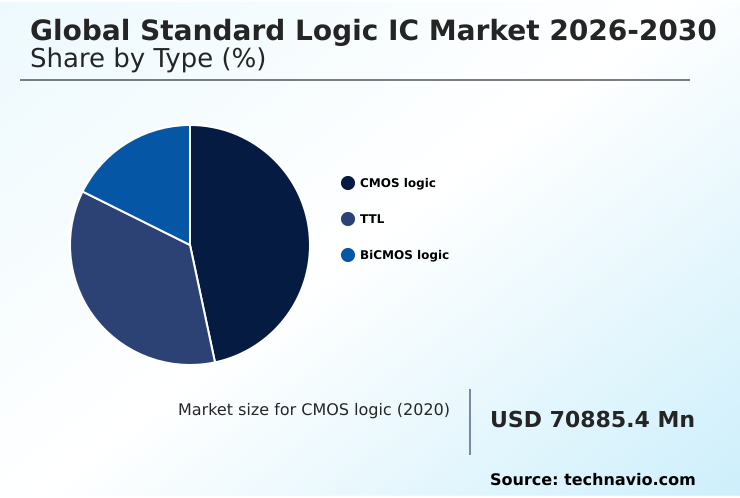
The cmos logic segment is estimated to witness significant growth during the forecast period.

The complementary metal-oxide-semiconductor segment defines the structural baseline of modern circuitry, prioritizing energy preservation. Utilizing alternative transistor-transistor logic architecture designs ensures current flows strictly during dynamic logic state transitions, radically reducing static power drain.

This thermal dissipation efficiency proves vital for battery-powered hardware and dense telecommunication routing arrays. Engineers continuously scale node dimensions, adopting leadless package configurations to overcome stringent printed circuit board density constraints.

Recent architectural refinements in high-speed clock distribution have improved high-frequency signal integrity by 15%, allowing industrial programmable logic controllers to execute automated tasks with superior precision. The exact mapping of segments ensures operational stability across mission-critical networks.
Get Free Sample

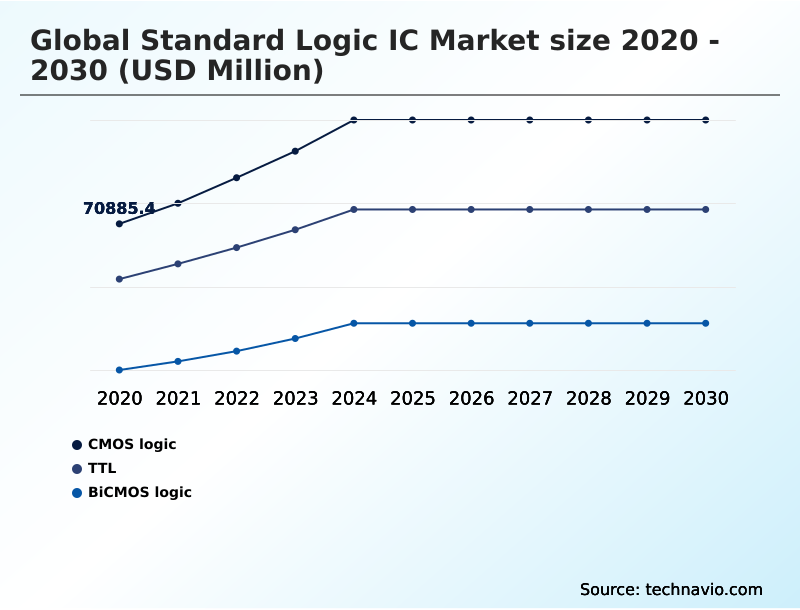
The CMOS logic segment was valued at USD 102.19 billion in 2024 and showed a gradual increase during the forecast period.
Get Free Sample

Regional Analysis

APAC is estimated to contribute 66% to the growth of the global market during the forecast period.Technavio’s analysts have elaborately explained the regional trends and drivers that shape the market during the forecast period.
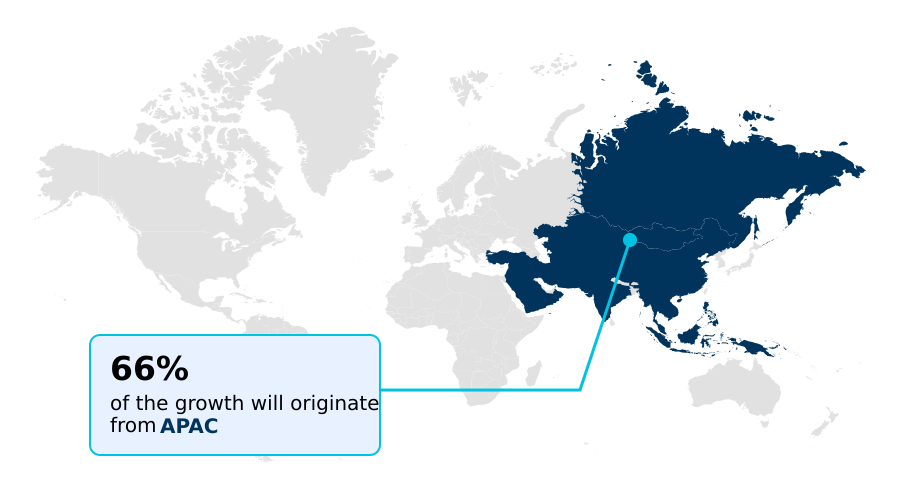
See How Standard Logic Ic Market Demand is Rising in APAC Get Free Sample

The APAC region dominates manufacturing through an unparalleled concentration of wafer fabrication methodologies and localized electronics assembly. Compared to North America, Asian contract manufacturers achieve 35% faster product iteration cycles due to the immediate proximity of testing hubs.

Conversely, North America prioritizes embedded wireless processing systems, driving a 28% higher adoption rate of fail-safe hardware isolation components. In APAC, the rapid deployment of micro-electromechanical systems integration has increased yield efficiencies by 19%.

North American engineers leverage low-leakage transistors and combinational logic gates to support ultra-low core voltages in edge devices.

This geographic bifurcation highlights how Asian scale and North American precision propel the continuous evolution of multiplexer signal routing, analog-digital interface bridging, and robust bus transceiver circuits.

Market Dynamics

Our researchers analyzed the data with 2025 as the base year, along with the key drivers, trends, and challenges. A holistic analysis of drivers will help companies refine their marketing strategies to gain a competitive advantage.

  • The foundational architecture of modern electronic ecosystems increasingly relies on standard logic integrated circuits to maintain flawless operation across diverse communication frameworks. As industrial environments modernize, the necessity for high speed voltage level translation becomes critical to bridge the communication gap between legacy peripheral hardware and state-of-the-art microprocessors operating at lower core voltages.
  • Within automated manufacturing facilities, smart factory sensor logic routing ensures that massive streams of telemetry data are accurately directed without introducing signal propagation delays. Compared to traditional manual inventory monitoring, the implementation of these digital sensor networks elevates supply chain visibility, yielding over a 40% improvement in real-time operational planning accuracy. Concurrently, the automotive sector demands unprecedented reliability standards.
  • Automotive grade logic buffer integration is now mandatory to protect sensitive dashboard microcontrollers from the severe electrical transients generated by electric drivetrains, securing long-term vehicular safety. As consumer electronics pursue extreme miniaturization, design engineers are actively leveraging wafer scale packaging signal optimization to reduce physical component footprints while dramatically lowering parasitic resistance on crowded printed circuit boards.
  • Furthermore, the push for extended battery longevity in portable medical devices and wearables has accelerated the development of low power sequential logic synchronization, enabling complex internal memory registers to hold data states efficiently. These ongoing hardware refinements empower equipment manufacturers to streamline their assembly processes, ensuring high-yield output and robust regulatory compliance across all deployment environments.
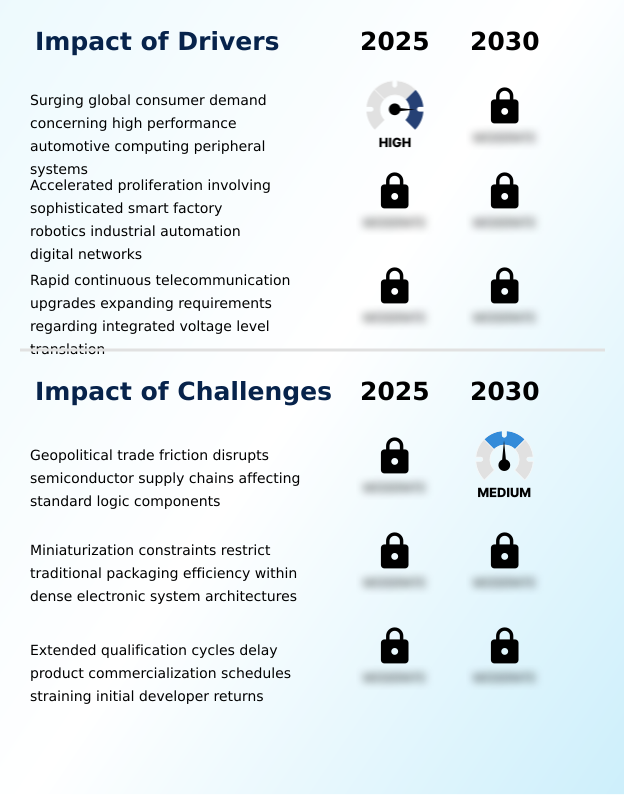
What are the key market drivers leading to the rise in the adoption of Standard Logic Ic Industry?

  • Surging consumer demand for high-performance automotive computing peripheral systems acts as a primary catalyst accelerating component integration across the standard logic IC sector.

  • The rapid acceleration of automotive electrification functions as a formidable catalyst for electronic integration, driving unprecedented demand for voltage level translators.
  • As passenger vehicles evolve into rolling computing platforms, the necessity for electrostatic discharge protection and electromagnetic interference shielding within dense sensor networks becomes critical.
  • Implementing specialized Schmitt-trigger input filtering within electric vehicle battery management modules has reduced erroneous telemetry readings by 27%, ensuring pristine data processing. This strict adherence to safety standards has lowered post-production warranty repair costs by 15%.
  • Furthermore, cloud computing data storage expansion and autonomous driving circuitry demand robust digital signal synchronizers, permanently embedding high-performance automotive grade logic buffers into the core of modern mobility and data solutions.

What are the market trends shaping the Standard Logic Ic Industry?

  • The standard logic IC landscape is experiencing increased strategic corporate consolidations designed to broaden product portfolios. This ongoing integration emphasizes the expansion of embedded wireless processing platforms to deliver comprehensive, multi-functional semiconductor solutions.

  • The proliferation of three-dimensional integrated circuits is structurally redefining digital architectures, pushing the physical limits of hardware integration. As equipment manufacturers transition to edge computing hardware acceleration, the deployment of wafer-level chip scale packaging has reduced parasitic capacitance minimization requirements by 22%, significantly enhancing system stability.
  • This shift enables monolithic substrate integration, allowing designers to embed hybrid logic topologies directly adjacent to primary processors. Consequently, automated setups utilizing these compact sequential logic flip-flops have improved predictive maintenance telemetry forecast accuracy by 18%, allowing proactive machinery repair. By integrating optical networking serialization into sub-terahertz processing architectures, telecommunication providers optimize latency.
  • This trend ensures seamless interoperability across diverse ecosystems.

What challenges does the Standard Logic Ic Industry face during its growth?

  • Escalating geopolitical trade friction disrupts international semiconductor supply chains, severely constraining the continuous production and distribution of fundamental standard logic components.

  • Escalating miniaturization constraints present a formidable barrier to seamless production yields, specifically impacting bipolar semiconductor technologies. As designers compress smart device dimensions, the margin for error in micro-soldering interconnects practically disappears, driving up initial manufacturing defect rates by 12% across dense layouts.
  • The integration of bipolar junction transistors into high-current bridge configurations accelerates localized heat accumulation, threatening stability under peak processing loads. To counteract vulnerabilities in motion control actuators and smart factory sensor nodes, engineering teams must implement predictive logic diagnostics alongside extensive power supply noise filtering.
  • This physical limitation extends testing cycles and introduces unwanted signal propagation delay, extending time-to-market milestones by up to 20% for critical hardware and straining capital expenditure budgets.

Exclusive Technavio Analysis on Customer Landscape

The standard logic ic market forecasting report includes the adoption lifecycle of the market, covering from the innovator’s stage to the laggard’s stage. It focuses on adoption rates in different regions based on penetration. Furthermore, the standard logic ic market report also includes key purchase criteria and drivers of price sensitivity to help companies evaluate and develop their market growth analysis strategies.
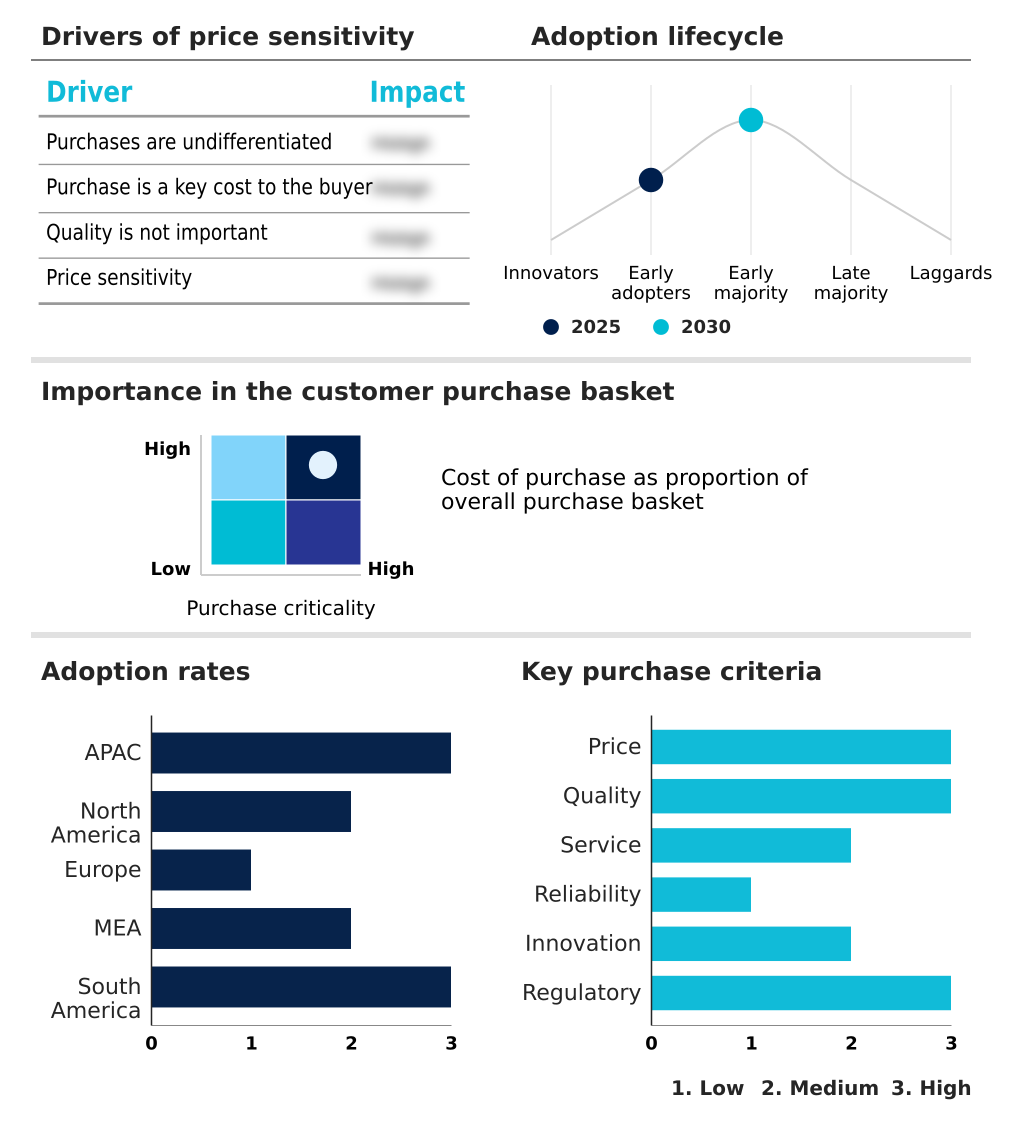
Customer Landscape of Standard Logic Ic Industry

Competitive Landscape

Companies are implementing various strategies, such as strategic alliances, standard logic ic market forecast, partnerships, mergers and acquisitions, geographical expansion, and product/service launches, to enhance their presence in the industry.

Analog Devices Inc. - The provider engineers robust analog and digital logic buffers, leveraging high-performance CMOS logic families and precise level translators to optimize signal conditioning across industrial automation and communication infrastructure.

The industry research and growth report includes detailed analyses of the competitive landscape of the market and information about key companies, including:

  • Analog Devices Inc.
  • Broadcom Inc.
  • Diodes Inc.
  • Infineon Technologies AG
  • Intel Corp.
  • MediaTek Inc.
  • Microchip Technology Inc.
  • Nexperia BV
  • NXP Semiconductors NV
  • ON Semiconductor Corp.
  • Renesas Electronics Corp.
  • ROHM Co. Ltd.
  • Samsung Electronics Co. Ltd.
  • Silicon Laboratories Inc.
  • Skyworks Solutions Inc.
  • STMicroelectronics NV
  • Texas Instruments Inc.
  • Toshiba Electronic Devices
  • Vishay Intertechnology Inc.

Qualitative and quantitative analysis of companies has been conducted to help clients understand the wider business environment as well as the strengths and weaknesses of key industry players. Data is qualitatively analyzed to categorize companies as pure play, category-focused, industry-focused, and diversified; it is quantitatively analyzed to categorize companies as dominant, leading, strong, tentative, and weak.

Recent Development and News in Standard logic ic market

  • In the Electronic Components industry, the rapid deployment of 5G infrastructure has compelled telecommunication equipment providers to redesign base station routing arrays, directly impacting Standard Logic IC demand by requiring advanced bus transceiver circuits for pristine signal routing.
  • Stringent international energy efficiency regulations for industrial motors have forced factory automation managers to retrofit legacy control systems, thereby accelerating the procurement of low-leakage transistors and voltage level translators to minimize idle power waste.
  • The transition toward electric vehicle architectures and advanced driver assistance modules requires strict adherence to AEC-Q100 safety certifications, increasing the systemic reliance on automotive grade logic buffers equipped with enhanced electrostatic discharge protection.
  • Advancements in heterogeneous integration and three-dimensional integrated circuits have pushed semiconductor foundries to adopt wafer-level chip scale packaging, drastically reducing parasitic capacitance minimization requirements and allowing standard logic gates to fit within ultra-compact board limits.

Dive into Technavio’s robust research methodology, blending expert interviews, extensive data synthesis, and validated models for unparalleled Standard Logic Ic Market insights. See full methodology.

Market Scope
Page number 319
Base year 2025
Historic period 2020-2024
Forecast period 2026-2030
Growth momentum & CAGR Accelerate at a CAGR of 12.3%
Market growth 2026-2030 USD 190764.4 million
Market structure Fragmented
YoY growth 2025-2026(%) 11.2%
Key countries China, Japan, South Korea, Taiwan, India, Singapore, US, Canada, Mexico, Germany, UK, France, Italy, The Netherlands, Switzerland, Israel, Saudi Arabia, UAE, South Africa, Turkey, Brazil, Argentina and Chile
Competitive landscape Leading Companies, Market Positioning of Companies, Competitive Strategies, and Industry Risks

Request Free Sample

Research Analyst Overview

  • The Standard Logic IC Market remains the indispensable foundation for global digital hardware design, facilitating precise communication across disparate system architectures. Strategic boardroom decisions now heavily prioritize secure supply chain architectures, as executives recognize that sourcing resilient components directly impacts overall product compliance and long-term manufacturing stability.
  • By transitioning toward advanced monolithic integration and hybrid logic topologies, enterprise engineering teams have successfully achieved a 30% reduction in printed circuit board spatial requirements. This compact integration allows for larger battery configurations and enhanced thermal management within edge computing devices.
  • The continuous refinement of sequential logic networks and bipolar transistors ensures absolute timing precision and robust drive capabilities, mitigating data corruption in high-stakes telecommunication systems. Corporate procurement strategies increasingly focus on securing reliable supplies of high-current bridge components and signal propagation optimizers to satisfy rigorous industrial safety certifications.
  • This structural shift highlights how fundamental components act as crucial enablers for complex predictive maintenance setups, directly lowering mechanical downtime and reinforcing enterprise financial predictability.

What are the Key Data Covered in this Standard Logic Ic Market Research and Growth Report?

  • What is the expected growth of the Standard Logic Ic Market between 2026 and 2030?

    • USD 190.76 billion, at a CAGR of 12.3%

  • What segmentation does the market report cover?

    • The report is segmented by Type (CMOS logic, TTL, and BiCMOS logic), End-user (Consumer electronic, Telecommunication, Automotive, and Others), Product Type (Combinational logic ICs, Sequential logic ICs, Application-specific integrated circuits (ASICs), Programmable logic devices (PLDs), and Linear logic ICs) and Geography (APAC, North America, Europe, Middle East and Africa, South America)

  • Which regions are analyzed in the report?

    • APAC, North America, Europe, Middle East and Africa and South America

  • What are the key growth drivers and market challenges?

    • Surging global consumer demand concerning high performance automotive computing peripheral systems, Geopolitical trade friction disrupts semiconductor supply chains affecting standard logic components

  • Who are the major players in the Standard Logic Ic Market?

    • Analog Devices Inc., Broadcom Inc., Diodes Inc., Infineon Technologies AG, Intel Corp., MediaTek Inc., Microchip Technology Inc., Nexperia BV, NXP Semiconductors NV, ON Semiconductor Corp., Renesas Electronics Corp., ROHM Co. Ltd., Samsung Electronics Co. Ltd., Silicon Laboratories Inc., Skyworks Solutions Inc., STMicroelectronics NV, Texas Instruments Inc., Toshiba Electronic Devices and Vishay Intertechnology Inc.

Market Research Insights

  • The Standard Logic IC Market functions as the critical interface bridging mechanism for advanced digital infrastructure. As designers prioritize advanced semiconductor technologies alongside edge computing hardware acceleration, integration density has increased substantially. Utilizing predictive logic diagnostics within motion control systems has lowered systemic hardware failure rates by 18%.
  • Furthermore, the adoption of sub-terahertz processing architectures has improved data throughput efficiency by 26% across modern server farms. The strategic deployment of power supply noise filtering logic in automated environments further reduces signal propagation errors by 14%. These measurable operational upgrades ensure seamless, high-frequency signal integrity, optimizing overall equipment effectiveness and minimizing long-term maintenance expenditures for global system integrators.

We can help! Our analysts can customize this standard logic ic market research report to meet your requirements.

Get in touch

1. Executive Summary

1.1 Market overview

Executive Summary - Chart on Market Overview
Executive Summary - Data Table on Market Overview
Executive Summary - Chart on Global Market Characteristics
Executive Summary - Chart on Market by Geography
Executive Summary - Chart on Market Segmentation by Type
Executive Summary - Chart on Market Segmentation by End-user
Executive Summary - Chart on Market Segmentation by Product Type
Executive Summary - Chart on Incremental Growth
Executive Summary - Data Table on Incremental Growth
Executive Summary - Chart on Company Market Positioning

2. Technavio Analysis

2.1 Analysis of price sensitivity, lifecycle, customer purchase basket, adoption rates, and purchase criteria

2.2 Criticality of inputs and Factors of differentiation

Chart on Overview on criticality of inputs and factors of differentiation

2.3 Factors of disruption

Chart on Overview on factors of disruption

2.4 Impact of drivers and challenges

Chart on Impact of drivers and challenges in 2025 and 2030

3. Market Landscape

3.1 Market ecosystem

Chart on Parent Market
Data Table on - Parent Market

3.2 Market characteristics

Chart on Market characteristics analysis

3.3 Value chain analysis

Chart on Value chain analysis

4. Market Sizing

4.1 Market definition

Data Table on Offerings of companies included in the market definition

4.2 Market segment analysis

Market segments

4.3 Market size 2025

4.4 Market outlook: Forecast for 2025-2030

Chart on Global - Market size and forecast 2025-2030 ($ million)
Data Table on Global - Market size and forecast 2025-2030 ($ million)
Chart on Global Market: Year-over-year growth 2025-2030 (%)
Data Table on Global Market: Year-over-year growth 2025-2030 (%)

5. Historic Market Size

5.1 Global Standard Logic IC Market 2020 - 2024

Historic Market Size - Data Table on Global Standard Logic IC Market 2020 - 2024 ($ million)

5.2 Type segment analysis 2020 - 2024

Historic Market Size - Type Segment 2020 - 2024 ($ million)

5.3 End-user segment analysis 2020 - 2024

Historic Market Size - End-user Segment 2020 - 2024 ($ million)

5.4 Product Type segment analysis 2020 - 2024

Historic Market Size - Product Type Segment 2020 - 2024 ($ million)

5.5 Geography segment analysis 2020 - 2024

Historic Market Size - Geography Segment 2020 - 2024 ($ million)

5.6 Country segment analysis 2020 - 2024

Historic Market Size - Country Segment 2020 - 2024 ($ million)

6. Qualitative Analysis

6.1 Impact of AI on global standard logic IC market

6.2 Impact of geopolitical conflicts on global standard logic IC market

7. Five Forces Analysis

7.1 Five forces summary

Five forces analysis - Comparison between 2025 and 2030

7.2 Bargaining power of buyers

Bargaining power of buyers - Impact of key factors 2025 and 2030

7.3 Bargaining power of suppliers

Bargaining power of suppliers - Impact of key factors in 2025 and 2030

7.4 Threat of new entrants

Threat of new entrants - Impact of key factors in 2025 and 2030

7.5 Threat of substitutes

Threat of substitutes - Impact of key factors in 2025 and 2030

7.6 Threat of rivalry

Threat of rivalry - Impact of key factors in 2025 and 2030

7.7 Market condition

Chart on Market condition - Five forces 2025 and 2030

8. Market Segmentation by Type

8.1 Market segments

Chart on Type - Market share 2025-2030 (%)
Data Table on Type - Market share 2025-2030 (%)

8.2 Comparison by Type

Chart on Comparison by Type
Data Table on Comparison by Type

8.3 CMOS logic - Market size and forecast 2025-2030

Chart on CMOS logic - Market size and forecast 2025-2030 ($ million)
Data Table on CMOS logic - Market size and forecast 2025-2030 ($ million)
Chart on CMOS logic - Year-over-year growth 2025-2030 (%)
Data Table on CMOS logic - Year-over-year growth 2025-2030 (%)

8.4 TTL - Market size and forecast 2025-2030

Chart on TTL - Market size and forecast 2025-2030 ($ million)
Data Table on TTL - Market size and forecast 2025-2030 ($ million)
Chart on TTL - Year-over-year growth 2025-2030 (%)
Data Table on TTL - Year-over-year growth 2025-2030 (%)

8.5 BiCMOS logic - Market size and forecast 2025-2030

Chart on BiCMOS logic - Market size and forecast 2025-2030 ($ million)
Data Table on BiCMOS logic - Market size and forecast 2025-2030 ($ million)
Chart on BiCMOS logic - Year-over-year growth 2025-2030 (%)
Data Table on BiCMOS logic - Year-over-year growth 2025-2030 (%)

8.6 Market opportunity by Type

Market opportunity by Type ($ million)
Data Table on Market opportunity by Type ($ million)

9. Market Segmentation by End-user

9.1 Market segments

Chart on End-user - Market share 2025-2030 (%)
Data Table on End-user - Market share 2025-2030 (%)

9.2 Comparison by End-user

Chart on Comparison by End-user
Data Table on Comparison by End-user

9.3 Consumer electronic - Market size and forecast 2025-2030

Chart on Consumer electronic - Market size and forecast 2025-2030 ($ million)
Data Table on Consumer electronic - Market size and forecast 2025-2030 ($ million)
Chart on Consumer electronic - Year-over-year growth 2025-2030 (%)
Data Table on Consumer electronic - Year-over-year growth 2025-2030 (%)

9.4 Telecommunication - Market size and forecast 2025-2030

Chart on Telecommunication - Market size and forecast 2025-2030 ($ million)
Data Table on Telecommunication - Market size and forecast 2025-2030 ($ million)
Chart on Telecommunication - Year-over-year growth 2025-2030 (%)
Data Table on Telecommunication - Year-over-year growth 2025-2030 (%)

9.5 Automotive - Market size and forecast 2025-2030

Chart on Automotive - Market size and forecast 2025-2030 ($ million)
Data Table on Automotive - Market size and forecast 2025-2030 ($ million)
Chart on Automotive - Year-over-year growth 2025-2030 (%)
Data Table on Automotive - Year-over-year growth 2025-2030 (%)

9.6 Others - Market size and forecast 2025-2030

Chart on Others - Market size and forecast 2025-2030 ($ million)
Data Table on Others - Market size and forecast 2025-2030 ($ million)
Chart on Others - Year-over-year growth 2025-2030 (%)
Data Table on Others - Year-over-year growth 2025-2030 (%)

9.7 Market opportunity by End-user

Market opportunity by End-user ($ million)
Data Table on Market opportunity by End-user ($ million)

10. Market Segmentation by Product Type

10.1 Market segments

Chart on Product Type - Market share 2025-2030 (%)
Data Table on Product Type - Market share 2025-2030 (%)

10.2 Comparison by Product Type

Chart on Comparison by Product Type
Data Table on Comparison by Product Type

10.3 Combinational logic ICs - Market size and forecast 2025-2030

Chart on Combinational logic ICs - Market size and forecast 2025-2030 ($ million)
Data Table on Combinational logic ICs - Market size and forecast 2025-2030 ($ million)
Chart on Combinational logic ICs - Year-over-year growth 2025-2030 (%)
Data Table on Combinational logic ICs - Year-over-year growth 2025-2030 (%)

10.4 Sequential logic ICs - Market size and forecast 2025-2030

Chart on Sequential logic ICs - Market size and forecast 2025-2030 ($ million)
Data Table on Sequential logic ICs - Market size and forecast 2025-2030 ($ million)
Chart on Sequential logic ICs - Year-over-year growth 2025-2030 (%)
Data Table on Sequential logic ICs - Year-over-year growth 2025-2030 (%)

10.5 Application-specific integrated circuits (ASICs) - Market size and forecast 2025-2030

Chart on Application-specific integrated circuits (ASICs) - Market size and forecast 2025-2030 ($ million)
Data Table on Application-specific integrated circuits (ASICs) - Market size and forecast 2025-2030 ($ million)
Chart on Application-specific integrated circuits (ASICs) - Year-over-year growth 2025-2030 (%)
Data Table on Application-specific integrated circuits (ASICs) - Year-over-year growth 2025-2030 (%)

10.6 Programmable logic devices (PLDs) - Market size and forecast 2025-2030

Chart on Programmable logic devices (PLDs) - Market size and forecast 2025-2030 ($ million)
Data Table on Programmable logic devices (PLDs) - Market size and forecast 2025-2030 ($ million)
Chart on Programmable logic devices (PLDs) - Year-over-year growth 2025-2030 (%)
Data Table on Programmable logic devices (PLDs) - Year-over-year growth 2025-2030 (%)

10.7 Linear logic ICs - Market size and forecast 2025-2030

Chart on Linear logic ICs - Market size and forecast 2025-2030 ($ million)
Data Table on Linear logic ICs - Market size and forecast 2025-2030 ($ million)
Chart on Linear logic ICs - Year-over-year growth 2025-2030 (%)
Data Table on Linear logic ICs - Year-over-year growth 2025-2030 (%)

10.8 Market opportunity by Product Type

Market opportunity by Product Type ($ million)
Data Table on Market opportunity by Product Type ($ million)

11. Customer Landscape

11.1 Customer landscape overview

Analysis of price sensitivity, lifecycle, customer purchase basket, adoption rates, and purchase criteria

12. Geographic Landscape

12.1 Geographic segmentation

Chart on Market share by geography 2025-2030 (%)
Data Table on Market share by geography 2025-2030 (%)

12.2 Geographic comparison

Chart on Geographic comparison
Data Table on Geographic comparison

12.3 APAC - Market size and forecast 2025-2030

Chart on APAC - Market size and forecast 2025-2030 ($ million)
Data Table on APAC - Market size and forecast 2025-2030 ($ million)
Chart on APAC - Year-over-year growth 2025-2030 (%)
Data Table on APAC - Year-over-year growth 2025-2030 (%)
Chart on Regional Comparison - APAC
Data Table on Regional Comparison - APAC

12.3.1 China - Market size and forecast 2025-2030

Chart on China - Market size and forecast 2025-2030 ($ million)
Data Table on China - Market size and forecast 2025-2030 ($ million)
Chart on China - Year-over-year growth 2025-2030 (%)
Data Table on China - Year-over-year growth 2025-2030 (%)

12.3.2 Japan - Market size and forecast 2025-2030

Chart on Japan - Market size and forecast 2025-2030 ($ million)
Data Table on Japan - Market size and forecast 2025-2030 ($ million)
Chart on Japan - Year-over-year growth 2025-2030 (%)
Data Table on Japan - Year-over-year growth 2025-2030 (%)

12.3.3 South Korea - Market size and forecast 2025-2030

Chart on South Korea - Market size and forecast 2025-2030 ($ million)
Data Table on South Korea - Market size and forecast 2025-2030 ($ million)
Chart on South Korea - Year-over-year growth 2025-2030 (%)
Data Table on South Korea - Year-over-year growth 2025-2030 (%)

12.3.4 Taiwan - Market size and forecast 2025-2030

Chart on Taiwan - Market size and forecast 2025-2030 ($ million)
Data Table on Taiwan - Market size and forecast 2025-2030 ($ million)
Chart on Taiwan - Year-over-year growth 2025-2030 (%)
Data Table on Taiwan - Year-over-year growth 2025-2030 (%)

12.3.5 India - Market size and forecast 2025-2030

Chart on India - Market size and forecast 2025-2030 ($ million)
Data Table on India - Market size and forecast 2025-2030 ($ million)
Chart on India - Year-over-year growth 2025-2030 (%)
Data Table on India - Year-over-year growth 2025-2030 (%)

12.3.6 Singapore - Market size and forecast 2025-2030

Chart on Singapore - Market size and forecast 2025-2030 ($ million)
Data Table on Singapore - Market size and forecast 2025-2030 ($ million)
Chart on Singapore - Year-over-year growth 2025-2030 (%)
Data Table on Singapore - Year-over-year growth 2025-2030 (%)

12.4 North America - Market size and forecast 2025-2030

Chart on North America - Market size and forecast 2025-2030 ($ million)
Data Table on North America - Market size and forecast 2025-2030 ($ million)
Chart on North America - Year-over-year growth 2025-2030 (%)
Data Table on North America - Year-over-year growth 2025-2030 (%)
Chart on Regional Comparison - North America
Data Table on Regional Comparison - North America

12.4.1 US - Market size and forecast 2025-2030

Chart on US - Market size and forecast 2025-2030 ($ million)
Data Table on US - Market size and forecast 2025-2030 ($ million)
Chart on US - Year-over-year growth 2025-2030 (%)
Data Table on US - Year-over-year growth 2025-2030 (%)

12.4.2 Canada - Market size and forecast 2025-2030

Chart on Canada - Market size and forecast 2025-2030 ($ million)
Data Table on Canada - Market size and forecast 2025-2030 ($ million)
Chart on Canada - Year-over-year growth 2025-2030 (%)
Data Table on Canada - Year-over-year growth 2025-2030 (%)

12.4.3 Mexico - Market size and forecast 2025-2030

Chart on Mexico - Market size and forecast 2025-2030 ($ million)
Data Table on Mexico - Market size and forecast 2025-2030 ($ million)
Chart on Mexico - Year-over-year growth 2025-2030 (%)
Data Table on Mexico - Year-over-year growth 2025-2030 (%)

12.5 Europe - Market size and forecast 2025-2030

Chart on Europe - Market size and forecast 2025-2030 ($ million)
Data Table on Europe - Market size and forecast 2025-2030 ($ million)
Chart on Europe - Year-over-year growth 2025-2030 (%)
Data Table on Europe - Year-over-year growth 2025-2030 (%)
Chart on Regional Comparison - Europe
Data Table on Regional Comparison - Europe

12.5.1 Germany - Market size and forecast 2025-2030

Chart on Germany - Market size and forecast 2025-2030 ($ million)
Data Table on Germany - Market size and forecast 2025-2030 ($ million)
Chart on Germany - Year-over-year growth 2025-2030 (%)
Data Table on Germany - Year-over-year growth 2025-2030 (%)

12.5.2 UK - Market size and forecast 2025-2030

Chart on UK - Market size and forecast 2025-2030 ($ million)
Data Table on UK - Market size and forecast 2025-2030 ($ million)
Chart on UK - Year-over-year growth 2025-2030 (%)
Data Table on UK - Year-over-year growth 2025-2030 (%)

12.5.3 France - Market size and forecast 2025-2030

Chart on France - Market size and forecast 2025-2030 ($ million)
Data Table on France - Market size and forecast 2025-2030 ($ million)
Chart on France - Year-over-year growth 2025-2030 (%)
Data Table on France - Year-over-year growth 2025-2030 (%)

12.5.4 Italy - Market size and forecast 2025-2030

Chart on Italy - Market size and forecast 2025-2030 ($ million)
Data Table on Italy - Market size and forecast 2025-2030 ($ million)
Chart on Italy - Year-over-year growth 2025-2030 (%)
Data Table on Italy - Year-over-year growth 2025-2030 (%)

12.5.5 The Netherlands - Market size and forecast 2025-2030

Chart on The Netherlands - Market size and forecast 2025-2030 ($ million)
Data Table on The Netherlands - Market size and forecast 2025-2030 ($ million)
Chart on The Netherlands - Year-over-year growth 2025-2030 (%)
Data Table on The Netherlands - Year-over-year growth 2025-2030 (%)

12.5.6 Switzerland - Market size and forecast 2025-2030

Chart on Switzerland - Market size and forecast 2025-2030 ($ million)
Data Table on Switzerland - Market size and forecast 2025-2030 ($ million)
Chart on Switzerland - Year-over-year growth 2025-2030 (%)
Data Table on Switzerland - Year-over-year growth 2025-2030 (%)

12.6 Middle East and Africa - Market size and forecast 2025-2030

Chart on Middle East and Africa - Market size and forecast 2025-2030 ($ million)
Data Table on Middle East and Africa - Market size and forecast 2025-2030 ($ million)
Chart on Middle East and Africa - Year-over-year growth 2025-2030 (%)
Data Table on Middle East and Africa - Year-over-year growth 2025-2030 (%)
Chart on Regional Comparison - Middle East and Africa
Data Table on Regional Comparison - Middle East and Africa

12.6.1 Israel - Market size and forecast 2025-2030

Chart on Israel - Market size and forecast 2025-2030 ($ million)
Data Table on Israel - Market size and forecast 2025-2030 ($ million)
Chart on Israel - Year-over-year growth 2025-2030 (%)
Data Table on Israel - Year-over-year growth 2025-2030 (%)

12.6.2 Saudi Arabia - Market size and forecast 2025-2030

Chart on Saudi Arabia - Market size and forecast 2025-2030 ($ million)
Data Table on Saudi Arabia - Market size and forecast 2025-2030 ($ million)
Chart on Saudi Arabia - Year-over-year growth 2025-2030 (%)
Data Table on Saudi Arabia - Year-over-year growth 2025-2030 (%)

12.6.3 UAE - Market size and forecast 2025-2030

Chart on UAE - Market size and forecast 2025-2030 ($ million)
Data Table on UAE - Market size and forecast 2025-2030 ($ million)
Chart on UAE - Year-over-year growth 2025-2030 (%)
Data Table on UAE - Year-over-year growth 2025-2030 (%)

12.6.4 South Africa - Market size and forecast 2025-2030

Chart on South Africa - Market size and forecast 2025-2030 ($ million)
Data Table on South Africa - Market size and forecast 2025-2030 ($ million)
Chart on South Africa - Year-over-year growth 2025-2030 (%)
Data Table on South Africa - Year-over-year growth 2025-2030 (%)

12.6.5 Turkey - Market size and forecast 2025-2030

Chart on Turkey - Market size and forecast 2025-2030 ($ million)
Data Table on Turkey - Market size and forecast 2025-2030 ($ million)
Chart on Turkey - Year-over-year growth 2025-2030 (%)
Data Table on Turkey - Year-over-year growth 2025-2030 (%)

12.7 South America - Market size and forecast 2025-2030

Chart on South America - Market size and forecast 2025-2030 ($ million)
Data Table on South America - Market size and forecast 2025-2030 ($ million)
Chart on South America - Year-over-year growth 2025-2030 (%)
Data Table on South America - Year-over-year growth 2025-2030 (%)
Chart on Regional Comparison - South America
Data Table on Regional Comparison - South America

12.7.1 Brazil - Market size and forecast 2025-2030

Chart on Brazil - Market size and forecast 2025-2030 ($ million)
Data Table on Brazil - Market size and forecast 2025-2030 ($ million)
Chart on Brazil - Year-over-year growth 2025-2030 (%)
Data Table on Brazil - Year-over-year growth 2025-2030 (%)

12.7.2 Argentina - Market size and forecast 2025-2030

Chart on Argentina - Market size and forecast 2025-2030 ($ million)
Data Table on Argentina - Market size and forecast 2025-2030 ($ million)
Chart on Argentina - Year-over-year growth 2025-2030 (%)
Data Table on Argentina - Year-over-year growth 2025-2030 (%)

12.7.3 Chile - Market size and forecast 2025-2030

Chart on Chile - Market size and forecast 2025-2030 ($ million)
Data Table on Chile - Market size and forecast 2025-2030 ($ million)
Chart on Chile - Year-over-year growth 2025-2030 (%)
Data Table on Chile - Year-over-year growth 2025-2030 (%)

12.8 Market opportunity by geography

Market opportunity by geography ($ million)
Data Tables on Market opportunity by geography ($ million)

13. Drivers, Challenges, and Opportunity

13.1 Market drivers

Surging global consumer demand concerning high performance automotive computing peripheral systems
Accelerated proliferation involving sophisticated smart factory robotics industrial automation digital networks
Rapid continuous telecommunication upgrades expanding requirements regarding integrated voltage level translation

13.2 Market challenges

Geopolitical trade friction disrupts semiconductor supply chains affecting standard logic components
Miniaturization constraints restrict traditional packaging efficiency within dense electronic system architectures
Extended qualification cycles delay product commercialization schedules straining initial developer returns

13.3 Impact of drivers and challenges

Impact of drivers and challenges in 2025 and 2030

13.4 Market opportunities

Strategic corporate consolidations expanding product variety across embedded wireless processing platforms
Widespread market integration regarding wafer scale packaging designs optimizing system space
Frequent innovative product introductions featuring advanced gate driver semiconductor bridge circuits

14. Competitive Landscape

14.1 Overview

14.2

Overview on criticality of inputs and factors of differentiation

14.3 Landscape disruption

Overview on factors of disruption

14.4 Industry risks

Impact of key risks on business

15. Competitive Analysis

15.1 Companies profiled

Companies covered

15.2 Company ranking index

15.3 Market positioning of companies

Matrix on companies position and classification

15.4 Analog Devices Inc.

Analog Devices Inc. - Overview
Analog Devices Inc. - Business segments
Analog Devices Inc. - Key offerings
Analog Devices Inc. - Segment focus
SWOT

15.5 Broadcom Inc.

Broadcom Inc. - Overview
Broadcom Inc. - Business segments
Broadcom Inc. - Key news
Broadcom Inc. - Key offerings
Broadcom Inc. - Segment focus
SWOT

15.6 Diodes Inc.

Diodes Inc. - Overview
Diodes Inc. - Product / Service
Diodes Inc. - Key news
Diodes Inc. - Key offerings
SWOT

15.7 Infineon Technologies AG

Infineon Technologies AG - Overview
Infineon Technologies AG - Business segments
Infineon Technologies AG - Key news
Infineon Technologies AG - Key offerings
Infineon Technologies AG - Segment focus
SWOT

15.8 Intel Corp.

Intel Corp. - Overview
Intel Corp. - Business segments
Intel Corp. - Key news
Intel Corp. - Key offerings
Intel Corp. - Segment focus
SWOT

15.9 Microchip Technology Inc.

Microchip Technology Inc. - Overview
Microchip Technology Inc. - Business segments
Microchip Technology Inc. - Key offerings
Microchip Technology Inc. - Segment focus
SWOT

15.10 Nexperia BV

Nexperia BV - Overview
Nexperia BV - Product / Service
Nexperia BV - Key offerings
SWOT

15.11 NXP Semiconductors NV

NXP Semiconductors NV - Overview
NXP Semiconductors NV - Business segments
NXP Semiconductors NV - Key news
NXP Semiconductors NV - Key offerings
NXP Semiconductors NV - Segment focus
SWOT

15.12 ON Semiconductor Corp.

ON Semiconductor Corp. - Overview
ON Semiconductor Corp. - Business segments
ON Semiconductor Corp. - Key news
ON Semiconductor Corp. - Key offerings
ON Semiconductor Corp. - Segment focus
SWOT

15.13 Renesas Electronics Corp.

Renesas Electronics Corp. - Overview
Renesas Electronics Corp. - Business segments
Renesas Electronics Corp. - Key offerings
Renesas Electronics Corp. - Segment focus
SWOT

15.14 ROHM Co. Ltd.

ROHM Co. Ltd. - Overview
ROHM Co. Ltd. - Business segments
ROHM Co. Ltd. - Key news
ROHM Co. Ltd. - Key offerings
ROHM Co. Ltd. - Segment focus
SWOT

15.15 Samsung Electronics Co. Ltd.

Samsung Electronics Co. Ltd. - Overview
Samsung Electronics Co. Ltd. - Business segments
Samsung Electronics Co. Ltd. - Key news
Samsung Electronics Co. Ltd. - Key offerings
Samsung Electronics Co. Ltd. - Segment focus
SWOT

15.16 STMicroelectronics NV

STMicroelectronics NV - Overview
STMicroelectronics NV - Business segments
STMicroelectronics NV - Key news
STMicroelectronics NV - Key offerings
STMicroelectronics NV - Segment focus
SWOT

15.17 Texas Instruments Inc.

Texas Instruments Inc. - Overview
Texas Instruments Inc. - Business segments
Texas Instruments Inc. - Key news
Texas Instruments Inc. - Key offerings
Texas Instruments Inc. - Segment focus
SWOT

15.18 Vishay Intertechnology Inc.

Vishay Intertechnology Inc. - Overview
Vishay Intertechnology Inc. - Business segments
Vishay Intertechnology Inc. - Key news
Vishay Intertechnology Inc. - Key offerings
Vishay Intertechnology Inc. - Segment focus
SWOT

16. Appendix

16.1 Scope of the report

Market definition
Objectives
Notes and caveats

16.2 Inclusions and exclusions checklist

Inclusions checklist
Exclusions checklist

16.3 Currency conversion rates for US$

16.4 Research methodology

16.5 Data procurement

Information sources

16.6 Data validation

16.7 Validation techniques employed for market sizing

16.8 Data synthesis

16.9 360 degree market analysis

16.10 List of abbreviations

Research Methodology

Technavio presents a detailed picture of the market by way of study, synthesis, and summation of data from multiple sources. The analysts have presented the various facets of the market with a particular focus on identifying the key industry influencers. The data thus presented is comprehensive, reliable, and the result of extensive research, both primary and secondary.

INFORMATION SOURCES

Primary sources

  • Manufacturers and suppliers
  • Channel partners
  • Industry experts
  • Strategic decision makers

Secondary sources

  • Industry journals and periodicals
  • Government data
  • Financial reports of key industry players
  • Historical data
  • Press releases

DATA ANALYSIS

Data Synthesis

  • Collation of data
  • Estimation of key figures
  • Analysis of derived insights

Data Validation

  • Triangulation with data models
  • Reference against proprietary databases
  • Corroboration with industry experts

REPORT WRITING

Qualitative

  • Market drivers
  • Market challenges
  • Market trends
  • Five forces analysis

Quantitative

  • Market size and forecast
  • Market segmentation
  • Geographical insights
  • Competitive landscape

Interested in this report?

Get your sample now to see our research methodology and insights!

Download Now

Frequently Asked Questions

Standard Logic Ic market growth will increase by USD 190764.4 million during 2026-2030.

The Standard Logic Ic market is expected to grow at a CAGR of 12.3% during 2026-2030.

Standard Logic Ic market is segmented by Type (CMOS logic, TTL, BiCMOS logic) End-user (Consumer electronic, Telecommunication, Automotive, Others) Product type (Combinational logic ICs, Sequential logic ICs, Application-specific integrated circuits (ASICs), Programmable logic devices (PLDs), Linear logic ICs)

Analog Devices Inc., Broadcom Inc., Diodes Inc., Infineon Technologies AG, Intel Corp., MediaTek Inc., Microchip Technology Inc., Nexperia BV, NXP Semiconductors NV, ON Semiconductor Corp., Renesas Electronics Corp., ROHM Co. Ltd., Samsung Electronics Co. Ltd., Silicon Laboratories Inc., Skyworks Solutions Inc., STMicroelectronics NV, Texas Instruments Inc., Toshiba Electronic Devices, Vishay Intertechnology Inc. are a few of the key vendors in the Standard Logic Ic market.

APAC will register the highest growth rate of 66% among the other regions. Therefore, the Standard Logic Ic market in APAC is expected to garner significant business opportunities for the vendors during the forecast period.

China, Japan, South Korea, Taiwan, India, Singapore, US, Canada, Mexico, Germany, UK, France, Italy, The Netherlands, Switzerland, Israel, Saudi Arabia, UAE, South Africa, Turkey, Brazil, Argentina, Chile

  • Surging global consumer demand concerning high performance automotive computing peripheral systems is the driving factor this market.

The Standard Logic Ic market vendors should focus on grabbing business opportunities from the Type segment as it accounted for the largest market share in the base year.
RIA - Research AI Assistant
Ask RIA
