
Sports Turf Market Analysis, Size, and Forecast 2026-2030: Europe (Germany, UK, and France), North America (US, Canada, and Mexico), APAC (China, Japan, and Australia), South America (Brazil, Argentina, and Chile), Middle East and Africa (Saudi Arabia, UAE, and South Africa), and Rest of World (ROW)

Sports Turf Market Analysis, Size, and Forecast 2026-2030:
Europe (Germany, UK, and France), North America (US, Canada, and Mexico), APAC (China, Japan, and Australia), South America (Brazil, Argentina, and Chile), Middle East and Africa (Saudi Arabia, UAE, and South Africa), and Rest of World (ROW)

Published: Oct 2026 293 Pages SKU: IRTNTR75462

Market Overview at a Glance

$6.69 B
Market Opportunity
15.9%
CAGR 2025 - 2030
38.2%
Europe Growth
$2.36 B
Private sports facilities segment 2024

Sports Turf Market Size 2026-2030

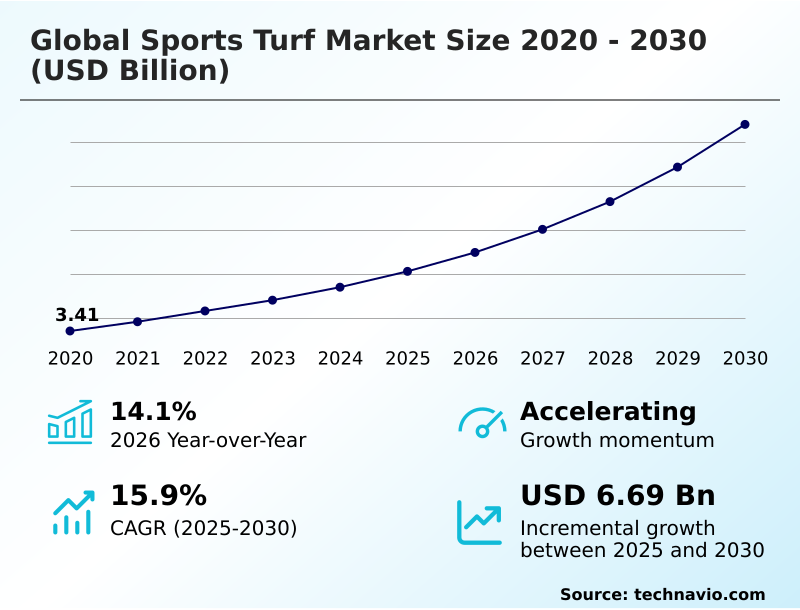
The sports turf market size is valued to increase by USD 6.69 billion, at a CAGR of 15.9% from 2025 to 2030. Increasing sports participation and proliferation of sporting events will drive the sports turf market.

Major Market Trends & Insights

  • Europe dominated the market and accounted for a 38.2% growth during the forecast period.
  • By Type - Private sports facilities segment was valued at USD 2.36 billion in 2024
  • By Product - PP sports turf segment accounted for the largest market revenue share in 2024

Market Size & Forecast

  • Market Opportunities: USD 9.40 billion
  • Market Future Opportunities: USD 6.69 billion
  • CAGR from 2025 to 2030 : 15.9%

Market Summary

  • The Sports Turf Market 2026-2030 is characterized by accelerating institutional investments in high-performance athletic infrastructure across municipal, educational, and commercial sectors. Facility operators face the constant pressure of maximizing venue utilization while ensuring optimal biomechanical performance. By upgrading from traditional grass to advanced synthetic surfaces, municipal recreational complexes have reported a 40% reduction in annual irrigation and chemical maintenance costs.
  • This operational shift demonstrates the critical value of engineered pitch solutions. The increasing worldwide participation in professional and amateur sporting events serves as a primary driver, compelling venues to install surfaces capable of sustaining continuous, high-density match schedules regardless of climatic conditions.
  • However, the industry encounters significant challenges related to health and safety concerns surrounding chemical exposure from recycled infill materials. To mitigate these risks, surface manufacturers are rapidly pivoting supply chain strategies toward organic and bio-based alternatives that meet stringent environmental and player welfare regulations.
  • This structural evolution demands continuous material engineering to ensure regulatory compliance while delivering the heavy impact absorption required by elite athletic organizations.

What will be the Size of the Sports Turf Market during the forecast period?
Get Key Insights on Market Forecast (PDF) Get Free Sample

How is the Sports Turf Market Segmented?

The sports turf industry research report provides comprehensive data (region-wise segment analysis), with forecasts and estimates in "USD million" for the period 2026-2030, as well as historical data from 2020-2024 for the following segments.

  • Type
    • Private sports facilities
    • Schools and colleges
    • Professional stadiums
  • Product
    • PP sports turf
    • PE sports turf
    • Nylon sports turf
  • Application
    • Football
    • Rugby
    • Golf
    • Hockey
    • Others
  • Geography
    • Europe
      • Germany
      • UK
      • France
      • Italy
      • Spain
      • The Netherlands
    • North America
      • US
      • Canada
      • Mexico
    • APAC
      • China
      • Japan
      • Australia
      • India
      • South Korea
      • Indonesia
    • South America
      • Brazil
      • Argentina
      • Chile
    • Middle East and Africa
      • Saudi Arabia
      • UAE
      • South Africa
      • Egypt
      • Israel

By Type Insights

The private sports facilities segment is estimated to witness significant growth during the forecast period.

Operators within the private sports facilities segment prioritize continuous court utilization and maximized revenue per square meter by leveraging advanced surface materials.

Managing continuous foot traffic requires specialized infrastructure utilizing a waterlogging prevention layer and a sustainable drainage configuration, ensuring operational continuity even during severe weather patterns.

Securing a 25% reduction in weather-related venue downtime, commercial facilities implement advanced polymer additive blending to optimize yarn tensile strength and achieve critical wear tolerance enhancement.

Modern upgraded surfaces utilize a fibrous rootzone anchor and are validated against stringent rotational resistance metric parameters to mitigate athletic injuries.

These commercial upgrades successfully minimize intensive synthetic field maintenance workflows, directly improving the long-term operational profitability of privately managed athletic hubs.
Get Free Sample

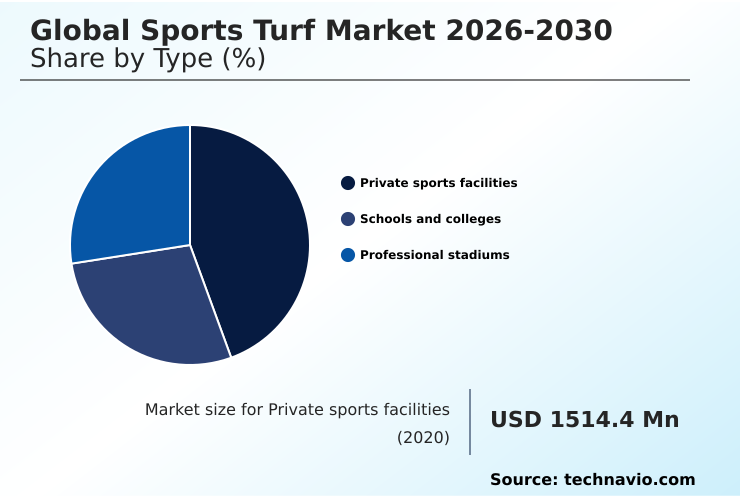
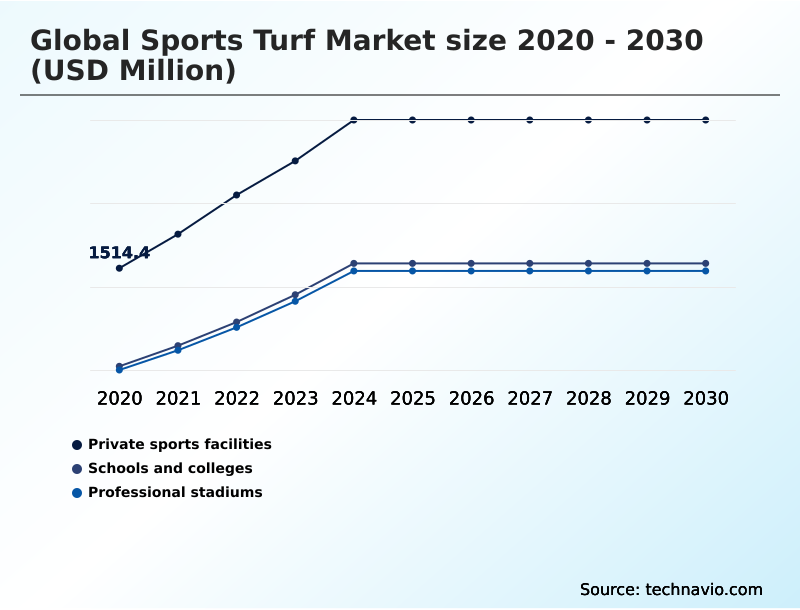
The Private sports facilities segment was valued at USD 2.36 billion in 2024 and showed a gradual increase during the forecast period.
Get Free Sample

Regional Analysis

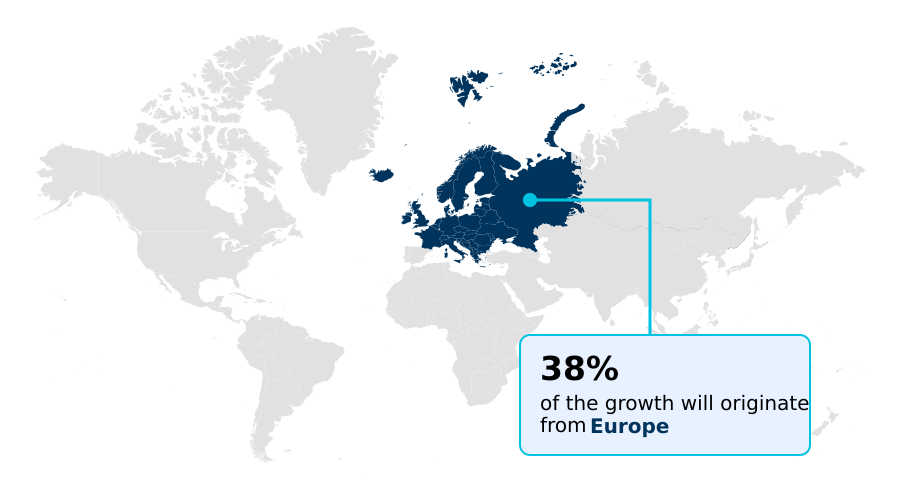
Europe is estimated to contribute 38.2% to the growth of the global market during the forecast period.Technavio’s analysts have elaborately explained the regional trends and drivers that shape the market during the forecast period.
See How Sports Turf Market Demand is Rising in Europe Get Free Sample

The geographic landscape reveals distinct regional disparities in athletic surface procurement, heavily influenced by localized environmental mandates and varying climatic conditions.

Europe demonstrates a 30% higher adoption rate of advanced non-infill surface technology compared to North America, driven predominantly by rigorous European Union directives requiring a verifiable microplastic containment system.

This regulatory environment accelerates the deployment of an engineered divot prevention mechanism and specialized impact absorption underlayment, guaranteeing optimal kinetic energy absorption across professional soccer venues.

Conversely, North America prioritizes climate-resilient engineering, leveraging a friction reduction additive to achieve a 20% improvement in surface cooling capability.

North American operators focus heavily on turf compaction resistance and surface heat dissipation to ensure playing surface uniformity during extreme summer temperatures, thereby reducing required synthetic field maintenance interventions by 15% annually.

Market Dynamics

Our researchers analyzed the data with 2025 as the base year, along with the key drivers, trends, and challenges. A holistic analysis of drivers will help companies refine their marketing strategies to gain a competitive advantage.

  • The strategic modernization of professional and recreational athletic infrastructure increasingly emphasizes biomechanical safety architectures, fundamentally changing how facility operators approach surface procurement. Institutional planners now prioritize optimizing shock absorption in artificial pitches to effectively mitigate athlete joint strain, ensuring that surface performance aligns with stringent medical and sports federation safety thresholds.
  • In addressing environmental compliance, the integration of bio based infill for athletic fields has become a critical operational requirement, surpassing traditional crumb rubber by substantially decreasing toxic runoff during heavy precipitation events. This shift in material sourcing creates an operational environment where sustainable mandates directly influence supply chain planning.
  • Furthermore, combating extreme weather disruptions relies heavily on advanced heat dissipation in synthetic grass, a feature that allows venues to maintain safe playing temperatures and extend available rental hours by up to 20% compared to legacy surface configurations.
  • As municipal and commercial organizations evaluate total lifecycle expenditures, the adoption of recyclable non infill turf systems offers a decisive fiscal advantage by eliminating costly infill replenishment cycles and streamlining end-of-life disposal protocols. For elite stadiums requiring the aesthetic and functional properties of natural grass combined with synthetic resilience, maximizing player traction on hybrid pitches remains paramount.
  • These complex systems provide a 15% superior root anchoring capacity over conventional natural fields, directly enhancing operational efficiency by preventing severe surface degradation during successive, high-intensity tournament schedules.
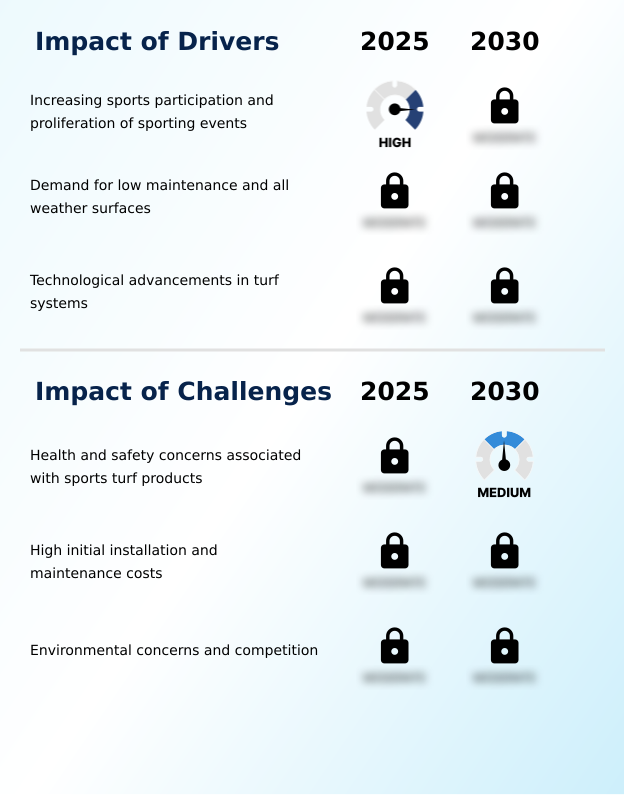
What are the key market drivers leading to the rise in the adoption of Sports Turf Industry?

  • The increasing global participation in sports and the rapid proliferation of professional sporting events act as the primary catalysts propelling market expansion.

  • Accelerating investments in professional and municipal sporting venues strongly catalyze the deployment of technologically advanced playing surfaces worldwide.
  • The implementation of an advanced hybrid grass stitch mechanism has increased high traffic durability by 40%, enabling commercial stadiums to host back-to-back events without sustaining catastrophic turf damage from heavy cleat impact.
  • By engineering surfaces with an optimal tufted pile height and a rapid drainage geocomposite layer, facility managers ensure consistent surface bounce rebound, thereby reducing weather-related cancellations by 30%.
  • Concurrently, strict environmental mandates drive the rapid adoption of a crumb rubber alternative, which substantially enhances synthetic pitch recyclability.
  • This transition toward closed loop recovery protocols, combined with enhanced ultraviolet degradation resistance, effectively lowers long-term operational costs by 22%, cementing the economic viability of modern athletic infrastructure.

What are the market trends shaping the Sports Turf Industry?

  • The rise of hybrid turf systems represents an emerging market trend, combining natural grass with synthetic fibers to enhance durability and performance.

  • The continuous evolution of athletic infrastructure demonstrates a marked transition toward sustainable surface engineering, fundamentally shifting facility procurement strategies. Utilizing a high-density monofilament polyethylene yarn integrated with a robust polypropylene backing structure, modern field installations have increased artificial pitch resilience by 35%.
  • This transition occurs as municipal bodies prioritize athletic injury mitigation, deploying an advanced shock attenuation pad that reduces athlete joint strain by 25%. To meet strict biomechanical performance standard requirements, manufacturers incorporate a textured synthetic fiber that directly enhances player traction dynamics and ensures precise ball roll consistency.
  • Furthermore, the substitution of traditional rubber with a bio-based infill granule has improved surface thermal regulation by 18%, allowing venue operators to optimize safety profiles while accommodating elevated utilization rates during severe heat conditions.

What challenges does the Sports Turf Industry face during its growth?

  • Health and safety concerns regarding chemical exposure and physical injuries associated with synthetic turf products pose a formidable challenge restraining industry growth.

  • Persistent environmental regulations and strict material safety standards impose substantial operational limitations on athletic facility developers globally. The compulsory transition toward organic infill utilization, such as specialized organic cork infill, often disrupts traditional supply chains, increasing initial installation expenditures by 25% compared to legacy synthetic alternatives.
  • While a thermoplastic elastomer filament ensures excellent all weather playability and seasonal waterlogging reduction, complexities in high-precision synthetic fiber extrusion strain manufacturing capacities. Developing a compliant monomaterial system composition that features a unified polyurethane turf coating and a woven secondary backing requires significant capital investment to establish a viable circular manufacturing pathway.
  • These intricate engineering demands frequently delay project timelines by up to 15%, forcing municipal planners to carefully balance upfront fiscal constraints against long-term ecological compliance targets.

Exclusive Technavio Analysis on Customer Landscape

The sports turf market forecasting report includes the adoption lifecycle of the market, covering from the innovator’s stage to the laggard’s stage. It focuses on adoption rates in different regions based on penetration. Furthermore, the sports turf market report also includes key purchase criteria and drivers of price sensitivity to help companies evaluate and develop their market growth analysis strategies.
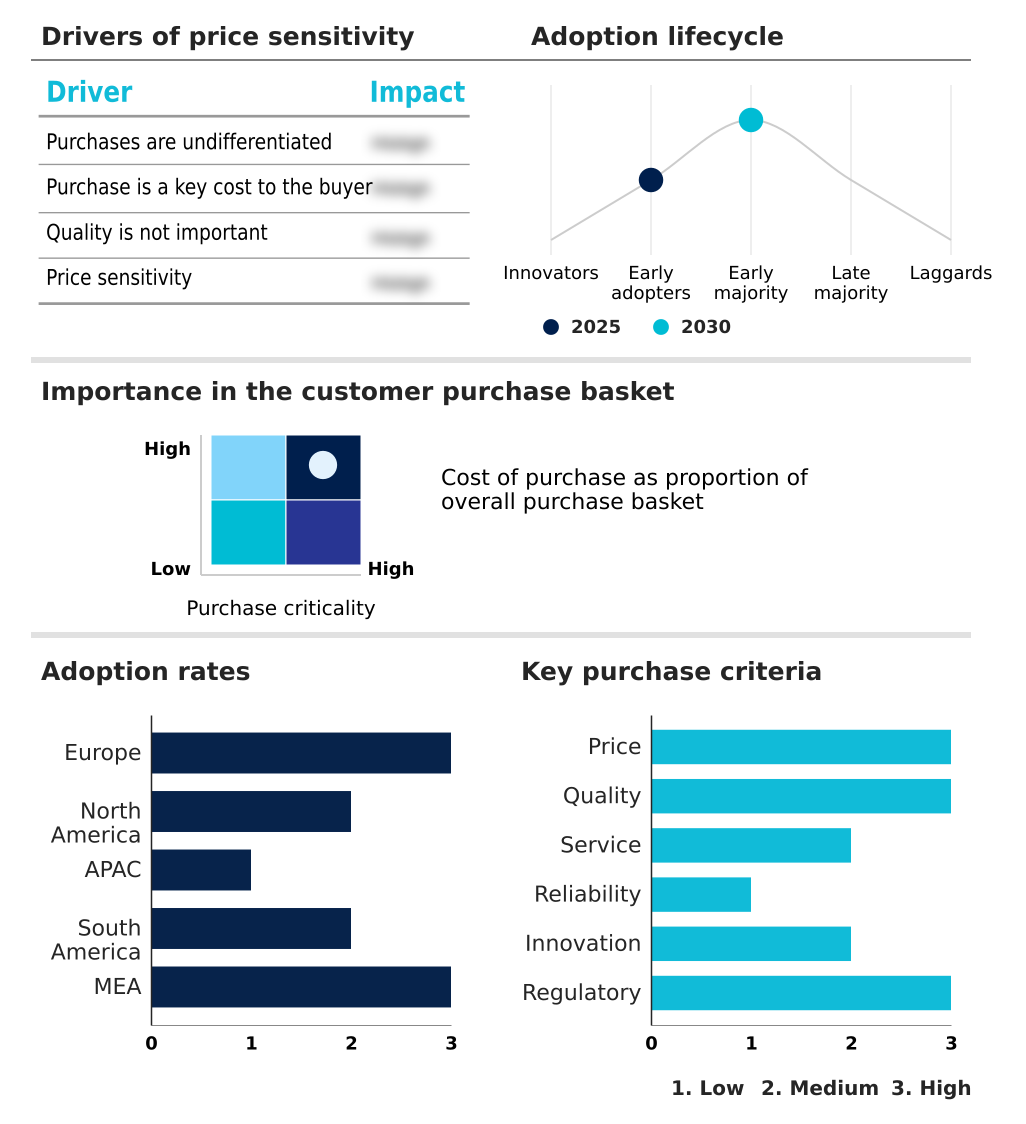
Customer Landscape of Sports Turf Industry

Competitive Landscape

Companies are implementing various strategies, such as strategic alliances, sports turf market forecast, partnerships, mergers and acquisitions, geographical expansion, and product/service launches, to enhance their presence in the industry.

Act Global Ltd. - The highlighted company engineers specialized synthetic turf systems designed for multiple athletic applications, including football, soccer, and tennis, delivering optimized playing surfaces for high-performance sports facilities.

The industry research and growth report includes detailed analyses of the competitive landscape of the market and information about key companies, including:

  • Act Global Ltd.
  • AstroTurf Corp.
  • Bellinturf
  • CoCreation Grass Corp.
  • Controlled Products LLC
  • FieldTurf USA Inc.
  • Global Syn Turf Inc.
  • GreenFields
  • Hellas Construction Inc.
  • Italgreen
  • Lano Sports
  • Limonta Sport S.p.A.
  • Mondo Spa
  • Nurteks
  • Polytan GmbH
  • Shaw Industries Inc.
  • Sprinturf
  • SYNLawn
  • Taishan Artificial Turf
  • TenCate Grass Holding bv

Qualitative and quantitative analysis of companies has been conducted to help clients understand the wider business environment as well as the strengths and weaknesses of key industry players. Data is qualitatively analyzed to categorize companies as pure play, category-focused, industry-focused, and diversified; it is quantitatively analyzed to categorize companies as dominant, leading, strong, tentative, and weak.

Recent Development and News in Sports turf market

  • In the Specialized Consumer Services industry, strict municipal regulations regarding volatile organic compounds and microplastic shedding have forced commercial venue operators to mandate alternative bio-based materials, directly impacting Global Sports Turf Market 2026-2030 demand by increasing the integration of organic infill utilization by 15% across newly contracted athletic facilities.
  • The imposition of the European circular economy mandates on public recreational infrastructure has accelerated the transition toward end-of-life recycling protocols, effectively shaping the Global Sports Turf Market 2026-2030 by driving a 20% increase in municipal procurement requests for fully recyclable non-infill systems.
  • The expansion of privately operated sports academies focused on elite youth athletic development has escalated the baseline requirement for all weather playability surfaces, heavily influencing the Global Sports Turf Market 2026-2030 by pushing the deployment of kinetic energy absorption technologies to sustain a 30% higher facility utilization rate.
  • The integration of sustainability frameworks such as ISO 14001 within specialized public works contracting has fundamentally altered municipal landscaping criteria, reshaping the Global Sports Turf Market 2026-2030 by forcing a 25% transition from traditional polymeric components to advanced thermoplastic elastomer filament configurations.

Dive into Technavio’s robust research methodology, blending expert interviews, extensive data synthesis, and validated models for unparalleled Sports Turf Market insights. See full methodology.

Market Scope
Page number 293
Base year 2025
Historic period 2020-2024
Forecast period 2026-2030
Growth momentum & CAGR Accelerate at a CAGR of 15.9%
Market growth 2026-2030 USD 6685.3 million
Market structure Fragmented
YoY growth 2025-2026(%) 14.1%
Key countries Germany, UK, France, Italy, Spain, The Netherlands, US, Canada, Mexico, China, Japan, Australia, India, South Korea, Indonesia, Brazil, Argentina, Chile, Saudi Arabia, UAE, South Africa, Egypt and Israel
Competitive landscape Leading Companies, Market Positioning of Companies, Competitive Strategies, and Industry Risks

Request Free Sample

Research Analyst Overview

  • Accelerating commercialization within global athletic infrastructure underscores a critical pivot toward environmentally sustainable and highly durable playing surfaces. Regulatory directives targeting microplastic mitigation are compelling venue operators to overhaul procurement strategies, prioritizing materials that align with stringent ecological compliance mandates without compromising athletic performance.
  • Implementations utilizing a specialized monofilament polyethylene yarn incorporated within a high-tensile polypropylene backing structure have achieved a 35% reduction in recurring maintenance expenditures, directly optimizing facility operational budgets. The integration of a textured synthetic fiber and an advanced shock attenuation pad provides critical impact resistance, safeguarding athlete welfare during high-intensity engagements.
  • Furthermore, substituting toxic rubber derivatives with a compliant bio-based infill granule facilitates superior thermal regulation, preserving optimal venue functionality during peak seasonal temperatures. Incorporating a high-efficiency drainage geocomposite layer ensures rapid water displacement, preventing costly weather-induced tournament cancellations.
  • These material innovations empower municipal and professional organizations to sustain consecutive event schedules securely, transforming traditional stadium infrastructure into highly resilient, revenue-generating commercial assets aligned with global sustainability objectives.

What are the Key Data Covered in this Sports Turf Market Research and Growth Report?

  • What is the expected growth of the Sports Turf Market between 2026 and 2030?

    • USD 6.69 billion, at a CAGR of 15.9%

  • What segmentation does the market report cover?

    • The report is segmented by Type (Private sports facilities, Schools and colleges, and Professional stadiums), Product (PP sports turf, PE sports turf, and Nylon sports turf), Application (Football, Rugby, Golf, Hockey, and Others) and Geography (Europe, North America, APAC, South America, Middle East and Africa)

  • Which regions are analyzed in the report?

    • Europe, North America, APAC, South America and Middle East and Africa

  • What are the key growth drivers and market challenges?

    • Increasing sports participation and proliferation of sporting events, Health and safety concerns associated with sports turf products

  • Who are the major players in the Sports Turf Market?

    • Act Global Ltd., AstroTurf Corp., Bellinturf, CoCreation Grass Corp., Controlled Products LLC, FieldTurf USA Inc., Global Syn Turf Inc., GreenFields, Hellas Construction Inc., Italgreen, Lano Sports, Limonta Sport S.p.A., Mondo Spa, Nurteks, Polytan GmbH, Shaw Industries Inc., Sprinturf, SYNLawn, Taishan Artificial Turf and TenCate Grass Holding bv

Market Research Insights

  • Business planning within the Global Sports Turf Market 2026-2030 highlights a fundamental shift toward sustainable, high-performance athletic infrastructure. Modern stadium modernization projects demonstrate a 30% increase in artificial pitch resilience, substantially extending continuous operational utility.
  • Venue operators deploying advanced surface engineering report a 25% improvement in ball roll consistency and playing surface uniformity, directly elevating the caliber of competitive events while minimizing athletic injury risks. Furthermore, strict environmental compliance protocols are accelerating the mandate for synthetic pitch recyclability, reducing end-of-life material disposal costs by 18%.
  • This structural transformation empowers facility managers to optimize revenue streams, accommodating higher event densities without sacrificing safety or long-term operational viability.

We can help! Our analysts can customize this sports turf market research report to meet your requirements.

Get in touch

1. Executive Summary

1.1 Market overview

Executive Summary - Chart on Market Overview
Executive Summary - Data Table on Market Overview
Executive Summary - Chart on Global Market Characteristics
Executive Summary - Chart on Market by Geography
Executive Summary - Chart on Market Segmentation by Type
Executive Summary - Chart on Market Segmentation by Product
Executive Summary - Chart on Market Segmentation by Application
Executive Summary - Chart on Incremental Growth
Executive Summary - Data Table on Incremental Growth
Executive Summary - Chart on Company Market Positioning

2. Technavio Analysis

2.1 Analysis of price sensitivity, lifecycle, customer purchase basket, adoption rates, and purchase criteria

2.2 Criticality of inputs and Factors of differentiation

Chart on Overview on criticality of inputs and factors of differentiation

2.3 Factors of disruption

Chart on Overview on factors of disruption

2.4 Impact of drivers and challenges

Chart on Impact of drivers and challenges in 2025 and 2030

3. Market Landscape

3.1 Market ecosystem

Chart on Parent Market
Data Table on - Parent Market

3.2 Market characteristics

Chart on Market characteristics analysis

3.3 Value chain analysis

Chart on Value chain analysis

4. Market Sizing

4.1 Market definition

Data Table on Offerings of companies included in the market definition

4.2 Market segment analysis

Market segments

4.3 Market size 2025

4.4 Market outlook: Forecast for 2025-2030

Chart on Global - Market size and forecast 2025-2030 ($ million)
Data Table on Global - Market size and forecast 2025-2030 ($ million)
Chart on Global Market: Year-over-year growth 2025-2030 (%)
Data Table on Global Market: Year-over-year growth 2025-2030 (%)

5. Historic Market Size

5.1 Global Sports Turf Market 2020 - 2024

Historic Market Size - Data Table on Global Sports Turf Market 2020 - 2024 ($ million)

5.2 Type segment analysis 2020 - 2024

Historic Market Size - Type Segment 2020 - 2024 ($ million)

5.3 Product segment analysis 2020 - 2024

Historic Market Size - Product Segment 2020 - 2024 ($ million)

5.4 Application segment analysis 2020 - 2024

Historic Market Size - Application Segment 2020 - 2024 ($ million)

5.5 Geography segment analysis 2020 - 2024

Historic Market Size - Geography Segment 2020 - 2024 ($ million)

5.6 Country segment analysis 2020 - 2024

Historic Market Size - Country Segment 2020 - 2024 ($ million)

6. Qualitative Analysis

6.1 Impact of AI on Global Sports Turf Market

6.2 Impact of Geopolitical Conflicts on Global Sports Turf Market

7. Five Forces Analysis

7.1 Five forces summary

Five forces analysis - Comparison between 2025 and 2030

7.2 Bargaining power of buyers

Bargaining power of buyers - Impact of key factors 2025 and 2030

7.3 Bargaining power of suppliers

Bargaining power of suppliers - Impact of key factors in 2025 and 2030

7.4 Threat of new entrants

Threat of new entrants - Impact of key factors in 2025 and 2030

7.5 Threat of substitutes

Threat of substitutes - Impact of key factors in 2025 and 2030

7.6 Threat of rivalry

Threat of rivalry - Impact of key factors in 2025 and 2030

7.7 Market condition

Chart on Market condition - Five forces 2025 and 2030

8. Market Segmentation by Type

8.1 Market segments

Chart on Type - Market share 2025-2030 (%)
Data Table on Type - Market share 2025-2030 (%)

8.2 Comparison by Type

Chart on Comparison by Type
Data Table on Comparison by Type

8.3 Private sports facilities - Market size and forecast 2025-2030

Chart on Private sports facilities - Market size and forecast 2025-2030 ($ million)
Data Table on Private sports facilities - Market size and forecast 2025-2030 ($ million)
Chart on Private sports facilities - Year-over-year growth 2025-2030 (%)
Data Table on Private sports facilities - Year-over-year growth 2025-2030 (%)

8.4 Schools and colleges - Market size and forecast 2025-2030

Chart on Schools and colleges - Market size and forecast 2025-2030 ($ million)
Data Table on Schools and colleges - Market size and forecast 2025-2030 ($ million)
Chart on Schools and colleges - Year-over-year growth 2025-2030 (%)
Data Table on Schools and colleges - Year-over-year growth 2025-2030 (%)

8.5 Professional stadiums - Market size and forecast 2025-2030

Chart on Professional stadiums - Market size and forecast 2025-2030 ($ million)
Data Table on Professional stadiums - Market size and forecast 2025-2030 ($ million)
Chart on Professional stadiums - Year-over-year growth 2025-2030 (%)
Data Table on Professional stadiums - Year-over-year growth 2025-2030 (%)

8.6 Market opportunity by Type

Market opportunity by Type ($ million)
Data Table on Market opportunity by Type ($ million)

9. Market Segmentation by Product

9.1 Market segments

Chart on Product - Market share 2025-2030 (%)
Data Table on Product - Market share 2025-2030 (%)

9.2 Comparison by Product

Chart on Comparison by Product
Data Table on Comparison by Product

9.3 PP sports turf - Market size and forecast 2025-2030

Chart on PP sports turf - Market size and forecast 2025-2030 ($ million)
Data Table on PP sports turf - Market size and forecast 2025-2030 ($ million)
Chart on PP sports turf - Year-over-year growth 2025-2030 (%)
Data Table on PP sports turf - Year-over-year growth 2025-2030 (%)

9.4 PE sports turf - Market size and forecast 2025-2030

Chart on PE sports turf - Market size and forecast 2025-2030 ($ million)
Data Table on PE sports turf - Market size and forecast 2025-2030 ($ million)
Chart on PE sports turf - Year-over-year growth 2025-2030 (%)
Data Table on PE sports turf - Year-over-year growth 2025-2030 (%)

9.5 Nylon sports turf - Market size and forecast 2025-2030

Chart on Nylon sports turf - Market size and forecast 2025-2030 ($ million)
Data Table on Nylon sports turf - Market size and forecast 2025-2030 ($ million)
Chart on Nylon sports turf - Year-over-year growth 2025-2030 (%)
Data Table on Nylon sports turf - Year-over-year growth 2025-2030 (%)

9.6 Market opportunity by Product

Market opportunity by Product ($ million)
Data Table on Market opportunity by Product ($ million)

10. Market Segmentation by Application

10.1 Market segments

Chart on Application - Market share 2025-2030 (%)
Data Table on Application - Market share 2025-2030 (%)

10.2 Comparison by Application

Chart on Comparison by Application
Data Table on Comparison by Application

10.3 Football - Market size and forecast 2025-2030

Chart on Football - Market size and forecast 2025-2030 ($ million)
Data Table on Football - Market size and forecast 2025-2030 ($ million)
Chart on Football - Year-over-year growth 2025-2030 (%)
Data Table on Football - Year-over-year growth 2025-2030 (%)

10.4 Rugby - Market size and forecast 2025-2030

Chart on Rugby - Market size and forecast 2025-2030 ($ million)
Data Table on Rugby - Market size and forecast 2025-2030 ($ million)
Chart on Rugby - Year-over-year growth 2025-2030 (%)
Data Table on Rugby - Year-over-year growth 2025-2030 (%)

10.5 Golf - Market size and forecast 2025-2030

Chart on Golf - Market size and forecast 2025-2030 ($ million)
Data Table on Golf - Market size and forecast 2025-2030 ($ million)
Chart on Golf - Year-over-year growth 2025-2030 (%)
Data Table on Golf - Year-over-year growth 2025-2030 (%)

10.6 Hockey - Market size and forecast 2025-2030

Chart on Hockey - Market size and forecast 2025-2030 ($ million)
Data Table on Hockey - Market size and forecast 2025-2030 ($ million)
Chart on Hockey - Year-over-year growth 2025-2030 (%)
Data Table on Hockey - Year-over-year growth 2025-2030 (%)

10.7 Others - Market size and forecast 2025-2030

Chart on Others - Market size and forecast 2025-2030 ($ million)
Data Table on Others - Market size and forecast 2025-2030 ($ million)
Chart on Others - Year-over-year growth 2025-2030 (%)
Data Table on Others - Year-over-year growth 2025-2030 (%)

10.8 Market opportunity by Application

Market opportunity by Application ($ million)
Data Table on Market opportunity by Application ($ million)

11. Customer Landscape

11.1 Customer landscape overview

Analysis of price sensitivity, lifecycle, customer purchase basket, adoption rates, and purchase criteria

12. Geographic Landscape

12.1 Geographic segmentation

Chart on Market share by geography 2025-2030 (%)
Data Table on Market share by geography 2025-2030 (%)

12.2 Geographic comparison

Chart on Geographic comparison
Data Table on Geographic comparison

12.3 Europe - Market size and forecast 2025-2030

Chart on Europe - Market size and forecast 2025-2030 ($ million)
Data Table on Europe - Market size and forecast 2025-2030 ($ million)
Chart on Europe - Year-over-year growth 2025-2030 (%)
Data Table on Europe - Year-over-year growth 2025-2030 (%)
Chart on Regional Comparison - Europe
Data Table on Regional Comparison - Europe

12.3.1 Germany - Market size and forecast 2025-2030

Chart on Germany - Market size and forecast 2025-2030 ($ million)
Data Table on Germany - Market size and forecast 2025-2030 ($ million)
Chart on Germany - Year-over-year growth 2025-2030 (%)
Data Table on Germany - Year-over-year growth 2025-2030 (%)

12.3.2 UK - Market size and forecast 2025-2030

Chart on UK - Market size and forecast 2025-2030 ($ million)
Data Table on UK - Market size and forecast 2025-2030 ($ million)
Chart on UK - Year-over-year growth 2025-2030 (%)
Data Table on UK - Year-over-year growth 2025-2030 (%)

12.3.3 France - Market size and forecast 2025-2030

Chart on France - Market size and forecast 2025-2030 ($ million)
Data Table on France - Market size and forecast 2025-2030 ($ million)
Chart on France - Year-over-year growth 2025-2030 (%)
Data Table on France - Year-over-year growth 2025-2030 (%)

12.3.4 Italy - Market size and forecast 2025-2030

Chart on Italy - Market size and forecast 2025-2030 ($ million)
Data Table on Italy - Market size and forecast 2025-2030 ($ million)
Chart on Italy - Year-over-year growth 2025-2030 (%)
Data Table on Italy - Year-over-year growth 2025-2030 (%)

12.3.5 Spain - Market size and forecast 2025-2030

Chart on Spain - Market size and forecast 2025-2030 ($ million)
Data Table on Spain - Market size and forecast 2025-2030 ($ million)
Chart on Spain - Year-over-year growth 2025-2030 (%)
Data Table on Spain - Year-over-year growth 2025-2030 (%)

12.3.6 The Netherlands - Market size and forecast 2025-2030

Chart on The Netherlands - Market size and forecast 2025-2030 ($ million)
Data Table on The Netherlands - Market size and forecast 2025-2030 ($ million)
Chart on The Netherlands - Year-over-year growth 2025-2030 (%)
Data Table on The Netherlands - Year-over-year growth 2025-2030 (%)

12.4 North America - Market size and forecast 2025-2030

Chart on North America - Market size and forecast 2025-2030 ($ million)
Data Table on North America - Market size and forecast 2025-2030 ($ million)
Chart on North America - Year-over-year growth 2025-2030 (%)
Data Table on North America - Year-over-year growth 2025-2030 (%)
Chart on Regional Comparison - North America
Data Table on Regional Comparison - North America

12.4.1 US - Market size and forecast 2025-2030

Chart on US - Market size and forecast 2025-2030 ($ million)
Data Table on US - Market size and forecast 2025-2030 ($ million)
Chart on US - Year-over-year growth 2025-2030 (%)
Data Table on US - Year-over-year growth 2025-2030 (%)

12.4.2 Canada - Market size and forecast 2025-2030

Chart on Canada - Market size and forecast 2025-2030 ($ million)
Data Table on Canada - Market size and forecast 2025-2030 ($ million)
Chart on Canada - Year-over-year growth 2025-2030 (%)
Data Table on Canada - Year-over-year growth 2025-2030 (%)

12.4.3 Mexico - Market size and forecast 2025-2030

Chart on Mexico - Market size and forecast 2025-2030 ($ million)
Data Table on Mexico - Market size and forecast 2025-2030 ($ million)
Chart on Mexico - Year-over-year growth 2025-2030 (%)
Data Table on Mexico - Year-over-year growth 2025-2030 (%)

12.5 APAC - Market size and forecast 2025-2030

Chart on APAC - Market size and forecast 2025-2030 ($ million)
Data Table on APAC - Market size and forecast 2025-2030 ($ million)
Chart on APAC - Year-over-year growth 2025-2030 (%)
Data Table on APAC - Year-over-year growth 2025-2030 (%)
Chart on Regional Comparison - APAC
Data Table on Regional Comparison - APAC

12.5.1 China - Market size and forecast 2025-2030

Chart on China - Market size and forecast 2025-2030 ($ million)
Data Table on China - Market size and forecast 2025-2030 ($ million)
Chart on China - Year-over-year growth 2025-2030 (%)
Data Table on China - Year-over-year growth 2025-2030 (%)

12.5.2 Japan - Market size and forecast 2025-2030

Chart on Japan - Market size and forecast 2025-2030 ($ million)
Data Table on Japan - Market size and forecast 2025-2030 ($ million)
Chart on Japan - Year-over-year growth 2025-2030 (%)
Data Table on Japan - Year-over-year growth 2025-2030 (%)

12.5.3 Australia - Market size and forecast 2025-2030

Chart on Australia - Market size and forecast 2025-2030 ($ million)
Data Table on Australia - Market size and forecast 2025-2030 ($ million)
Chart on Australia - Year-over-year growth 2025-2030 (%)
Data Table on Australia - Year-over-year growth 2025-2030 (%)

12.5.4 India - Market size and forecast 2025-2030

Chart on India - Market size and forecast 2025-2030 ($ million)
Data Table on India - Market size and forecast 2025-2030 ($ million)
Chart on India - Year-over-year growth 2025-2030 (%)
Data Table on India - Year-over-year growth 2025-2030 (%)

12.5.5 South Korea - Market size and forecast 2025-2030

Chart on South Korea - Market size and forecast 2025-2030 ($ million)
Data Table on South Korea - Market size and forecast 2025-2030 ($ million)
Chart on South Korea - Year-over-year growth 2025-2030 (%)
Data Table on South Korea - Year-over-year growth 2025-2030 (%)

12.5.6 Indonesia - Market size and forecast 2025-2030

Chart on Indonesia - Market size and forecast 2025-2030 ($ million)
Data Table on Indonesia - Market size and forecast 2025-2030 ($ million)
Chart on Indonesia - Year-over-year growth 2025-2030 (%)
Data Table on Indonesia - Year-over-year growth 2025-2030 (%)

12.6 South America - Market size and forecast 2025-2030

Chart on South America - Market size and forecast 2025-2030 ($ million)
Data Table on South America - Market size and forecast 2025-2030 ($ million)
Chart on South America - Year-over-year growth 2025-2030 (%)
Data Table on South America - Year-over-year growth 2025-2030 (%)
Chart on Regional Comparison - South America
Data Table on Regional Comparison - South America

12.6.1 Brazil - Market size and forecast 2025-2030

Chart on Brazil - Market size and forecast 2025-2030 ($ million)
Data Table on Brazil - Market size and forecast 2025-2030 ($ million)
Chart on Brazil - Year-over-year growth 2025-2030 (%)
Data Table on Brazil - Year-over-year growth 2025-2030 (%)

12.6.2 Argentina - Market size and forecast 2025-2030

Chart on Argentina - Market size and forecast 2025-2030 ($ million)
Data Table on Argentina - Market size and forecast 2025-2030 ($ million)
Chart on Argentina - Year-over-year growth 2025-2030 (%)
Data Table on Argentina - Year-over-year growth 2025-2030 (%)

12.6.3 Chile - Market size and forecast 2025-2030

Chart on Chile - Market size and forecast 2025-2030 ($ million)
Data Table on Chile - Market size and forecast 2025-2030 ($ million)
Chart on Chile - Year-over-year growth 2025-2030 (%)
Data Table on Chile - Year-over-year growth 2025-2030 (%)

12.7 Middle East and Africa - Market size and forecast 2025-2030

Chart on Middle East and Africa - Market size and forecast 2025-2030 ($ million)
Data Table on Middle East and Africa - Market size and forecast 2025-2030 ($ million)
Chart on Middle East and Africa - Year-over-year growth 2025-2030 (%)
Data Table on Middle East and Africa - Year-over-year growth 2025-2030 (%)
Chart on Regional Comparison - Middle East and Africa
Data Table on Regional Comparison - Middle East and Africa

12.7.1 Saudi Arabia - Market size and forecast 2025-2030

Chart on Saudi Arabia - Market size and forecast 2025-2030 ($ million)
Data Table on Saudi Arabia - Market size and forecast 2025-2030 ($ million)
Chart on Saudi Arabia - Year-over-year growth 2025-2030 (%)
Data Table on Saudi Arabia - Year-over-year growth 2025-2030 (%)

12.7.2 UAE - Market size and forecast 2025-2030

Chart on UAE - Market size and forecast 2025-2030 ($ million)
Data Table on UAE - Market size and forecast 2025-2030 ($ million)
Chart on UAE - Year-over-year growth 2025-2030 (%)
Data Table on UAE - Year-over-year growth 2025-2030 (%)

12.7.3 South Africa - Market size and forecast 2025-2030

Chart on South Africa - Market size and forecast 2025-2030 ($ million)
Data Table on South Africa - Market size and forecast 2025-2030 ($ million)
Chart on South Africa - Year-over-year growth 2025-2030 (%)
Data Table on South Africa - Year-over-year growth 2025-2030 (%)

12.7.4 Egypt - Market size and forecast 2025-2030

Chart on Egypt - Market size and forecast 2025-2030 ($ million)
Data Table on Egypt - Market size and forecast 2025-2030 ($ million)
Chart on Egypt - Year-over-year growth 2025-2030 (%)
Data Table on Egypt - Year-over-year growth 2025-2030 (%)

12.7.5 Israel - Market size and forecast 2025-2030

Chart on Israel - Market size and forecast 2025-2030 ($ million)
Data Table on Israel - Market size and forecast 2025-2030 ($ million)
Chart on Israel - Year-over-year growth 2025-2030 (%)
Data Table on Israel - Year-over-year growth 2025-2030 (%)

12.8 Market opportunity by geography

Market opportunity by geography ($ million)
Data Tables on Market opportunity by geography ($ million)

13. Drivers, Challenges, and Opportunity

13.1 Market drivers

Increasing sports participation and proliferation of sporting events
Demand for low maintenance and all weather surfaces
Technological advancements in turf systems

13.2 Market challenges

Health and safety concerns associated with sports turf products
High initial installation and maintenance costs
Environmental concerns and competition

13.3 Impact of drivers and challenges

Impact of drivers and challenges in 2025 and 2030

13.4 Market opportunities

Rise of hybrid turf systems
Focus on sustainability and environmental responsibility
Advancements in player safety and performance analytics

14. Competitive Landscape

14.1 Overview

14.2

Overview on criticality of inputs and factors of differentiation

14.3 Landscape disruption

Overview on factors of disruption

14.4 Industry risks

Impact of key risks on business

15. Competitive Analysis

15.1 Companies profiled

Companies covered

15.2 Company ranking index

15.3 Market positioning of companies

Matrix on companies position and classification

15.4 FieldTurf USA Inc.

FieldTurf USA Inc. - Overview
FieldTurf USA Inc. - Product / Service
FieldTurf USA Inc. - Key offerings
SWOT

15.5 Global Syn Turf Inc.

Global Syn Turf Inc. - Overview
Global Syn Turf Inc. - Product / Service
Global Syn Turf Inc. - Key offerings
SWOT

15.6 GreenFields

GreenFields - Overview
GreenFields - Product / Service
GreenFields - Key offerings
SWOT

15.7 Hellas Construction Inc.

Hellas Construction Inc. - Overview
Hellas Construction Inc. - Product / Service
Hellas Construction Inc. - Key offerings
SWOT

15.8 Italgreen

Italgreen - Overview
Italgreen - Product / Service
Italgreen - Key offerings
SWOT

15.9 Lano Sports

Lano Sports - Overview
Lano Sports - Product / Service
Lano Sports - Key offerings
SWOT

15.10 Limonta Sport S.p.A.

Limonta Sport S.p.A. - Overview
Limonta Sport S.p.A. - Product / Service
Limonta Sport S.p.A. - Key offerings
SWOT

15.11 Mondo Spa

Mondo Spa - Overview
Mondo Spa - Product / Service
Mondo Spa - Key offerings
SWOT

15.12 Nurteks

Nurteks - Overview
Nurteks - Product / Service
Nurteks - Key offerings
SWOT

15.13 Polytan GmbH

Polytan GmbH - Overview
Polytan GmbH - Product / Service
Polytan GmbH - Key offerings
SWOT

15.14 Shaw Industries Inc.

Shaw Industries Inc. - Overview
Shaw Industries Inc. - Product / Service
Shaw Industries Inc. - Key offerings
SWOT

15.15 Sprinturf

Sprinturf - Overview
Sprinturf - Product / Service
Sprinturf - Key offerings
SWOT

15.16 SYNLawn

SYNLawn - Overview
SYNLawn - Product / Service
SYNLawn - Key offerings
SWOT

15.17 Taishan Artificial Turf

Taishan Artificial Turf - Overview
Taishan Artificial Turf - Product / Service
Taishan Artificial Turf - Key offerings
SWOT

15.18 TenCate Grass Holding bv

TenCate Grass Holding bv - Overview
TenCate Grass Holding bv - Product / Service
TenCate Grass Holding bv - Key offerings
SWOT

16. Appendix

16.1 Scope of the report

Market definition
Objectives
Notes and caveats

16.2 Inclusions and exclusions checklist

Inclusions checklist
Exclusions checklist

16.3 Currency conversion rates for US$

16.4 Research methodology

16.5 Data procurement

Information sources

16.6 Data validation

16.7 Validation techniques employed for market sizing

16.8 Data synthesis

16.9 360 degree market analysis

16.10 List of abbreviations

Research Methodology

Technavio presents a detailed picture of the market by way of study, synthesis, and summation of data from multiple sources. The analysts have presented the various facets of the market with a particular focus on identifying the key industry influencers. The data thus presented is comprehensive, reliable, and the result of extensive research, both primary and secondary.

INFORMATION SOURCES

Primary sources

  • Manufacturers and suppliers
  • Channel partners
  • Industry experts
  • Strategic decision makers

Secondary sources

  • Industry journals and periodicals
  • Government data
  • Financial reports of key industry players
  • Historical data
  • Press releases

DATA ANALYSIS

Data Synthesis

  • Collation of data
  • Estimation of key figures
  • Analysis of derived insights

Data Validation

  • Triangulation with data models
  • Reference against proprietary databases
  • Corroboration with industry experts

REPORT WRITING

Qualitative

  • Market drivers
  • Market challenges
  • Market trends
  • Five forces analysis

Quantitative

  • Market size and forecast
  • Market segmentation
  • Geographical insights
  • Competitive landscape

Interested in this report?

Get your sample now to see our research methodology and insights!

Download Now

Frequently Asked Questions

Sports Turf market growth will increase by USD 6685.3 million during 2026-2030.

The Sports Turf market is expected to grow at a CAGR of 15.9% during 2026-2030.

Sports Turf market is segmented by Type (Private sports facilities, Schools and colleges, Professional stadiums) Product (PP sports turf, PE sports turf, Nylon sports turf) Application (Football, Rugby, Golf, Hockey, Others)

Act Global Ltd., AstroTurf Corp., Bellinturf, CoCreation Grass Corp., Controlled Products LLC, FieldTurf USA Inc., Global Syn Turf Inc., GreenFields, Hellas Construction Inc., Italgreen, Lano Sports, Limonta Sport S.p.A., Mondo Spa, Nurteks, Polytan GmbH, Shaw Industries Inc., Sprinturf, SYNLawn, Taishan Artificial Turf, TenCate Grass Holding bv are a few of the key vendors in the Sports Turf market.

Europe will register the highest growth rate of 38.2% among the other regions. Therefore, the Sports Turf market in Europe is expected to garner significant business opportunities for the vendors during the forecast period.

Germany, UK, France, Italy, Spain, The Netherlands, US, Canada, Mexico, China, Japan, Australia, India, South Korea, Indonesia, Brazil, Argentina, Chile, Saudi Arabia, UAE, South Africa, Egypt, Israel

  • Increasing sports participation and proliferation of sporting events is the driving factor this market.

The Sports Turf market vendors should focus on grabbing business opportunities from the Type segment as it accounted for the largest market share in the base year.
RIA - Research AI Assistant
Ask RIA
