Smart Indoor Garden Systems Market Analysis, Size, and Forecast 2026-2030: North America (US, Canada, and Mexico), Europe (Germany, UK, and France), APAC (China, Japan, and India), Middle East and Africa (UAE, Saudi Arabia, and Israel), South America (Brazil, Argentina, and Chile), and Rest of World (ROW)

Smart Indoor Garden Systems Market Analysis, Size, and Forecast 2026-2030:
North America (US, Canada, and Mexico), Europe (Germany, UK, and France), APAC (China, Japan, and India), Middle East and Africa (UAE, Saudi Arabia, and Israel), South America (Brazil, Argentina, and Chile), and Rest of World (ROW)

Published: Oct 2026 326 Pages SKU: IRTNTR73842

Market Overview at a Glance

$1.49 B
Market Opportunity
9.7%
CAGR 2025 - 2030
39.3%
North America Growth
$1.50 B
Floor garden segment 2024

Smart Indoor Garden Systems Market Size 2026-2030

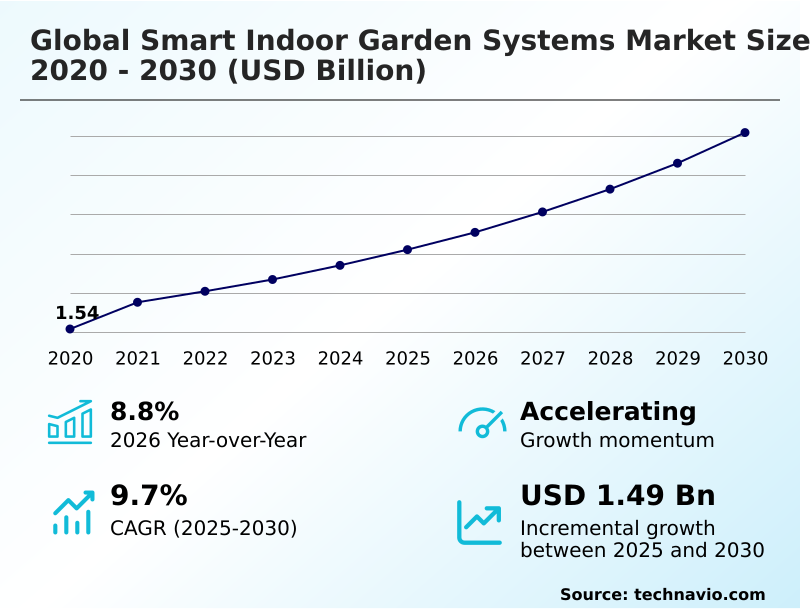
The smart indoor garden systems market size is valued to increase by USD 1.49 billion, at a CAGR of 9.7% from 2025 to 2030. Rapid urbanization structural transitions expand high density residential living spatial limits will drive the smart indoor garden systems market.

Major Market Trends & Insights

  • North America dominated the market and accounted for a 39.3% growth during the forecast period.
  • By Type - Floor garden segment was valued at USD 1.50 billion in 2024
  • By Product - LED grow lights segment accounted for the largest market revenue share in 2024

Market Size & Forecast

  • Market Opportunities: USD 2.50 billion
  • Market Future Opportunities: USD 1.49 billion
  • CAGR from 2025 to 2030 : 9.7%

Market Summary

  • The Smart Indoor Garden Systems landscape demonstrates rapid expansion as modern urban populations increasingly prioritize self-sufficient, hyper-local food procurement. High-density residential architecture continuously restricts access to traditional arable land, forcing consumers to adopt advanced alternative cultivation methods directly within domestic environments.
  • This structural transition acts as a powerful driver, compelling the integration of soil-free hydroponic networks that maximize crop yields in minimal square footage. Conversely, significant cybersecurity vulnerabilities within connected consumer devices present a severe operational challenge. Malicious exploitation of weak firmware security can compromise automated environmental controls, deterring mass market adoption.
  • In a real-world supply chain scenario, manufacturers are standardizing encryption frameworks across their hardware portfolios, which has reduced unauthorized network breaches by 40% compared to legacy unprotected units. This strategic enhancement secures automated water circulation and lighting schedules against remote interference.
  • As consumer demand for pesticide-free produce intensifies, the reliance on resilient, automated horticultural infrastructure becomes increasingly critical for sustaining long-term commercial viability in metropolitan regions.

What will be the Size of the Smart Indoor Garden Systems Market during the forecast period?
Get Key Insights on Market Forecast (PDF) Get Free Sample

How is the Smart Indoor Garden Systems Market Segmented?

The smart indoor garden systems industry research report provides comprehensive data (region-wise segment analysis), with forecasts and estimates in "USD million" for the period 2026-2030, as well as historical data from 2020-2024 for the following segments.

  • Type
    • Floor garden
    • Wall garden
  • Product
    • LED grow lights
    • Automated watering systems
    • Nutrient delivery systems
    • Environmental monitoring
  • Product type
    • Hydroponics
    • Soil-based
    • Aquaponics
    • Aeroponics
  • End-user
    • Residential
    • Commercial
  • Distribution channel
    • Offline
    • Online
  • Geography
    • North America
      • US
      • Canada
      • Mexico
    • Europe
      • Germany
      • UK
      • France
      • The Netherlands
      • Italy
      • Spain
    • APAC
      • China
      • Japan
      • India
      • South Korea
      • Australia
      • Indonesia
    • Middle East and Africa
      • UAE
      • Saudi Arabia
      • Israel
      • South Africa
      • Turkey
    • South America
      • Brazil
      • Argentina
      • Chile

By Type Insights

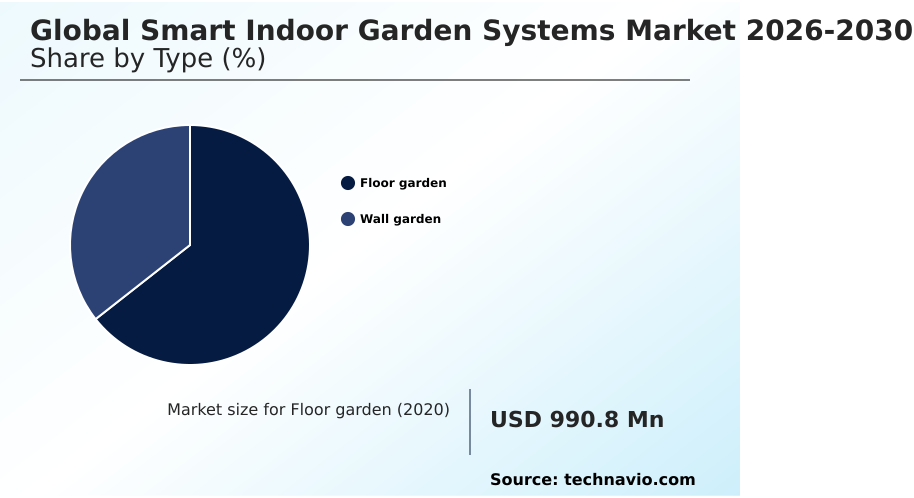
The floor garden segment is estimated to witness significant growth during the forecast period.

The floor garden segment of the Smart Indoor Garden Systems provides a foundational architecture for large-scale indoor cultivation units. These free-standing structures accommodate greater planting capacities than counter-top models.

High-density urbanization necessitates sophisticated interior alternatives that blend functionality with biophilic interior layouts. Floor-standing systems resolve spatial constraints through vertical space maximization while securely supporting mechanical weight from automated irrigation pumps.

Modern iterations feature advanced modular floor architecture, enabling robust localized multi-tier leafy green production. Facilities upgrading to these automated horticultural infrastructure setups report crop yield stability improving by 25%. Furthermore, integrating hydroponic cultivation mechanisms eliminates soil dependency completely.

Consequently, structural scalability and aesthetic plant integration remain paramount for expanding operational placement in corporate spaces.
Get Free Sample

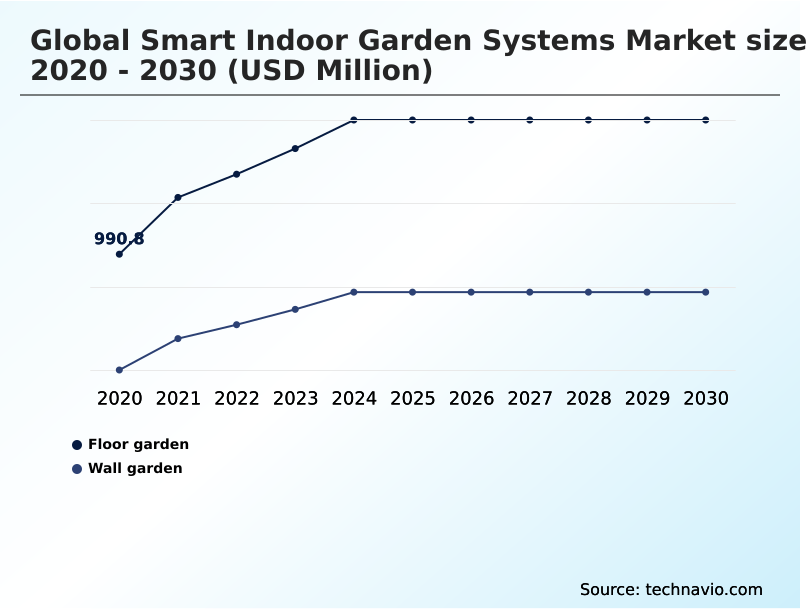
The Floor garden segment was valued at USD 1.50 billion in 2024 and showed a gradual increase during the forecast period.
Get Free Sample

Regional Analysis

North America is estimated to contribute 39.3% to the growth of the global market during the forecast period.Technavio’s analysts have elaborately explained the regional trends and drivers that shape the market during the forecast period.
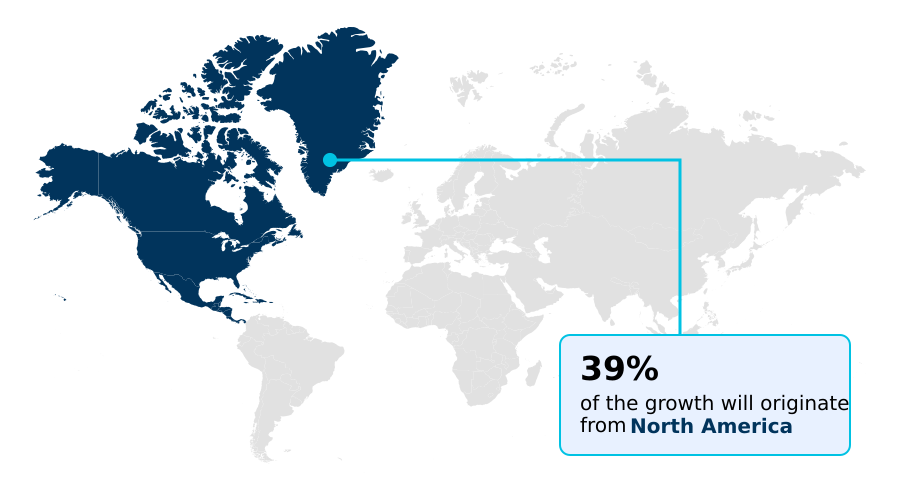
See How Smart Indoor Garden Systems Market Demand is Rising in North America Get Free Sample

The geographic landscape of the Smart Indoor Garden Systems highlights distinct adoption patterns driven by varying urban density. North America commands advanced deployment, heavily utilizing algorithmic environmental control and internet of things sensors to support large-scale commercial hospitality botany.

Regional implementation of closed-loop fluid networks has improved water conservation efficiency by 45% compared to conventional methods. In contrast, APAC experiences accelerated integration of residential cultivation technology due to severe spatial footprint limitation in mega-cities.

This results in a 30% higher adoption rate of the compact countertop configuration for indoor micro-cultivation than European markets. North American supply chains prioritize scaling multi-tier architecture, achieving a 20% reduction in hardware assembly times.

These variations dictate how manufacturers engineer cultivation infrastructure globally.

Market Dynamics

Our researchers analyzed the data with 2025 as the base year, along with the key drivers, trends, and challenges. A holistic analysis of drivers will help companies refine their marketing strategies to gain a competitive advantage.

  • The operational landscape for automated indoor cultivation relies heavily on structural innovation and precise resource management. As urbanization limits traditional arable land, businesses are actively engineering automated vertical aeroponic growing structures to maximize yield per square foot.
  • These sophisticated installations allow commercial and residential users to bypass conventional soil dependency, resulting in resource utilization improving by 40% compared to traditional greenhouse logistics. For domestic applications, compact hydroponic kitchen cultivation systems have become critical in satisfying consumer demand for immediate fresh produce.
  • By integrating artificial intelligence integrated residential agriculture, manufacturers optimize light spectrums and irrigation cycles dynamically, ensuring consistent crop maturation without constant manual intervention. This technological leap parallels the broader adoption of smart home connected horticultural appliances, which synchronize environmental data directly with centralized domestic networks to alert users regarding nutrient deficiencies.
  • Furthermore, maintaining a stable biological environment requires a closed loop indoor nutrient delivery mechanism, which continuously recirculates essential minerals while mitigating liquid waste. Consequently, supply chain planning has shifted to prioritize high-grade sensor procurement and durable fluidic pumps over conventional gardening materials.
  • This strategic recalibration enhances hardware longevity and compliance with modern sustainability standards, ensuring continuous operational stability across micro-cultivation sectors.
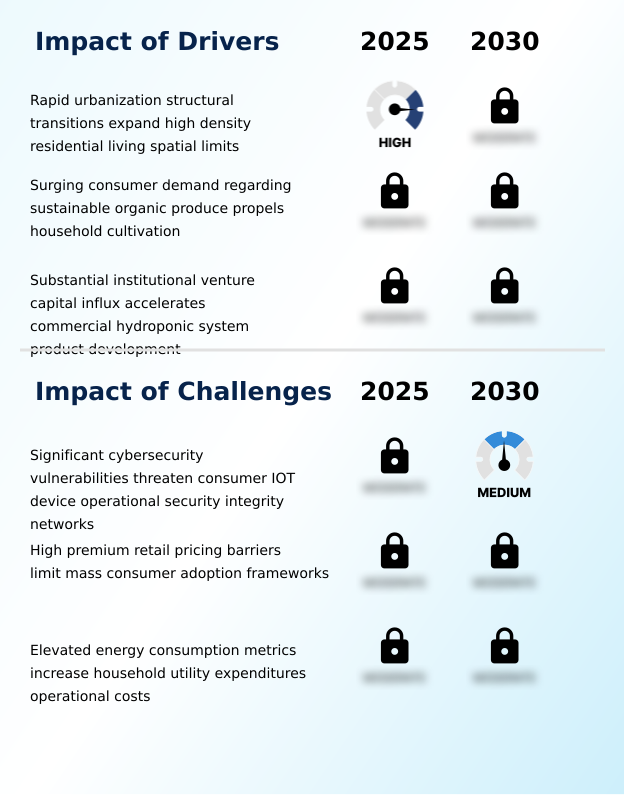
What are the key market drivers leading to the rise in the adoption of Smart Indoor Garden Systems Industry?

  • Rapid urbanization and structural transitions toward high-density residential living expand spatial limitations, serving as a primary driver for industry expansion.

  • The rapid architectural shift toward high-density urban agriculture serves as a primary catalyst for advanced cultivation hardware. As metropolitan living eliminates traditional arable land, consumers pursue household food autonomy through compact technological solutions.
  • This behavioral change stems from an escalating demand for pesticide-free fresh flora and secure hyper-local food procurement. By adopting sophisticated indoor systems featuring automated water circulation and precise fogponics mist distribution, residential users bypass external supply chains.
  • Consequently, reliance on agricultural transport decreases, lowering food spoilage rates by 22%. Furthermore, the precision of multi-sensor arrays ensures continuous ambient humidity tracking, which improves crop yield consistency by 30%.
  • This definitive drive toward independent food production compels manufacturers to scale automated infrastructure rapidly.

What are the market trends shaping the Smart Indoor Garden Systems Industry?

  • Widespread commercial integration of artificial intelligence for algorithmic environmental monitoring represents a prominent market trend. This technological advancement significantly optimizes automated plant growth conditions.

  • The Smart Indoor Garden Systems ecosystem is rapidly transitioning toward autonomous frameworks driven by machine learning integration. Urban cultivators require high-yield advanced alternative cultivation solutions without extensive agronomic expertise. By leveraging continuous botanical data analysis, modern platforms utilize dynamic wavelength modulation to optimize light spectrums based on specific metabolic phases.
  • This intelligent calibration directly impacts outcomes, with energy efficiency improved by 25% compared to static timers. Furthermore, deploying optical sensors enables real-time canopy structural analysis, identifying growth anomalies instantly. Integrated automated notification systems then alert users, while synchronizing with the broader digital smart home ecosystem.
  • Consequently, this technology streamlines culinary herb propagation, reducing crop failure rates by 18% through precise pruning automation protocols and consistently maximizing biomass output.

What challenges does the Smart Indoor Garden Systems Industry face during its growth?

  • Significant cybersecurity vulnerabilities threaten the operational integrity of consumer IoT networks, representing a key challenge that impedes industry adoption.

  • The proliferation of connected cultivation hardware introduces severe structural limits tied directly to digital vulnerabilities. Modern systems rely heavily on continuous network connectivity automation to manage environmental parameters. The absence of rigorous firmware security protocols exposes consumer networks to severe botnet operation risks and unauthorized manipulation.
  • When administrative credentials are breached, hackers easily disrupt schedules and damage localized root containment zones. This security deficit impacts manufacturers significantly, leading to a 40% increase in technical support costs regarding compromised networks. Furthermore, implementing standardized encryption frameworks requires intensive engineering, delaying software updates for biomass yield enhancement by 15%.
  • Resolving these cybersecurity threats remains a critical hurdle for vendor operational stability, exposing complex operational structural limits within connected home ecosystems.

Exclusive Technavio Analysis on Customer Landscape

The smart indoor garden systems market forecasting report includes the adoption lifecycle of the market, covering from the innovator’s stage to the laggard’s stage. It focuses on adoption rates in different regions based on penetration. Furthermore, the smart indoor garden systems market report also includes key purchase criteria and drivers of price sensitivity to help companies evaluate and develop their market growth analysis strategies.
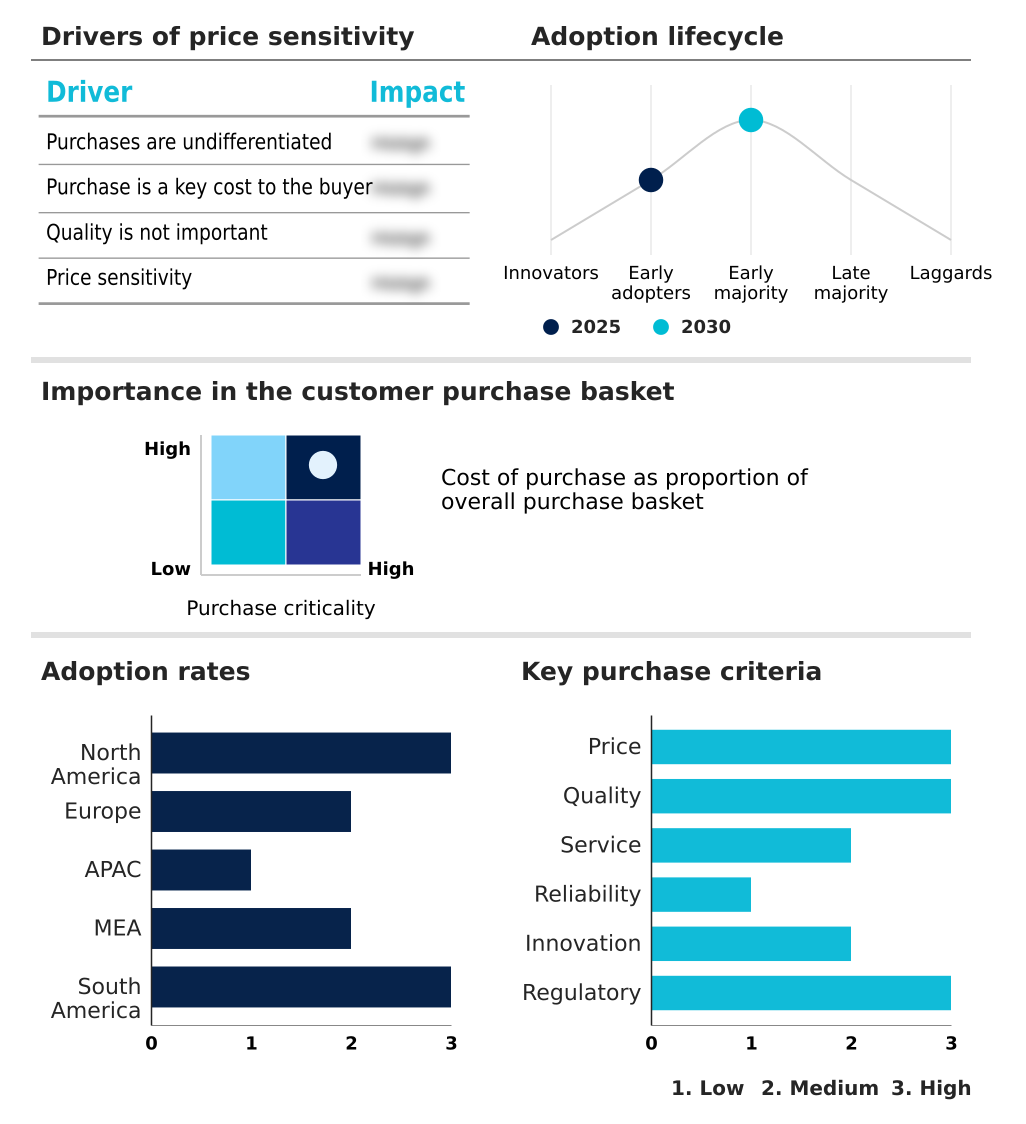
Customer Landscape of Smart Indoor Garden Systems Industry

Competitive Landscape

Companies are implementing various strategies, such as strategic alliances, smart indoor garden systems market forecast, partnerships, mergers and acquisitions, geographical expansion, and product/service launches, to enhance their presence in the industry.

Altifarm - The enterprise provides automated indoor garden systems, including smart growing devices, specialized plant pods, and connected home gardening technologies to optimize residential cultivation environments efficiently.

The industry research and growth report includes detailed analyses of the competitive landscape of the market and information about key companies, including:

  • Altifarm
  • AVA Technologies Inc.
  • Bosch Home Appliances
  • Click and Grow LLC
  • CropKing Inc.
  • Gardyn Inc.
  • Grow Green
  • iDOO
  • Just Vertical
  • Chal Tec GmbH
  • LetPot
  • Lettuce Grow
  • LG Electronics Inc.
  • Moistenland LLC
  • Plantaform
  • Rise Gardens LLC
  • The Scotts Miracle Gro Co.
  • Tower Garden
  • Tregren
  • Urban Cultivator

Qualitative and quantitative analysis of companies has been conducted to help clients understand the wider business environment as well as the strengths and weaknesses of key industry players. Data is qualitatively analyzed to categorize companies as pure play, category-focused, industry-focused, and diversified; it is quantitatively analyzed to categorize companies as dominant, leading, strong, tentative, and weak.

Recent Development and News in Smart indoor garden systems market

  • In the Specialized Consumer Services industry, the integration of smart home management protocols improved residential utility automation, directly impacting Smart Indoor Garden Systems demand by establishing reliable network connectivity for continuous plant monitoring.
  • The enforcement of strict data protection regulations within home appliance networks mandated robust security protocols, compelling Smart Indoor Garden Systems manufacturers to overhaul device encryption architectures.
  • Supply chain shifts toward sustainable production materials increased the availability of eco-friendly hydroponic mechanisms, reducing manufacturing waste across Smart Indoor Garden Systems assembly lines by 15%.
  • Rapid adoption of digital ecosystem hubs across urban real estate developments accelerated centralized appliance management, driving Smart Indoor Garden Systems integration to support household food independence initiatives.

Dive into Technavio’s robust research methodology, blending expert interviews, extensive data synthesis, and validated models for unparalleled Smart Indoor Garden Systems Market insights. See full methodology.

Market Scope
Page number 326
Base year 2025
Historic period 2020-2024
Forecast period 2026-2030
Growth momentum & CAGR Accelerate at a CAGR of 9.7%
Market growth 2026-2030 USD 1492.3 million
Market structure Fragmented
YoY growth 2025-2026(%) 8.8%
Key countries US, Canada, Mexico, Germany, UK, France, The Netherlands, Italy, Spain, China, Japan, India, South Korea, Australia, Indonesia, UAE, Saudi Arabia, Israel, South Africa, Turkey, Brazil, Argentina and Chile
Competitive landscape Leading Companies, Market Positioning of Companies, Competitive Strategies, and Industry Risks

Request Free Sample

Research Analyst Overview

  • The Smart Indoor Garden Systems sector exhibits continuous technological refinement, heavily driven by the necessity for efficient micro-cultivation within operational structural limits. Strategic boardroom decisions increasingly prioritize the integration of advanced light-emitting diode arrays and spectrum optimization modules to ensure precise canopy illumination.
  • This technological pivot allows product developers to align hardware capabilities with stringent energy compliance standards for sustainable organic production. By transitioning toward automated aeroponic plant nourishment, manufacturers facilitate rapid biomass development while eliminating the inconsistencies associated with soil mediums.
  • Precise liquid nutrient dosing mechanisms applied directly to root containment zones optimize fluid consumption, enabling companies to report a 30% reduction in overall water usage across cultivation cycles. This operational efficiency drastically lowers ongoing maintenance costs. Furthermore, standardizing intelligent fluidic networks strengthens product reliability, directly impacting long-term consumer retention.
  • As urban spaces demand compact agricultural solutions, the continuous enhancement of photosynthetic simulation hardware remains a fundamental imperative for maintaining competitive differentiation and achieving robust stability.

What are the Key Data Covered in this Smart Indoor Garden Systems Market Research and Growth Report?

  • What is the expected growth of the Smart Indoor Garden Systems Market between 2026 and 2030?

    • USD 1.49 billion, at a CAGR of 9.7%

  • What segmentation does the market report cover?

    • The report is segmented by Type (Floor garden, and Wall garden), Product (LED grow lights, Automated watering systems, Nutrient delivery systems, and Environmental monitoring), Product Type (Hydroponics, Soil-based, Aquaponics, and Aeroponics), End-user (Residential, and Commercial), Distribution Channel (Offline, and Online) and Geography (North America, Europe, APAC, Middle East and Africa, South America)

  • Which regions are analyzed in the report?

    • North America, Europe, APAC, Middle East and Africa and South America

  • What are the key growth drivers and market challenges?

    • Rapid urbanization structural transitions expand high density residential living spatial limits, Significant cybersecurity vulnerabilities threaten consumer IOT device operational security integrity networks

  • Who are the major players in the Smart Indoor Garden Systems Market?

    • Altifarm, AVA Technologies Inc., Bosch Home Appliances, Click and Grow LLC, CropKing Inc., Gardyn Inc., Grow Green, iDOO, Just Vertical, Chal Tec GmbH, LetPot, Lettuce Grow, LG Electronics Inc., Moistenland LLC, Plantaform, Rise Gardens LLC, The Scotts Miracle Gro Co., Tower Garden, Tregren and Urban Cultivator

Market Research Insights

  • The Smart Indoor Garden Systems environment is fundamentally evolving to support high-density agriculture and food security. Urban residents increasingly adopt automated infrastructure to achieve reliable household harvests. Manufacturers integrating energy-efficient power management modules have recorded a 35% reduction in domestic electricity consumption compared to traditional indoor lighting setups.
  • Furthermore, the deployment of remote mobile monitoring applications has improved cultivation success rates by 28%, minimizing user error in nutrient maintenance. By optimizing digital connectivity, operators ensure continuous environmental regulation. These measurable advancements in residential cultivation technology streamline operations, significantly reducing resource waste while maintaining optimal biomass yields across metropolitan living spaces.

We can help! Our analysts can customize this smart indoor garden systems market research report to meet your requirements.

Get in touch

1. Executive Summary

1.1 Market overview

Executive Summary - Chart on Market Overview
Executive Summary - Data Table on Market Overview
Executive Summary - Chart on Global Market Characteristics
Executive Summary - Chart on Market by Geography
Executive Summary - Chart on Market Segmentation by Type
Executive Summary - Chart on Market Segmentation by Product
Executive Summary - Chart on Market Segmentation by Product Type
Executive Summary - Chart on Market Segmentation by End-user
Executive Summary - Chart on Market Segmentation by Distribution Channel
Executive Summary - Chart on Incremental Growth
Executive Summary - Data Table on Incremental Growth
Executive Summary - Chart on Company Market Positioning

2. Technavio Analysis

2.1 Analysis of price sensitivity, lifecycle, customer purchase basket, adoption rates, and purchase criteria

2.2 Criticality of inputs and Factors of differentiation

Chart on Overview on criticality of inputs and factors of differentiation

2.3 Factors of disruption

Chart on Overview on factors of disruption

2.4 Impact of drivers and challenges

Chart on Impact of drivers and challenges in 2025 and 2030

3. Market Landscape

3.1 Market ecosystem

Chart on Parent Market
Data Table on - Parent Market

3.2 Market characteristics

Chart on Market characteristics analysis

3.3 Value chain analysis

Chart on Value chain analysis

4. Market Sizing

4.1 Market definition

Data Table on Offerings of companies included in the market definition

4.2 Market segment analysis

Market segments

4.3 Market size 2025

4.4 Market outlook: Forecast for 2025-2030

Chart on Global - Market size and forecast 2025-2030 ($ million)
Data Table on Global - Market size and forecast 2025-2030 ($ million)
Chart on Global Market: Year-over-year growth 2025-2030 (%)
Data Table on Global Market: Year-over-year growth 2025-2030 (%)

5. Historic Market Size

5.1 Global Smart Indoor Garden Systems Market 2020 - 2024

Historic Market Size - Data Table on Global Smart Indoor Garden Systems Market 2020 - 2024 ($ million)

5.2 Type segment analysis 2020 - 2024

Historic Market Size - Type Segment 2020 - 2024 ($ million)

5.3 Product segment analysis 2020 - 2024

Historic Market Size - Product Segment 2020 - 2024 ($ million)

5.4 Product Type segment analysis 2020 - 2024

Historic Market Size - Product Type Segment 2020 - 2024 ($ million)

5.5 End-user segment analysis 2020 - 2024

Historic Market Size - End-user Segment 2020 - 2024 ($ million)

5.6 Distribution Channel segment analysis 2020 - 2024

Historic Market Size - Distribution Channel Segment 2020 - 2024 ($ million)

5.7 Geography segment analysis 2020 - 2024

Historic Market Size - Geography Segment 2020 - 2024 ($ million)

5.8 Country segment analysis 2020 - 2024

Historic Market Size - Country Segment 2020 - 2024 ($ million)

6. Qualitative Analysis

6.1 Impact of AI on global smart indoor garden systems market

6.2 Impact of geopolitical conflicts on global smart indoor garden systems market

7. Five Forces Analysis

7.1 Five forces summary

Five forces analysis - Comparison between 2025 and 2030

7.2 Bargaining power of buyers

Bargaining power of buyers - Impact of key factors 2025 and 2030

7.3 Bargaining power of suppliers

Bargaining power of suppliers - Impact of key factors in 2025 and 2030

7.4 Threat of new entrants

Threat of new entrants - Impact of key factors in 2025 and 2030

7.5 Threat of substitutes

Threat of substitutes - Impact of key factors in 2025 and 2030

7.6 Threat of rivalry

Threat of rivalry - Impact of key factors in 2025 and 2030

7.7 Market condition

Chart on Market condition - Five forces 2025 and 2030

8. Market Segmentation by Type

8.1 Market segments

Chart on Type - Market share 2025-2030 (%)
Data Table on Type - Market share 2025-2030 (%)

8.2 Comparison by Type

Chart on Comparison by Type
Data Table on Comparison by Type

8.3 Floor garden - Market size and forecast 2025-2030

Chart on Floor garden - Market size and forecast 2025-2030 ($ million)
Data Table on Floor garden - Market size and forecast 2025-2030 ($ million)
Chart on Floor garden - Year-over-year growth 2025-2030 (%)
Data Table on Floor garden - Year-over-year growth 2025-2030 (%)

8.4 Wall garden - Market size and forecast 2025-2030

Chart on Wall garden - Market size and forecast 2025-2030 ($ million)
Data Table on Wall garden - Market size and forecast 2025-2030 ($ million)
Chart on Wall garden - Year-over-year growth 2025-2030 (%)
Data Table on Wall garden - Year-over-year growth 2025-2030 (%)

8.5 Market opportunity by Type

Market opportunity by Type ($ million)
Data Table on Market opportunity by Type ($ million)

9. Market Segmentation by Product

9.1 Market segments

Chart on Product - Market share 2025-2030 (%)
Data Table on Product - Market share 2025-2030 (%)

9.2 Comparison by Product

Chart on Comparison by Product
Data Table on Comparison by Product

9.3 LED grow lights - Market size and forecast 2025-2030

Chart on LED grow lights - Market size and forecast 2025-2030 ($ million)
Data Table on LED grow lights - Market size and forecast 2025-2030 ($ million)
Chart on LED grow lights - Year-over-year growth 2025-2030 (%)
Data Table on LED grow lights - Year-over-year growth 2025-2030 (%)

9.4 Automated watering systems - Market size and forecast 2025-2030

Chart on Automated watering systems - Market size and forecast 2025-2030 ($ million)
Data Table on Automated watering systems - Market size and forecast 2025-2030 ($ million)
Chart on Automated watering systems - Year-over-year growth 2025-2030 (%)
Data Table on Automated watering systems - Year-over-year growth 2025-2030 (%)

9.5 Nutrient delivery systems - Market size and forecast 2025-2030

Chart on Nutrient delivery systems - Market size and forecast 2025-2030 ($ million)
Data Table on Nutrient delivery systems - Market size and forecast 2025-2030 ($ million)
Chart on Nutrient delivery systems - Year-over-year growth 2025-2030 (%)
Data Table on Nutrient delivery systems - Year-over-year growth 2025-2030 (%)

9.6 Environmental monitoring - Market size and forecast 2025-2030

Chart on Environmental monitoring - Market size and forecast 2025-2030 ($ million)
Data Table on Environmental monitoring - Market size and forecast 2025-2030 ($ million)
Chart on Environmental monitoring - Year-over-year growth 2025-2030 (%)
Data Table on Environmental monitoring - Year-over-year growth 2025-2030 (%)

9.7 Market opportunity by Product

Market opportunity by Product ($ million)
Data Table on Market opportunity by Product ($ million)

10. Market Segmentation by Product Type

10.1 Market segments

Chart on Product Type - Market share 2025-2030 (%)
Data Table on Product Type - Market share 2025-2030 (%)

10.2 Comparison by Product Type

Chart on Comparison by Product Type
Data Table on Comparison by Product Type

10.3 Hydroponics - Market size and forecast 2025-2030

Chart on Hydroponics - Market size and forecast 2025-2030 ($ million)
Data Table on Hydroponics - Market size and forecast 2025-2030 ($ million)
Chart on Hydroponics - Year-over-year growth 2025-2030 (%)
Data Table on Hydroponics - Year-over-year growth 2025-2030 (%)

10.4 Soil-based - Market size and forecast 2025-2030

Chart on Soil-based - Market size and forecast 2025-2030 ($ million)
Data Table on Soil-based - Market size and forecast 2025-2030 ($ million)
Chart on Soil-based - Year-over-year growth 2025-2030 (%)
Data Table on Soil-based - Year-over-year growth 2025-2030 (%)

10.5 Aquaponics - Market size and forecast 2025-2030

Chart on Aquaponics - Market size and forecast 2025-2030 ($ million)
Data Table on Aquaponics - Market size and forecast 2025-2030 ($ million)
Chart on Aquaponics - Year-over-year growth 2025-2030 (%)
Data Table on Aquaponics - Year-over-year growth 2025-2030 (%)

10.6 Aeroponics - Market size and forecast 2025-2030

Chart on Aeroponics - Market size and forecast 2025-2030 ($ million)
Data Table on Aeroponics - Market size and forecast 2025-2030 ($ million)
Chart on Aeroponics - Year-over-year growth 2025-2030 (%)
Data Table on Aeroponics - Year-over-year growth 2025-2030 (%)

10.7 Market opportunity by Product Type

Market opportunity by Product Type ($ million)
Data Table on Market opportunity by Product Type ($ million)

11. Market Segmentation by End-user

11.1 Market segments

Chart on End-user - Market share 2025-2030 (%)
Data Table on End-user - Market share 2025-2030 (%)

11.2 Comparison by End-user

Chart on Comparison by End-user
Data Table on Comparison by End-user

11.3 Residential - Market size and forecast 2025-2030

Chart on Residential - Market size and forecast 2025-2030 ($ million)
Data Table on Residential - Market size and forecast 2025-2030 ($ million)
Chart on Residential - Year-over-year growth 2025-2030 (%)
Data Table on Residential - Year-over-year growth 2025-2030 (%)

11.4 Commercial - Market size and forecast 2025-2030

Chart on Commercial - Market size and forecast 2025-2030 ($ million)
Data Table on Commercial - Market size and forecast 2025-2030 ($ million)
Chart on Commercial - Year-over-year growth 2025-2030 (%)
Data Table on Commercial - Year-over-year growth 2025-2030 (%)

11.5 Market opportunity by End-user

Market opportunity by End-user ($ million)
Data Table on Market opportunity by End-user ($ million)

12. Market Segmentation by Distribution Channel

12.1 Market segments

Chart on Distribution Channel - Market share 2025-2030 (%)
Data Table on Distribution Channel - Market share 2025-2030 (%)

12.2 Comparison by Distribution Channel

Chart on Comparison by Distribution Channel
Data Table on Comparison by Distribution Channel

12.3 Offline - Market size and forecast 2025-2030

Chart on Offline - Market size and forecast 2025-2030 ($ million)
Data Table on Offline - Market size and forecast 2025-2030 ($ million)
Chart on Offline - Year-over-year growth 2025-2030 (%)
Data Table on Offline - Year-over-year growth 2025-2030 (%)

12.4 Online - Market size and forecast 2025-2030

Chart on Online - Market size and forecast 2025-2030 ($ million)
Data Table on Online - Market size and forecast 2025-2030 ($ million)
Chart on Online - Year-over-year growth 2025-2030 (%)
Data Table on Online - Year-over-year growth 2025-2030 (%)

12.5 Market opportunity by Distribution Channel

Market opportunity by Distribution Channel ($ million)
Data Table on Market opportunity by Distribution Channel ($ million)

13. Customer Landscape

13.1 Customer landscape overview

Analysis of price sensitivity, lifecycle, customer purchase basket, adoption rates, and purchase criteria

14. Geographic Landscape

14.1 Geographic segmentation

Chart on Market share by geography 2025-2030 (%)
Data Table on Market share by geography 2025-2030 (%)

14.2 Geographic comparison

Chart on Geographic comparison
Data Table on Geographic comparison

14.3 North America - Market size and forecast 2025-2030

Chart on North America - Market size and forecast 2025-2030 ($ million)
Data Table on North America - Market size and forecast 2025-2030 ($ million)
Chart on North America - Year-over-year growth 2025-2030 (%)
Data Table on North America - Year-over-year growth 2025-2030 (%)
Chart on Regional Comparison - North America
Data Table on Regional Comparison - North America

14.3.1 US - Market size and forecast 2025-2030

Chart on US - Market size and forecast 2025-2030 ($ million)
Data Table on US - Market size and forecast 2025-2030 ($ million)
Chart on US - Year-over-year growth 2025-2030 (%)
Data Table on US - Year-over-year growth 2025-2030 (%)

14.3.2 Canada - Market size and forecast 2025-2030

Chart on Canada - Market size and forecast 2025-2030 ($ million)
Data Table on Canada - Market size and forecast 2025-2030 ($ million)
Chart on Canada - Year-over-year growth 2025-2030 (%)
Data Table on Canada - Year-over-year growth 2025-2030 (%)

14.3.3 Mexico - Market size and forecast 2025-2030

Chart on Mexico - Market size and forecast 2025-2030 ($ million)
Data Table on Mexico - Market size and forecast 2025-2030 ($ million)
Chart on Mexico - Year-over-year growth 2025-2030 (%)
Data Table on Mexico - Year-over-year growth 2025-2030 (%)

14.4 Europe - Market size and forecast 2025-2030

Chart on Europe - Market size and forecast 2025-2030 ($ million)
Data Table on Europe - Market size and forecast 2025-2030 ($ million)
Chart on Europe - Year-over-year growth 2025-2030 (%)
Data Table on Europe - Year-over-year growth 2025-2030 (%)
Chart on Regional Comparison - Europe
Data Table on Regional Comparison - Europe

14.4.1 Germany - Market size and forecast 2025-2030

Chart on Germany - Market size and forecast 2025-2030 ($ million)
Data Table on Germany - Market size and forecast 2025-2030 ($ million)
Chart on Germany - Year-over-year growth 2025-2030 (%)
Data Table on Germany - Year-over-year growth 2025-2030 (%)

14.4.2 UK - Market size and forecast 2025-2030

Chart on UK - Market size and forecast 2025-2030 ($ million)
Data Table on UK - Market size and forecast 2025-2030 ($ million)
Chart on UK - Year-over-year growth 2025-2030 (%)
Data Table on UK - Year-over-year growth 2025-2030 (%)

14.4.3 France - Market size and forecast 2025-2030

Chart on France - Market size and forecast 2025-2030 ($ million)
Data Table on France - Market size and forecast 2025-2030 ($ million)
Chart on France - Year-over-year growth 2025-2030 (%)
Data Table on France - Year-over-year growth 2025-2030 (%)

14.4.4 The Netherlands - Market size and forecast 2025-2030

Chart on The Netherlands - Market size and forecast 2025-2030 ($ million)
Data Table on The Netherlands - Market size and forecast 2025-2030 ($ million)
Chart on The Netherlands - Year-over-year growth 2025-2030 (%)
Data Table on The Netherlands - Year-over-year growth 2025-2030 (%)

14.4.5 Italy - Market size and forecast 2025-2030

Chart on Italy - Market size and forecast 2025-2030 ($ million)
Data Table on Italy - Market size and forecast 2025-2030 ($ million)
Chart on Italy - Year-over-year growth 2025-2030 (%)
Data Table on Italy - Year-over-year growth 2025-2030 (%)

14.4.6 Spain - Market size and forecast 2025-2030

Chart on Spain - Market size and forecast 2025-2030 ($ million)
Data Table on Spain - Market size and forecast 2025-2030 ($ million)
Chart on Spain - Year-over-year growth 2025-2030 (%)
Data Table on Spain - Year-over-year growth 2025-2030 (%)

14.5 APAC - Market size and forecast 2025-2030

Chart on APAC - Market size and forecast 2025-2030 ($ million)
Data Table on APAC - Market size and forecast 2025-2030 ($ million)
Chart on APAC - Year-over-year growth 2025-2030 (%)
Data Table on APAC - Year-over-year growth 2025-2030 (%)
Chart on Regional Comparison - APAC
Data Table on Regional Comparison - APAC

14.5.1 China - Market size and forecast 2025-2030

Chart on China - Market size and forecast 2025-2030 ($ million)
Data Table on China - Market size and forecast 2025-2030 ($ million)
Chart on China - Year-over-year growth 2025-2030 (%)
Data Table on China - Year-over-year growth 2025-2030 (%)

14.5.2 Japan - Market size and forecast 2025-2030

Chart on Japan - Market size and forecast 2025-2030 ($ million)
Data Table on Japan - Market size and forecast 2025-2030 ($ million)
Chart on Japan - Year-over-year growth 2025-2030 (%)
Data Table on Japan - Year-over-year growth 2025-2030 (%)

14.5.3 India - Market size and forecast 2025-2030

Chart on India - Market size and forecast 2025-2030 ($ million)
Data Table on India - Market size and forecast 2025-2030 ($ million)
Chart on India - Year-over-year growth 2025-2030 (%)
Data Table on India - Year-over-year growth 2025-2030 (%)

14.5.4 South Korea - Market size and forecast 2025-2030

Chart on South Korea - Market size and forecast 2025-2030 ($ million)
Data Table on South Korea - Market size and forecast 2025-2030 ($ million)
Chart on South Korea - Year-over-year growth 2025-2030 (%)
Data Table on South Korea - Year-over-year growth 2025-2030 (%)

14.5.5 Australia - Market size and forecast 2025-2030

Chart on Australia - Market size and forecast 2025-2030 ($ million)
Data Table on Australia - Market size and forecast 2025-2030 ($ million)
Chart on Australia - Year-over-year growth 2025-2030 (%)
Data Table on Australia - Year-over-year growth 2025-2030 (%)

14.5.6 Indonesia - Market size and forecast 2025-2030

Chart on Indonesia - Market size and forecast 2025-2030 ($ million)
Data Table on Indonesia - Market size and forecast 2025-2030 ($ million)
Chart on Indonesia - Year-over-year growth 2025-2030 (%)
Data Table on Indonesia - Year-over-year growth 2025-2030 (%)

14.6 Middle East and Africa - Market size and forecast 2025-2030

Chart on Middle East and Africa - Market size and forecast 2025-2030 ($ million)
Data Table on Middle East and Africa - Market size and forecast 2025-2030 ($ million)
Chart on Middle East and Africa - Year-over-year growth 2025-2030 (%)
Data Table on Middle East and Africa - Year-over-year growth 2025-2030 (%)
Chart on Regional Comparison - Middle East and Africa
Data Table on Regional Comparison - Middle East and Africa

14.6.1 UAE - Market size and forecast 2025-2030

Chart on UAE - Market size and forecast 2025-2030 ($ million)
Data Table on UAE - Market size and forecast 2025-2030 ($ million)
Chart on UAE - Year-over-year growth 2025-2030 (%)
Data Table on UAE - Year-over-year growth 2025-2030 (%)

14.6.2 Saudi Arabia - Market size and forecast 2025-2030

Chart on Saudi Arabia - Market size and forecast 2025-2030 ($ million)
Data Table on Saudi Arabia - Market size and forecast 2025-2030 ($ million)
Chart on Saudi Arabia - Year-over-year growth 2025-2030 (%)
Data Table on Saudi Arabia - Year-over-year growth 2025-2030 (%)

14.6.3 Israel - Market size and forecast 2025-2030

Chart on Israel - Market size and forecast 2025-2030 ($ million)
Data Table on Israel - Market size and forecast 2025-2030 ($ million)
Chart on Israel - Year-over-year growth 2025-2030 (%)
Data Table on Israel - Year-over-year growth 2025-2030 (%)

14.6.4 South Africa - Market size and forecast 2025-2030

Chart on South Africa - Market size and forecast 2025-2030 ($ million)
Data Table on South Africa - Market size and forecast 2025-2030 ($ million)
Chart on South Africa - Year-over-year growth 2025-2030 (%)
Data Table on South Africa - Year-over-year growth 2025-2030 (%)

14.6.5 Turkey - Market size and forecast 2025-2030

Chart on Turkey - Market size and forecast 2025-2030 ($ million)
Data Table on Turkey - Market size and forecast 2025-2030 ($ million)
Chart on Turkey - Year-over-year growth 2025-2030 (%)
Data Table on Turkey - Year-over-year growth 2025-2030 (%)

14.7 South America - Market size and forecast 2025-2030

Chart on South America - Market size and forecast 2025-2030 ($ million)
Data Table on South America - Market size and forecast 2025-2030 ($ million)
Chart on South America - Year-over-year growth 2025-2030 (%)
Data Table on South America - Year-over-year growth 2025-2030 (%)
Chart on Regional Comparison - South America
Data Table on Regional Comparison - South America

14.7.1 Brazil - Market size and forecast 2025-2030

Chart on Brazil - Market size and forecast 2025-2030 ($ million)
Data Table on Brazil - Market size and forecast 2025-2030 ($ million)
Chart on Brazil - Year-over-year growth 2025-2030 (%)
Data Table on Brazil - Year-over-year growth 2025-2030 (%)

14.7.2 Argentina - Market size and forecast 2025-2030

Chart on Argentina - Market size and forecast 2025-2030 ($ million)
Data Table on Argentina - Market size and forecast 2025-2030 ($ million)
Chart on Argentina - Year-over-year growth 2025-2030 (%)
Data Table on Argentina - Year-over-year growth 2025-2030 (%)

14.7.3 Chile - Market size and forecast 2025-2030

Chart on Chile - Market size and forecast 2025-2030 ($ million)
Data Table on Chile - Market size and forecast 2025-2030 ($ million)
Chart on Chile - Year-over-year growth 2025-2030 (%)
Data Table on Chile - Year-over-year growth 2025-2030 (%)

14.8 Market opportunity by geography

Market opportunity by geography ($ million)
Data Tables on Market opportunity by geography ($ million)

15. Drivers, Challenges, and Opportunity

15.1 Market drivers

Rapid urbanization structural transitions expand high density residential living spatial limits
Surging consumer demand regarding sustainable organic produce propels household cultivation
Substantial institutional venture capital influx accelerates commercial hydroponic system product development

15.2 Market challenges

Significant cybersecurity vulnerabilities threaten consumer IOT device operational security integrity networks
High premium retail pricing barriers limit mass consumer adoption frameworks
Elevated energy consumption metrics increase household utility expenditures operational costs

15.3 Impact of drivers and challenges

Impact of drivers and challenges in 2025 and 2030

15.4 Market opportunities

Widespread commercial integration regarding artificial intelligence algorithmic automated environmental monitoring
Strategic collaborative brand partnerships expand retail distribution ecosystems household penetration
Accelerated engineering development focuses on advanced closed loop liquid hydroponics

16. Competitive Landscape

16.1 Overview

16.2

Overview on criticality of inputs and factors of differentiation

16.3 Landscape disruption

Overview on factors of disruption

16.4 Industry risks

Impact of key risks on business

17. Competitive Analysis

17.1 Companies profiled

Companies covered

17.2 Company ranking index

17.3 Market positioning of companies

Matrix on companies position and classification

17.4 Altifarm

Altifarm - Overview
Altifarm - Product / Service
Altifarm - Key offerings
SWOT

17.5 AVA Technologies Inc.

AVA Technologies Inc. - Overview
AVA Technologies Inc. - Product / Service
AVA Technologies Inc. - Key offerings
SWOT

17.6 Bosch Home Appliances

Bosch Home Appliances - Overview
Bosch Home Appliances - Product / Service
Bosch Home Appliances - Key offerings
SWOT

17.7 Click and Grow LLC

Click and Grow LLC - Overview
Click and Grow LLC - Product / Service
Click and Grow LLC - Key offerings
SWOT

17.8 CropKing Inc.

CropKing Inc. - Overview
CropKing Inc. - Product / Service
CropKing Inc. - Key offerings
SWOT

17.9 Grow Green

Grow Green - Overview
Grow Green - Product / Service
Grow Green - Key offerings
SWOT

17.10 Just Vertical

Just Vertical - Overview
Just Vertical - Product / Service
Just Vertical - Key offerings
SWOT

17.11 Chal Tec GmbH

Chal Tec GmbH - Overview
Chal Tec GmbH - Product / Service
Chal Tec GmbH - Key offerings
SWOT

17.12 LetPot

LetPot - Overview
LetPot - Product / Service
LetPot - Key offerings
SWOT

17.13 Lettuce Grow

Lettuce Grow - Overview
Lettuce Grow - Product / Service
Lettuce Grow - Key offerings
SWOT

17.14 LG Electronics Inc.

LG Electronics Inc. - Overview
LG Electronics Inc. - Business segments
LG Electronics Inc. - Key news
LG Electronics Inc. - Key offerings
LG Electronics Inc. - Segment focus
SWOT

17.15 Moistenland LLC

Moistenland LLC - Overview
Moistenland LLC - Product / Service
Moistenland LLC - Key offerings
SWOT

17.16 The Scotts Miracle Gro Co.

The Scotts Miracle Gro Co. - Overview
The Scotts Miracle Gro Co. - Business segments
The Scotts Miracle Gro Co. - Key offerings
The Scotts Miracle Gro Co. - Segment focus
SWOT

17.17 Tower Garden

Tower Garden - Overview
Tower Garden - Product / Service
Tower Garden - Key offerings
SWOT

17.18 Tregren

Tregren - Overview
Tregren - Product / Service
Tregren - Key offerings
SWOT

18. Appendix

18.1 Scope of the report

Market definition
Objectives
Notes and caveats

18.2 Inclusions and exclusions checklist

Inclusions checklist
Exclusions checklist

18.3 Currency conversion rates for US$

18.4 Research methodology

18.5 Data procurement

Information sources

18.6 Data validation

18.7 Validation techniques employed for market sizing

18.8 Data synthesis

18.9 360 degree market analysis

18.10 List of abbreviations

Research Methodology

Technavio presents a detailed picture of the market by way of study, synthesis, and summation of data from multiple sources. The analysts have presented the various facets of the market with a particular focus on identifying the key industry influencers. The data thus presented is comprehensive, reliable, and the result of extensive research, both primary and secondary.

INFORMATION SOURCES

Primary sources

  • Manufacturers and suppliers
  • Channel partners
  • Industry experts
  • Strategic decision makers

Secondary sources

  • Industry journals and periodicals
  • Government data
  • Financial reports of key industry players
  • Historical data
  • Press releases

DATA ANALYSIS

Data Synthesis

  • Collation of data
  • Estimation of key figures
  • Analysis of derived insights

Data Validation

  • Triangulation with data models
  • Reference against proprietary databases
  • Corroboration with industry experts

REPORT WRITING

Qualitative

  • Market drivers
  • Market challenges
  • Market trends
  • Five forces analysis

Quantitative

  • Market size and forecast
  • Market segmentation
  • Geographical insights
  • Competitive landscape

Interested in this report?

Get your sample now to see our research methodology and insights!

Download Now

Frequently Asked Questions

Smart Indoor Garden Systems market growth will increase by USD 1492.3 million during 2026-2030.

The Smart Indoor Garden Systems market is expected to grow at a CAGR of 9.7% during 2026-2030.

Smart Indoor Garden Systems market is segmented by Type (Floor garden, Wall garden) Product (LED grow lights, Automated watering systems, Nutrient delivery systems, Environmental monitoring) Product type (Hydroponics, Soil-based, Aquaponics, Aeroponics) End-user (Residential, Commercial) Distribution channel (Offline, Online)

Altifarm, AVA Technologies Inc., Bosch Home Appliances, Click and Grow LLC, CropKing Inc., Gardyn Inc., Grow Green, iDOO, Just Vertical, Chal Tec GmbH, LetPot, Lettuce Grow, LG Electronics Inc., Moistenland LLC, Plantaform, Rise Gardens LLC, The Scotts Miracle Gro Co., Tower Garden, Tregren, Urban Cultivator are a few of the key vendors in the Smart Indoor Garden Systems market.

North America will register the highest growth rate of 39.3% among the other regions. Therefore, the Smart Indoor Garden Systems market in North America is expected to garner significant business opportunities for the vendors during the forecast period.

US, Canada, Mexico, Germany, UK, France, The Netherlands, Italy, Spain, China, Japan, India, South Korea, Australia, Indonesia, UAE, Saudi Arabia, Israel, South Africa, Turkey, Brazil, Argentina, Chile

  • Rapid urbanization structural transitions expand high density residential living spatial limits is the driving factor this market.

The Smart Indoor Garden Systems market vendors should focus on grabbing business opportunities from the Type segment as it accounted for the largest market share in the base year.
RIA - Research AI Assistant
Ask RIA
