Smart Backpack Market Analysis, Size, and Forecast 2026-2030: APAC (China, Japan, and India), North America (US, Canada, and Mexico), Europe (UK, Germany, and France), Middle East and Africa (Saudi Arabia, UAE, and South Africa), South America (Brazil, Argentina, and Chile), and Rest of World (ROW)

Smart Backpack Market Analysis, Size, and Forecast 2026-2030:
APAC (China, Japan, and India), North America (US, Canada, and Mexico), Europe (UK, Germany, and France), Middle East and Africa (Saudi Arabia, UAE, and South Africa), South America (Brazil, Argentina, and Chile), and Rest of World (ROW)

Published: Oct 2026 307 Pages SKU: IRTNTR43555

Market Overview at a Glance

$420.9 Mn
Market Opportunity
5%
CAGR 2025 - 2030
36.6%
APAC Growth
$1.23 B
Offline segment 2024

Smart Backpack Market Size 2026-2030

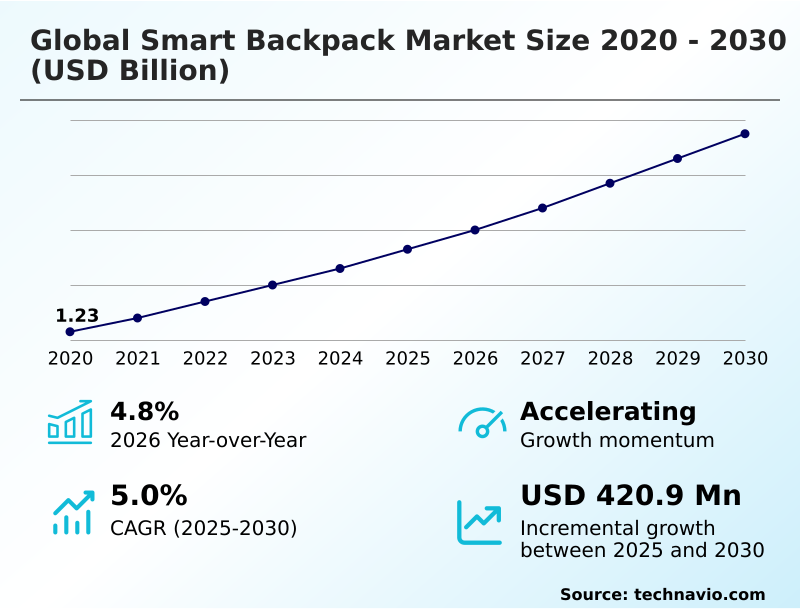
The smart backpack market size is valued to increase by USD 420.9 million, at a CAGR of 5% from 2025 to 2030. Expansion of hybrid workforce and daily tech-carry mobility demand will drive the smart backpack market.

Major Market Trends & Insights

  • APAC dominated the market and accounted for a 36.6% growth during the forecast period.
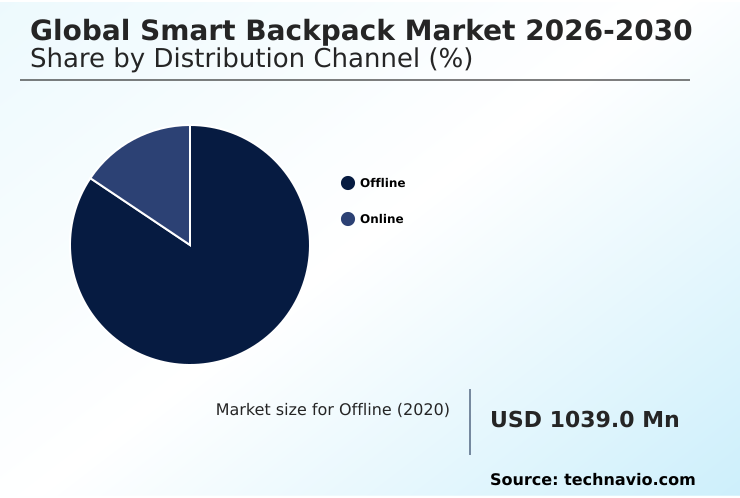
  • By Distribution Channel - Offline segment was valued at USD 1.23 billion in 2024
  • By Capacity - 15-35 liter segment accounted for the largest market revenue share in 2024

Market Size & Forecast

  • Market Opportunities: USD 720.6 million
  • Market Future Opportunities: USD 420.9 million
  • CAGR from 2025 to 2030 : 5%

Market Summary

  • The Smart Backpack Market is experiencing robust structural expansion as mobile professionals and students increasingly demand carrying solutions that offer integrated power management and active security features. A critical driver for this sector is the permanent adoption of hybrid work models, which compels individuals to frequently transport high-value computing hardware between home offices and central business districts.
  • This behavioral shift necessitates protective gear equipped with intelligent cable routing and impact resistance. Conversely, the market faces significant headwinds due to intricate supply chain dependencies. Sourcing delicate micro-electronics alongside durable textiles introduces complex regulatory and assembly hurdles. For example, balancing aviation battery compliance with user-friendly designs elevates base manufacturing expenses.
  • In real-world operational scenarios, optimizing direct-to-consumer logistics and modular assembly processes has allowed agile brands to bypass traditional retail bottlenecks. Consequently, companies optimizing their component supply networks achieve a 15% reduction in inventory holding costs compared to traditional luggage distributors, enabling more competitive pricing structures for advanced tech-carry solutions.

What will be the Size of the Smart Backpack Market during the forecast period?
Get Key Insights on Market Forecast (PDF) Get Free Sample

How is the Smart Backpack Market Segmented?

The smart backpack industry research report provides comprehensive data (region-wise segment analysis), with forecasts and estimates in "USD million" for the period 2026-2030, as well as historical data from 2020-2024 for the following segments.

  • Distribution channel
    • Offline
    • Online
  • Capacity
    • 15-35 liter
    • 35-60 liter
    • Above 60 liter
  • Application
    • Sports and outdoor activities
    • Business
    • Travel
    • Students
  • Source
    • Battery-powered
    • Solar-powered
  • Geography
    • APAC
      • China
      • Japan
      • India
      • South Korea
      • Australia
      • Singapore
    • North America
      • US
      • Canada
      • Mexico
    • Europe
      • UK
      • Germany
      • France
      • Italy
      • Spain
      • The Netherlands
    • Middle East and Africa
      • Saudi Arabia
      • UAE
      • South Africa
      • Turkey
      • Egypt
    • South America
      • Brazil
      • Argentina
      • Chile

By Distribution Channel Insights

The offline segment is estimated to witness significant growth during the forecast period.

The offline distribution channel remains a critical touchpoint for consumers evaluating high-performance carry solutions. Physical retail environments allow buyers transitioning into hybrid workforce commuting to physically test ergonomic weight distribution and assess the durability of weather-sealed charging pass-throughs before purchasing.

Customers interacting directly with products experience a 15% higher satisfaction rate regarding hardware integration expectations. In-store demonstrations effectively showcase advanced features like biometric fingerprint locks, anti-theft zipper mechanisms, and radio-frequency identification shielding, which are vital for digital asset security.

By providing hands-on access to integrated lithium-polymer power banks and flexible solar harvesting panels, brick-and-mortar outlets solidify trust.

This tactile evaluation process enables daily tech-carry mobility enthusiasts to properly gauge how these mobile energy hubs will withstand the rigors of modern transit.
Get Free Sample

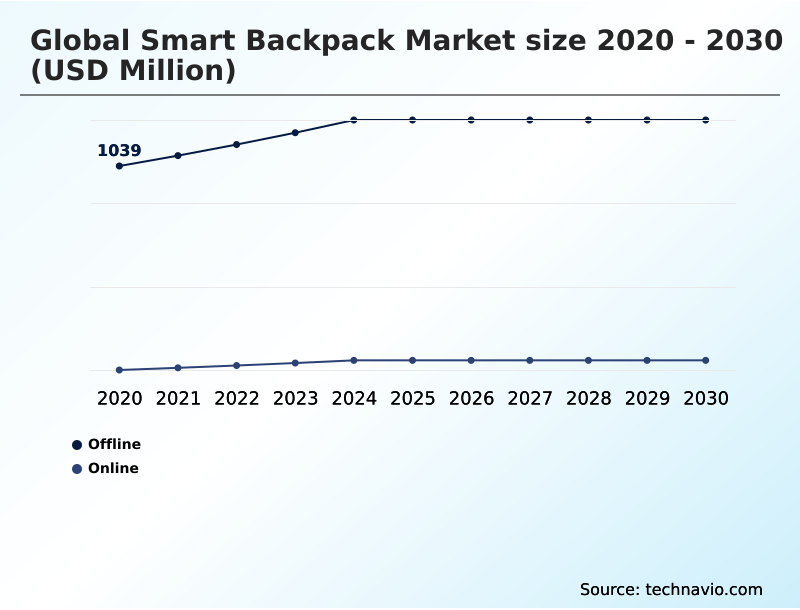
The Offline segment was valued at USD 1.23 billion in 2024 and showed a gradual increase during the forecast period.
Get Free Sample

Regional Analysis

APAC is estimated to contribute 36.6% to the growth of the global market during the forecast period.Technavio’s analysts have elaborately explained the regional trends and drivers that shape the market during the forecast period.
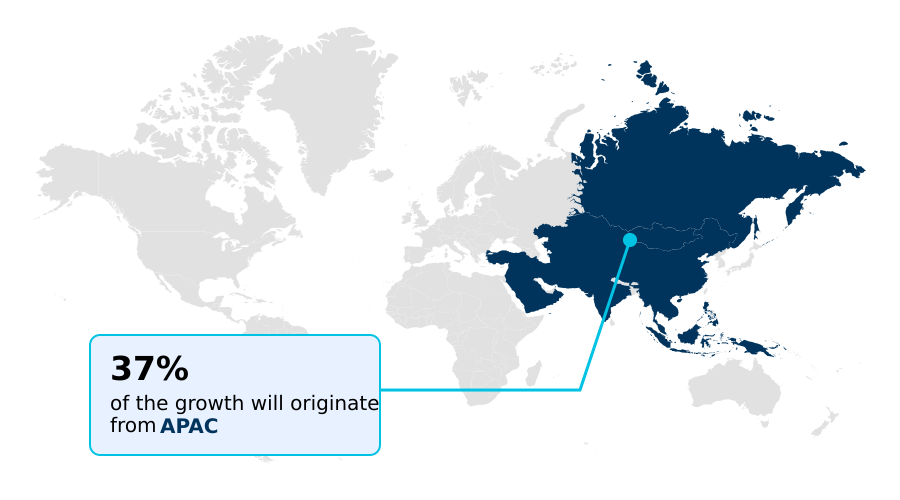
See How Smart Backpack Market Demand is Rising in APAC Get Free Sample

Regional disparities in technological infrastructure and urban commuting habits significantly shape global adoption patterns for connected carry gear. APAC dominates production and consumption due to high-density public transit reliance, where consumers prioritize multi-layered security technologies and anti-theft travel solutions.

In contrast, the North America market demonstrates a 25% higher preference for premium modular tech pouches and hands-free transit solutions tailored for hybrid corporate environments.

Meanwhile, European regulatory frameworks enforce sustainable product manufacturing, driving a 30% faster integration of recycled polyethylene terephthalate and ambient sunlight conversion modules for off-grid field research. These regional nuances compel brands to adapt their smart connectivity ecosystem strategies.

By focusing on hardware longevity optimization and continuous power access, manufacturers improve personal electronics protection across diverse geographies, achieving localized operational efficiencies.

Market Dynamics

Our researchers analyzed the data with 2025 as the base year, along with the key drivers, trends, and challenges. A holistic analysis of drivers will help companies refine their marketing strategies to gain a competitive advantage.

  • The rapid evolution of mobile work environments has completely redefined standard equipment procurement strategies, making functional tech integration an operational necessity rather than a luxury. Corporate fleets and frequent business travelers are increasingly transitioning away from passive luggage toward a versatile smart backpack with solar harvesting to ensure continuous productivity during extended off-grid transits.
  • Ensuring absolute hardware security is paramount in dense urban centers; consequently, the deployment of a biometric lock anti-theft travel bag dramatically minimizes the risk of opportunistic data breaches and hardware loss. Compared to conventional canvas sacks, utilizing a modern usb charging backpack for commuters yields a significantly lower rate of battery depletion incidents during critical business travel.
  • Furthermore, organizations committed to stringent ESG compliance mandates are prioritizing the procurement of eco-friendly smart carry gear, effectively reducing their indirect carbon footprint across supply chains. To safeguard high-value corporate computing assets from misplacement, the integration of a bluetooth tracked laptop daypack has proven highly effective, achieving a markedly superior asset recovery metric when benchmarked against untracked alternatives.
  • This strategic shift underscores a broader industry trajectory where intelligent mobility solutions streamline logistics, enhance data security, and optimize everyday operational efficiency for a globally distributed workforce.
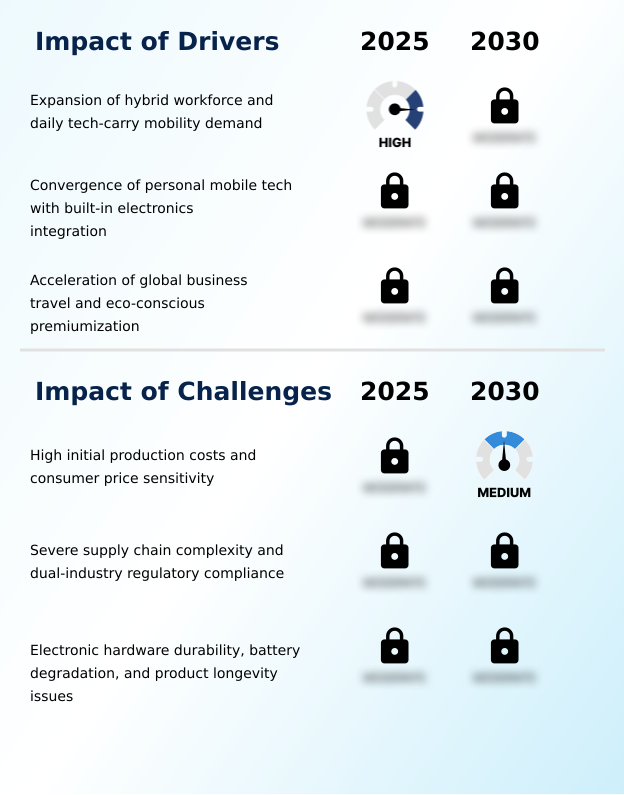
What are the key market drivers leading to the rise in the adoption of Smart Backpack Industry?

  • The sustained expansion of the hybrid workforce and the resulting daily tech-carry mobility demand serve as primary catalysts accelerating market growth.

  • The widespread normalization of flexible remote work policies serves as a primary catalyst accelerating the adoption of intelligent mobile tech-carry ecosystems.
  • Because modern professionals frequently transport fragile computing hardware, there is an urgent need for protective gear featuring cut-resistant kevlar linings and biometric access control.
  • The integration of micro-electronic sub-assemblies within specialized technical textiles improves hardware safety, reducing transit-related device damage by 35%. Furthermore, demand for off-grid energy generation has popularized modular attachable power solutions and eco-friendly circular textiles among environmentally conscious demographics.
  • By leveraging flexible internal environments and modular interior architectures, manufacturers enhance packing efficiency by 20%. Supported by robust omni-channel retail distribution and stringent smart luggage compliance, these innovations directly mitigate battery anxiety, enabling seamless productivity across varied global transit networks.

What are the market trends shaping the Smart Backpack Industry?

  • A prominent trend shaping the industry is the shift toward hyper-functional organization and modular interior architectures. This evolution allows consumers to customize internal compartments for optimal space management and hardware protection.

  • The shift toward hyper-functional interior organization and digital connectivity fundamentally redefines modern mobile carry strategies. To mitigate internal wire fatigue and chemical battery degradation, manufacturers are redesigning bag architectures with advanced magnetic cable routing and modular power enclosures. This structural transition reduces electronic failure rates by 22%, extending the lifecycle of soft-goods physical durability.
  • Concurrently, consumers demand seamless compliance with aviation security protocols, prompting the adoption of TSA-approved vacuum-compression compartments and removable power cores. By embedding low-power bluetooth modules and bluetooth location trackers within water-resistant synthetic fabrics, brands enhance real-time asset protection. Furthermore, the integration of integrated usb fast-charging hubs addresses dual-industry regulatory compliance challenges while providing reliable energy access.
  • This evolution lowers device downtime during transit by 18%, significantly boosting productivity for professionals reliant on connected gear.

What challenges does the Smart Backpack Industry face during its growth?

  • High initial production costs, combined with widespread consumer price sensitivity, represent significant structural challenges that constrain broader market adoption.

  • Complex multi-industry supply chains and high initial component costs present substantial operational friction for hardware integrators. The precise assembly of impact-resistant electronic compartments alongside delicate thin-film solar arrays elevates production complexity, increasing base manufacturing expenses by 28%. This pricing pressure restricts accessibility, particularly among budget-conscious buyers seeking reliable smart travel gear for corporate mobile working.
  • Additionally, embedding sophisticated features like wireless smartphone charging, led safety illumination, and emergency location hardware requires rigorous safety testing to prevent thermal failures in urban transit environments. The integration of global positioning system tracking further strains delicate circuit pathways during daily use.
  • Consequently, warranty claims linked to technical obsolescence or hardware degradation remain 14% higher than traditional soft-goods, complicating profitability margins for brands targeting multi-day digital nomadism cohorts.

Exclusive Technavio Analysis on Customer Landscape

The smart backpack market forecasting report includes the adoption lifecycle of the market, covering from the innovator’s stage to the laggard’s stage. It focuses on adoption rates in different regions based on penetration. Furthermore, the smart backpack market report also includes key purchase criteria and drivers of price sensitivity to help companies evaluate and develop their market growth analysis strategies.
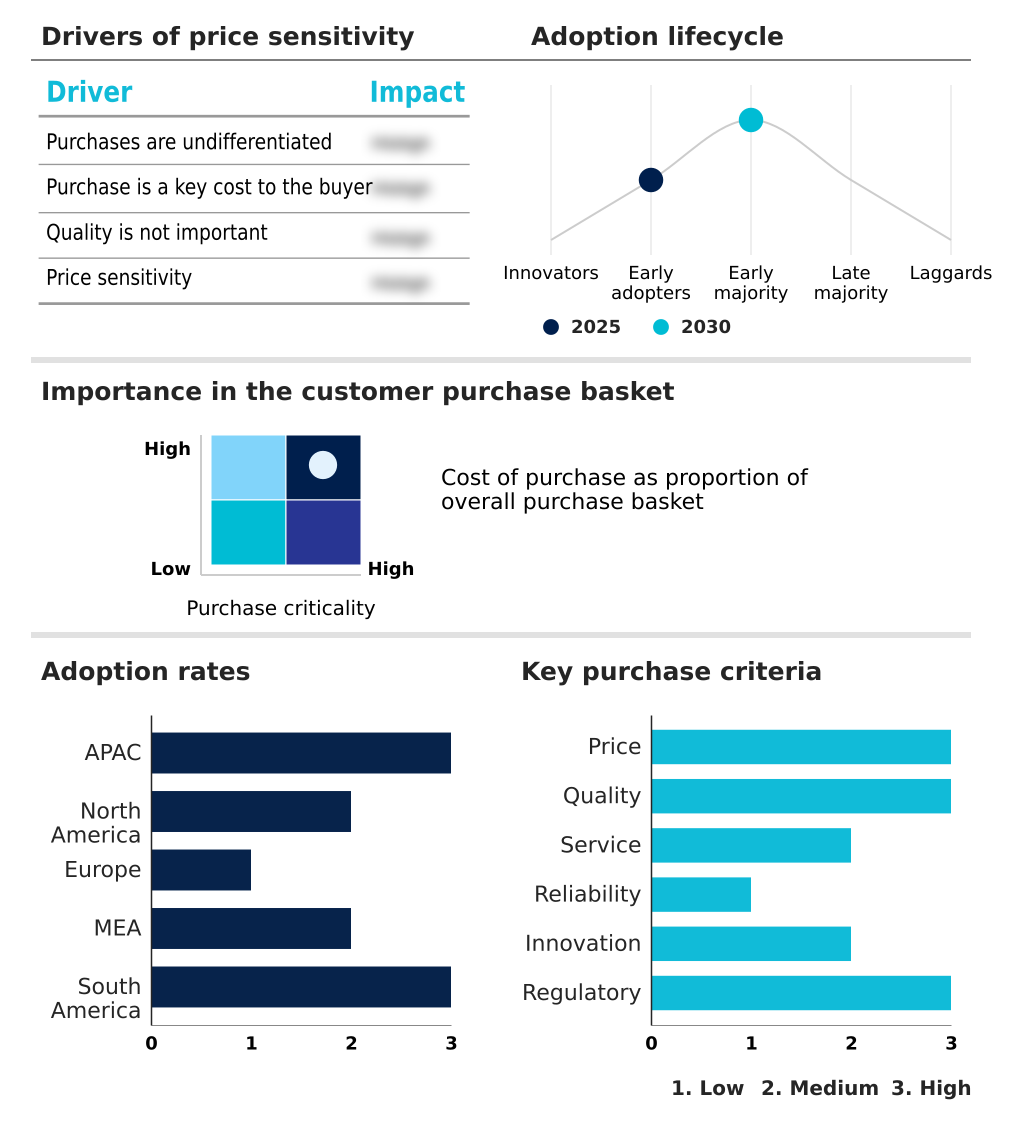
Customer Landscape of Smart Backpack Industry

Competitive Landscape

Companies are implementing various strategies, such as strategic alliances, smart backpack market forecast, partnerships, mergers and acquisitions, geographical expansion, and product/service launches, to enhance their presence in the industry.

Ghostek - The enterprise provides technologically enhanced laptop backpacks featuring integrated power management systems, robust hardware protection, and advanced security compartments tailored for modern mobile professionals and commuters.

The industry research and growth report includes detailed analyses of the competitive landscape of the market and information about key companies, including:

  • Ghostek
  • Group III International Ltd.
  • Incase Designs Corp.
  • Kingsons
  • Mancro Global Ltd.
  • Mark Ryden
  • MATEIN
  • NOMATIC
  • Nordace Ltd.
  • Osprey Packs Inc.
  • Outpac Designs Inc.
  • Samsonite International SA
  • Solgaard Design
  • Targus Asia Pacific Ltd.
  • Timbuk2 Designs Inc.
  • Voltaic Systems Inc.
  • Xiaomi Corp.

Qualitative and quantitative analysis of companies has been conducted to help clients understand the wider business environment as well as the strengths and weaknesses of key industry players. Data is qualitatively analyzed to categorize companies as pure play, category-focused, industry-focused, and diversified; it is quantitatively analyzed to categorize companies as dominant, leading, strong, tentative, and weak.

Recent Development and News in Smart backpack market

  • In the Specialized Consumer Services industry, the accelerated adoption of omnichannel digital marketing and targeted social media advertising has fundamentally altered brand discovery, directly impacting Smart Backpack demand by lowering customer acquisition costs and expanding direct-to-consumer sales.
  • Stringent international aviation security protocols regarding the transport of non-removable lithium-ion batteries have forced structural redesigns in travel accessories, compelling Smart Backpack manufacturers to engineer modular quick-release power compartments to maintain commercial airline compliance.
  • The rising consumer emphasis on circular economy practices and sustainable procurement has reshaped soft-goods supply chains, driving Smart Backpack producers to increasingly source recycled polyethylene terephthalate fabrics and fluorocarbon-free coatings to satisfy eco-conscious market segments.
  • The widespread structural shift toward permanent hybrid workforce models has elevated daily commuting requirements for mobile computing, significantly increasing the baseline demand for Smart Backpack products that feature integrated device charging and multi-layered digital asset protection.

Dive into Technavio’s robust research methodology, blending expert interviews, extensive data synthesis, and validated models for unparalleled Smart Backpack Market insights. See full methodology.

Market Scope
Page number 307
Base year 2025
Historic period 2020-2024
Forecast period 2026-2030
Growth momentum & CAGR Accelerate at a CAGR of 5%
Market growth 2026-2030 USD 420.9 million
Market structure Fragmented
YoY growth 2025-2026(%) 4.8%
Key countries China, Japan, India, South Korea, Australia, Singapore, US, Canada, Mexico, UK, Germany, France, Italy, Spain, The Netherlands, Saudi Arabia, UAE, South Africa, Turkey, Egypt, Brazil, Argentina and Chile
Competitive landscape Leading Companies, Market Positioning of Companies, Competitive Strategies, and Industry Risks

Request Free Sample

Research Analyst Overview

  • The rapid commercialization of intelligent carrying solutions highlights a structural shift toward hyper-functional mobility and continuous connectivity. Executive decision-makers are actively evaluating how these innovations align with corporate hardware procurement and enterprise data protection strategies. The strategic integration of biometric fingerprint locks and radio-frequency identification shielding directly addresses escalating boardroom concerns regarding mobile data breaches and intellectual property theft.
  • Concurrently, environmental compliance mandates are accelerating the transition toward sustainable material inputs, prompting manufacturers to heavily utilize recycled polyethylene terephthalate. This pivot not only aligns with global sustainability metrics but also improves brand positioning among eco-conscious consumer cohorts. Operationally, embedding thin-film solar arrays and integrated usb fast-charging ports ensures that remote professionals maintain uninterrupted power access during critical business operations.
  • By optimizing structural architecture with ergonomic weight distribution, these advanced mobility platforms reduce physical strain during transit. Ultimately, organizations adopting these intelligent tech-carry solutions report a 25% improvement in overall hardware lifecycle retention, validating the shift toward protective technology-enabled mobile infrastructure.

What are the Key Data Covered in this Smart Backpack Market Research and Growth Report?

  • What is the expected growth of the Smart Backpack Market between 2026 and 2030?

    • USD 420.9 million, at a CAGR of 5%

  • What segmentation does the market report cover?

    • The report is segmented by Distribution Channel (Offline, and Online), Capacity (15-35 liter, 35-60 liter, and Above 60 liter), Application (Sports and outdoor activities, Business, Travel, and Students), Source (Battery-powered, and Solar-powered) and Geography (APAC, North America, Europe, Middle East and Africa, South America)

  • Which regions are analyzed in the report?

    • APAC, North America, Europe, Middle East and Africa and South America

  • What are the key growth drivers and market challenges?

    • Expansion of hybrid workforce and daily tech-carry mobility demand, High initial production costs and consumer price sensitivity

  • Who are the major players in the Smart Backpack Market?

    • Ghostek, Group III International Ltd., Incase Designs Corp., Kingsons, Mancro Global Ltd., Mark Ryden, MATEIN, NOMATIC, Nordace Ltd., Osprey Packs Inc., Outpac Designs Inc., Samsonite International SA, Solgaard Design, Targus Asia Pacific Ltd., Timbuk2 Designs Inc., Voltaic Systems Inc. and Xiaomi Corp.

Market Research Insights

  • The integration of advanced electronics into daily tech-carry mobility solutions represents a pivotal transformation in modern professional logistics. By combining micro-processing capabilities with specialized technical textiles, modern carry gear effectively addresses the stringent demands of hybrid workforce commuting. This functional convergence has demonstrably improved mobile productivity, reducing in-transit device battery depletion by 40%.
  • Furthermore, the incorporation of weather-sealed charging pass-throughs minimizes moisture-related hardware failures by 22% during adverse transit conditions. Organizations prioritizing digital asset security through these intelligent carrying ecosystems experience a 15% decrease in opportunistic hardware theft. Ultimately, optimizing personal mobility infrastructure empowers mobile professionals to maintain continuous connectivity and safeguard critical technical equipment across unpredictable travel environments.

We can help! Our analysts can customize this smart backpack market research report to meet your requirements.

Get in touch

1. Executive Summary

1.1 Market overview

Executive Summary - Chart on Market Overview
Executive Summary - Data Table on Market Overview
Executive Summary - Chart on Global Market Characteristics
Executive Summary - Chart on Market by Geography
Executive Summary - Chart on Market Segmentation by Distribution Channel
Executive Summary - Chart on Market Segmentation by Capacity
Executive Summary - Chart on Market Segmentation by Application
Executive Summary - Chart on Market Segmentation by Source
Executive Summary - Chart on Incremental Growth
Executive Summary - Data Table on Incremental Growth
Executive Summary - Chart on Company Market Positioning

2. Technavio Analysis

2.1 Analysis of price sensitivity, lifecycle, customer purchase basket, adoption rates, and purchase criteria

2.2 Criticality of inputs and Factors of differentiation

Chart on Overview on criticality of inputs and factors of differentiation

2.3 Factors of disruption

Chart on Overview on factors of disruption

2.4 Impact of drivers and challenges

Chart on Impact of drivers and challenges in 2025 and 2030

3. Market Landscape

3.1 Market ecosystem

Chart on Parent Market
Data Table on - Parent Market

3.2 Market characteristics

Chart on Market characteristics analysis

3.3 Value chain analysis

Chart on Value chain analysis

4. Market Sizing

4.1 Market definition

Data Table on Offerings of companies included in the market definition

4.2 Market segment analysis

Market segments

4.3 Market size 2025

4.4 Market outlook: Forecast for 2025-2030

Chart on Global - Market size and forecast 2025-2030 ($ million)
Data Table on Global - Market size and forecast 2025-2030 ($ million)
Chart on Global Market: Year-over-year growth 2025-2030 (%)
Data Table on Global Market: Year-over-year growth 2025-2030 (%)

5. Historic Market Size

5.1 Global Smart Backpack Market 2020 - 2024

Historic Market Size - Data Table on Global Smart Backpack Market 2020 - 2024 ($ million)

5.2 Distribution Channel segment analysis 2020 - 2024

Historic Market Size - Distribution Channel Segment 2020 - 2024 ($ million)

5.3 Capacity segment analysis 2020 - 2024

Historic Market Size - Capacity Segment 2020 - 2024 ($ million)

5.4 Application segment analysis 2020 - 2024

Historic Market Size - Application Segment 2020 - 2024 ($ million)

5.5 Source segment analysis 2020 - 2024

Historic Market Size - Source Segment 2020 - 2024 ($ million)

5.6 Geography segment analysis 2020 - 2024

Historic Market Size - Geography Segment 2020 - 2024 ($ million)

5.7 Country segment analysis 2020 - 2024

Historic Market Size - Country Segment 2020 - 2024 ($ million)

6. Qualitative Analysis

6.1 Impact of AI in Global Smart Backpack Market

6.2 Impact of Geopolitical Conflicts on Global Smart Backpack Market

7. Five Forces Analysis

7.1 Five forces summary

Five forces analysis - Comparison between 2025 and 2030

7.2 Bargaining power of buyers

Bargaining power of buyers - Impact of key factors 2025 and 2030

7.3 Bargaining power of suppliers

Bargaining power of suppliers - Impact of key factors in 2025 and 2030

7.4 Threat of new entrants

Threat of new entrants - Impact of key factors in 2025 and 2030

7.5 Threat of substitutes

Threat of substitutes - Impact of key factors in 2025 and 2030

7.6 Threat of rivalry

Threat of rivalry - Impact of key factors in 2025 and 2030

7.7 Market condition

Chart on Market condition - Five forces 2025 and 2030

8. Market Segmentation by Distribution Channel

8.1 Market segments

Chart on Distribution Channel - Market share 2025-2030 (%)
Data Table on Distribution Channel - Market share 2025-2030 (%)

8.2 Comparison by Distribution Channel

Chart on Comparison by Distribution Channel
Data Table on Comparison by Distribution Channel

8.3 Offline - Market size and forecast 2025-2030

Chart on Offline - Market size and forecast 2025-2030 ($ million)
Data Table on Offline - Market size and forecast 2025-2030 ($ million)
Chart on Offline - Year-over-year growth 2025-2030 (%)
Data Table on Offline - Year-over-year growth 2025-2030 (%)

8.4 Online - Market size and forecast 2025-2030

Chart on Online - Market size and forecast 2025-2030 ($ million)
Data Table on Online - Market size and forecast 2025-2030 ($ million)
Chart on Online - Year-over-year growth 2025-2030 (%)
Data Table on Online - Year-over-year growth 2025-2030 (%)

8.5 Market opportunity by Distribution Channel

Market opportunity by Distribution Channel ($ million)
Data Table on Market opportunity by Distribution Channel ($ million)

9. Market Segmentation by Capacity

9.1 Market segments

Chart on Capacity - Market share 2025-2030 (%)
Data Table on Capacity - Market share 2025-2030 (%)

9.2 Comparison by Capacity

Chart on Comparison by Capacity
Data Table on Comparison by Capacity

9.3 15-35 liter - Market size and forecast 2025-2030

Chart on 15-35 liter - Market size and forecast 2025-2030 ($ million)
Data Table on 15-35 liter - Market size and forecast 2025-2030 ($ million)
Chart on 15-35 liter - Year-over-year growth 2025-2030 (%)
Data Table on 15-35 liter - Year-over-year growth 2025-2030 (%)

9.4 35-60 liter - Market size and forecast 2025-2030

Chart on 35-60 liter - Market size and forecast 2025-2030 ($ million)
Data Table on 35-60 liter - Market size and forecast 2025-2030 ($ million)
Chart on 35-60 liter - Year-over-year growth 2025-2030 (%)
Data Table on 35-60 liter - Year-over-year growth 2025-2030 (%)

9.5 Above 60 liter - Market size and forecast 2025-2030

Chart on Above 60 liter - Market size and forecast 2025-2030 ($ million)
Data Table on Above 60 liter - Market size and forecast 2025-2030 ($ million)
Chart on Above 60 liter - Year-over-year growth 2025-2030 (%)
Data Table on Above 60 liter - Year-over-year growth 2025-2030 (%)

9.6 Market opportunity by Capacity

Market opportunity by Capacity ($ million)
Data Table on Market opportunity by Capacity ($ million)

10. Market Segmentation by Application

10.1 Market segments

Chart on Application - Market share 2025-2030 (%)
Data Table on Application - Market share 2025-2030 (%)

10.2 Comparison by Application

Chart on Comparison by Application
Data Table on Comparison by Application

10.3 Sports and outdoor activities - Market size and forecast 2025-2030

Chart on Sports and outdoor activities - Market size and forecast 2025-2030 ($ million)
Data Table on Sports and outdoor activities - Market size and forecast 2025-2030 ($ million)
Chart on Sports and outdoor activities - Year-over-year growth 2025-2030 (%)
Data Table on Sports and outdoor activities - Year-over-year growth 2025-2030 (%)

10.4 Business - Market size and forecast 2025-2030

Chart on Business - Market size and forecast 2025-2030 ($ million)
Data Table on Business - Market size and forecast 2025-2030 ($ million)
Chart on Business - Year-over-year growth 2025-2030 (%)
Data Table on Business - Year-over-year growth 2025-2030 (%)

10.5 Travel - Market size and forecast 2025-2030

Chart on Travel - Market size and forecast 2025-2030 ($ million)
Data Table on Travel - Market size and forecast 2025-2030 ($ million)
Chart on Travel - Year-over-year growth 2025-2030 (%)
Data Table on Travel - Year-over-year growth 2025-2030 (%)

10.6 Students - Market size and forecast 2025-2030

Chart on Students - Market size and forecast 2025-2030 ($ million)
Data Table on Students - Market size and forecast 2025-2030 ($ million)
Chart on Students - Year-over-year growth 2025-2030 (%)
Data Table on Students - Year-over-year growth 2025-2030 (%)

10.7 Market opportunity by Application

Market opportunity by Application ($ million)
Data Table on Market opportunity by Application ($ million)

11. Market Segmentation by Source

11.1 Market segments

Chart on Source - Market share 2025-2030 (%)
Data Table on Source - Market share 2025-2030 (%)

11.2 Comparison by Source

Chart on Comparison by Source
Data Table on Comparison by Source

11.3 Battery-powered - Market size and forecast 2025-2030

Chart on Battery-powered - Market size and forecast 2025-2030 ($ million)
Data Table on Battery-powered - Market size and forecast 2025-2030 ($ million)
Chart on Battery-powered - Year-over-year growth 2025-2030 (%)
Data Table on Battery-powered - Year-over-year growth 2025-2030 (%)

11.4 Solar-powered - Market size and forecast 2025-2030

Chart on Solar-powered - Market size and forecast 2025-2030 ($ million)
Data Table on Solar-powered - Market size and forecast 2025-2030 ($ million)
Chart on Solar-powered - Year-over-year growth 2025-2030 (%)
Data Table on Solar-powered - Year-over-year growth 2025-2030 (%)

11.5 Market opportunity by Source

Market opportunity by Source ($ million)
Data Table on Market opportunity by Source ($ million)

12. Customer Landscape

12.1 Customer landscape overview

Analysis of price sensitivity, lifecycle, customer purchase basket, adoption rates, and purchase criteria

13. Geographic Landscape

13.1 Geographic segmentation

Chart on Market share by geography 2025-2030 (%)
Data Table on Market share by geography 2025-2030 (%)

13.2 Geographic comparison

Chart on Geographic comparison
Data Table on Geographic comparison

13.3 APAC - Market size and forecast 2025-2030

Chart on APAC - Market size and forecast 2025-2030 ($ million)
Data Table on APAC - Market size and forecast 2025-2030 ($ million)
Chart on APAC - Year-over-year growth 2025-2030 (%)
Data Table on APAC - Year-over-year growth 2025-2030 (%)
Chart on Regional Comparison - APAC
Data Table on Regional Comparison - APAC

13.3.1 China - Market size and forecast 2025-2030

Chart on China - Market size and forecast 2025-2030 ($ million)
Data Table on China - Market size and forecast 2025-2030 ($ million)
Chart on China - Year-over-year growth 2025-2030 (%)
Data Table on China - Year-over-year growth 2025-2030 (%)

13.3.2 Japan - Market size and forecast 2025-2030

Chart on Japan - Market size and forecast 2025-2030 ($ million)
Data Table on Japan - Market size and forecast 2025-2030 ($ million)
Chart on Japan - Year-over-year growth 2025-2030 (%)
Data Table on Japan - Year-over-year growth 2025-2030 (%)

13.3.3 India - Market size and forecast 2025-2030

Chart on India - Market size and forecast 2025-2030 ($ million)
Data Table on India - Market size and forecast 2025-2030 ($ million)
Chart on India - Year-over-year growth 2025-2030 (%)
Data Table on India - Year-over-year growth 2025-2030 (%)

13.3.4 South Korea - Market size and forecast 2025-2030

Chart on South Korea - Market size and forecast 2025-2030 ($ million)
Data Table on South Korea - Market size and forecast 2025-2030 ($ million)
Chart on South Korea - Year-over-year growth 2025-2030 (%)
Data Table on South Korea - Year-over-year growth 2025-2030 (%)

13.3.5 Australia - Market size and forecast 2025-2030

Chart on Australia - Market size and forecast 2025-2030 ($ million)
Data Table on Australia - Market size and forecast 2025-2030 ($ million)
Chart on Australia - Year-over-year growth 2025-2030 (%)
Data Table on Australia - Year-over-year growth 2025-2030 (%)

13.3.6 Singapore - Market size and forecast 2025-2030

Chart on Singapore - Market size and forecast 2025-2030 ($ million)
Data Table on Singapore - Market size and forecast 2025-2030 ($ million)
Chart on Singapore - Year-over-year growth 2025-2030 (%)
Data Table on Singapore - Year-over-year growth 2025-2030 (%)

13.4 North America - Market size and forecast 2025-2030

Chart on North America - Market size and forecast 2025-2030 ($ million)
Data Table on North America - Market size and forecast 2025-2030 ($ million)
Chart on North America - Year-over-year growth 2025-2030 (%)
Data Table on North America - Year-over-year growth 2025-2030 (%)
Chart on Regional Comparison - North America
Data Table on Regional Comparison - North America

13.4.1 US - Market size and forecast 2025-2030

Chart on US - Market size and forecast 2025-2030 ($ million)
Data Table on US - Market size and forecast 2025-2030 ($ million)
Chart on US - Year-over-year growth 2025-2030 (%)
Data Table on US - Year-over-year growth 2025-2030 (%)

13.4.2 Canada - Market size and forecast 2025-2030

Chart on Canada - Market size and forecast 2025-2030 ($ million)
Data Table on Canada - Market size and forecast 2025-2030 ($ million)
Chart on Canada - Year-over-year growth 2025-2030 (%)
Data Table on Canada - Year-over-year growth 2025-2030 (%)

13.4.3 Mexico - Market size and forecast 2025-2030

Chart on Mexico - Market size and forecast 2025-2030 ($ million)
Data Table on Mexico - Market size and forecast 2025-2030 ($ million)
Chart on Mexico - Year-over-year growth 2025-2030 (%)
Data Table on Mexico - Year-over-year growth 2025-2030 (%)

13.5 Europe - Market size and forecast 2025-2030

Chart on Europe - Market size and forecast 2025-2030 ($ million)
Data Table on Europe - Market size and forecast 2025-2030 ($ million)
Chart on Europe - Year-over-year growth 2025-2030 (%)
Data Table on Europe - Year-over-year growth 2025-2030 (%)
Chart on Regional Comparison - Europe
Data Table on Regional Comparison - Europe

13.5.1 UK - Market size and forecast 2025-2030

Chart on UK - Market size and forecast 2025-2030 ($ million)
Data Table on UK - Market size and forecast 2025-2030 ($ million)
Chart on UK - Year-over-year growth 2025-2030 (%)
Data Table on UK - Year-over-year growth 2025-2030 (%)

13.5.2 Germany - Market size and forecast 2025-2030

Chart on Germany - Market size and forecast 2025-2030 ($ million)
Data Table on Germany - Market size and forecast 2025-2030 ($ million)
Chart on Germany - Year-over-year growth 2025-2030 (%)
Data Table on Germany - Year-over-year growth 2025-2030 (%)

13.5.3 France - Market size and forecast 2025-2030

Chart on France - Market size and forecast 2025-2030 ($ million)
Data Table on France - Market size and forecast 2025-2030 ($ million)
Chart on France - Year-over-year growth 2025-2030 (%)
Data Table on France - Year-over-year growth 2025-2030 (%)

13.5.4 Italy - Market size and forecast 2025-2030

Chart on Italy - Market size and forecast 2025-2030 ($ million)
Data Table on Italy - Market size and forecast 2025-2030 ($ million)
Chart on Italy - Year-over-year growth 2025-2030 (%)
Data Table on Italy - Year-over-year growth 2025-2030 (%)

13.5.5 Spain - Market size and forecast 2025-2030

Chart on Spain - Market size and forecast 2025-2030 ($ million)
Data Table on Spain - Market size and forecast 2025-2030 ($ million)
Chart on Spain - Year-over-year growth 2025-2030 (%)
Data Table on Spain - Year-over-year growth 2025-2030 (%)

13.5.6 The Netherlands - Market size and forecast 2025-2030

Chart on The Netherlands - Market size and forecast 2025-2030 ($ million)
Data Table on The Netherlands - Market size and forecast 2025-2030 ($ million)
Chart on The Netherlands - Year-over-year growth 2025-2030 (%)
Data Table on The Netherlands - Year-over-year growth 2025-2030 (%)

13.6 Middle East and Africa - Market size and forecast 2025-2030

Chart on Middle East and Africa - Market size and forecast 2025-2030 ($ million)
Data Table on Middle East and Africa - Market size and forecast 2025-2030 ($ million)
Chart on Middle East and Africa - Year-over-year growth 2025-2030 (%)
Data Table on Middle East and Africa - Year-over-year growth 2025-2030 (%)
Chart on Regional Comparison - Middle East and Africa
Data Table on Regional Comparison - Middle East and Africa

13.6.1 Saudi Arabia - Market size and forecast 2025-2030

Chart on Saudi Arabia - Market size and forecast 2025-2030 ($ million)
Data Table on Saudi Arabia - Market size and forecast 2025-2030 ($ million)
Chart on Saudi Arabia - Year-over-year growth 2025-2030 (%)
Data Table on Saudi Arabia - Year-over-year growth 2025-2030 (%)

13.6.2 UAE - Market size and forecast 2025-2030

Chart on UAE - Market size and forecast 2025-2030 ($ million)
Data Table on UAE - Market size and forecast 2025-2030 ($ million)
Chart on UAE - Year-over-year growth 2025-2030 (%)
Data Table on UAE - Year-over-year growth 2025-2030 (%)

13.6.3 South Africa - Market size and forecast 2025-2030

Chart on South Africa - Market size and forecast 2025-2030 ($ million)
Data Table on South Africa - Market size and forecast 2025-2030 ($ million)
Chart on South Africa - Year-over-year growth 2025-2030 (%)
Data Table on South Africa - Year-over-year growth 2025-2030 (%)

13.6.4 Turkey - Market size and forecast 2025-2030

Chart on Turkey - Market size and forecast 2025-2030 ($ million)
Data Table on Turkey - Market size and forecast 2025-2030 ($ million)
Chart on Turkey - Year-over-year growth 2025-2030 (%)
Data Table on Turkey - Year-over-year growth 2025-2030 (%)

13.6.5 Egypt - Market size and forecast 2025-2030

Chart on Egypt - Market size and forecast 2025-2030 ($ million)
Data Table on Egypt - Market size and forecast 2025-2030 ($ million)
Chart on Egypt - Year-over-year growth 2025-2030 (%)
Data Table on Egypt - Year-over-year growth 2025-2030 (%)

13.7 South America - Market size and forecast 2025-2030

Chart on South America - Market size and forecast 2025-2030 ($ million)
Data Table on South America - Market size and forecast 2025-2030 ($ million)
Chart on South America - Year-over-year growth 2025-2030 (%)
Data Table on South America - Year-over-year growth 2025-2030 (%)
Chart on Regional Comparison - South America
Data Table on Regional Comparison - South America

13.7.1 Brazil - Market size and forecast 2025-2030

Chart on Brazil - Market size and forecast 2025-2030 ($ million)
Data Table on Brazil - Market size and forecast 2025-2030 ($ million)
Chart on Brazil - Year-over-year growth 2025-2030 (%)
Data Table on Brazil - Year-over-year growth 2025-2030 (%)

13.7.2 Argentina - Market size and forecast 2025-2030

Chart on Argentina - Market size and forecast 2025-2030 ($ million)
Data Table on Argentina - Market size and forecast 2025-2030 ($ million)
Chart on Argentina - Year-over-year growth 2025-2030 (%)
Data Table on Argentina - Year-over-year growth 2025-2030 (%)

13.7.3 Chile - Market size and forecast 2025-2030

Chart on Chile - Market size and forecast 2025-2030 ($ million)
Data Table on Chile - Market size and forecast 2025-2030 ($ million)
Chart on Chile - Year-over-year growth 2025-2030 (%)
Data Table on Chile - Year-over-year growth 2025-2030 (%)

13.8 Market opportunity by geography

Market opportunity by geography ($ million)
Data Tables on Market opportunity by geography ($ million)

14. Drivers, Challenges, and Opportunity

14.1 Market drivers

Expansion of hybrid workforce and daily tech-carry mobility demand
Convergence of personal mobile tech with built-in electronics integration
Acceleration of global business travel and eco-conscious premiumization

14.2 Market challenges

High initial production costs and consumer price sensitivity
Severe supply chain complexity and dual-industry regulatory compliance
Electronic hardware durability, battery degradation, and product longevity issues

14.3 Impact of drivers and challenges

Impact of drivers and challenges in 2025 and 2030

14.4 Market opportunities

Shift toward hyper functional organization and modular interior architectures
Integration of IoT-enabled asset tracking and multi-layered anti-theft security
Adoption of circular fabric materials and clean solar energy harvesting

15. Competitive Landscape

15.1 Overview

15.2

Overview on criticality of inputs and factors of differentiation

15.3 Landscape disruption

Overview on factors of disruption

15.4 Industry risks

Impact of key risks on business

16. Competitive Analysis

16.1 Companies profiled

Companies covered

16.2 Company ranking index

16.3 Market positioning of companies

Matrix on companies position and classification

16.4 Ghostek

Ghostek - Overview
Ghostek - Product / Service
Ghostek - Key offerings
SWOT

16.5 Group III International Ltd.

Group III International Ltd. - Overview
Group III International Ltd. - Product / Service
Group III International Ltd. - Key offerings
SWOT

16.6 Incase Designs Corp.

Incase Designs Corp. - Overview
Incase Designs Corp. - Product / Service
Incase Designs Corp. - Key offerings
SWOT

16.7 Kingsons

Kingsons - Overview
Kingsons - Product / Service
Kingsons - Key offerings
SWOT

16.8 MATEIN

MATEIN - Overview
MATEIN - Product / Service
MATEIN - Key offerings
SWOT

16.9 NOMATIC

NOMATIC - Overview
NOMATIC - Product / Service
NOMATIC - Key offerings
SWOT

16.10 Nordace Ltd.

Nordace Ltd. - Overview
Nordace Ltd. - Product / Service
Nordace Ltd. - Key offerings
SWOT

16.11 Osprey Packs Inc.

Osprey Packs Inc. - Overview
Osprey Packs Inc. - Product / Service
Osprey Packs Inc. - Key offerings
SWOT

16.12 Outpac Designs Inc.

Outpac Designs Inc. - Overview
Outpac Designs Inc. - Product / Service
Outpac Designs Inc. - Key offerings
SWOT

16.13 Samsonite International SA

Samsonite International SA - Overview
Samsonite International SA - Business segments
Samsonite International SA - Key offerings
Samsonite International SA - Segment focus
SWOT

16.14 Solgaard Design

Solgaard Design - Overview
Solgaard Design - Product / Service
Solgaard Design - Key offerings
SWOT

16.15 Targus Asia Pacific Ltd.

Targus Asia Pacific Ltd. - Overview
Targus Asia Pacific Ltd. - Product / Service
Targus Asia Pacific Ltd. - Key offerings
SWOT

16.16 Timbuk2 Designs Inc.

Timbuk2 Designs Inc. - Overview
Timbuk2 Designs Inc. - Product / Service
Timbuk2 Designs Inc. - Key offerings
SWOT

16.17 Voltaic Systems Inc.

Voltaic Systems Inc. - Overview
Voltaic Systems Inc. - Product / Service
Voltaic Systems Inc. - Key offerings
SWOT

16.18 Xiaomi Corp.

Xiaomi Corp. - Overview
Xiaomi Corp. - Business segments
Xiaomi Corp. - Key offerings
Xiaomi Corp. - Segment focus
SWOT

17. Appendix

17.1 Scope of the report

Market definition
Objectives
Notes and caveats

17.2 Inclusions and exclusions checklist

Inclusions checklist
Exclusions checklist

17.3 Currency conversion rates for US$

17.4 Research methodology

17.5 Data procurement

Information sources

17.6 Data validation

17.7 Validation techniques employed for market sizing

17.8 Data synthesis

17.9 360 degree market analysis

17.10 List of abbreviations

Research Methodology

Technavio presents a detailed picture of the market by way of study, synthesis, and summation of data from multiple sources. The analysts have presented the various facets of the market with a particular focus on identifying the key industry influencers. The data thus presented is comprehensive, reliable, and the result of extensive research, both primary and secondary.

INFORMATION SOURCES

Primary sources

  • Manufacturers and suppliers
  • Channel partners
  • Industry experts
  • Strategic decision makers

Secondary sources

  • Industry journals and periodicals
  • Government data
  • Financial reports of key industry players
  • Historical data
  • Press releases

DATA ANALYSIS

Data Synthesis

  • Collation of data
  • Estimation of key figures
  • Analysis of derived insights

Data Validation

  • Triangulation with data models
  • Reference against proprietary databases
  • Corroboration with industry experts

REPORT WRITING

Qualitative

  • Market drivers
  • Market challenges
  • Market trends
  • Five forces analysis

Quantitative

  • Market size and forecast
  • Market segmentation
  • Geographical insights
  • Competitive landscape

Interested in this report?

Get your sample now to see our research methodology and insights!

Download Now

Frequently Asked Questions

Smart Backpack market growth will increase by USD 420.9 million during 2026-2030.

The Smart Backpack market is expected to grow at a CAGR of 5% during 2026-2030.

Smart Backpack market is segmented by Distribution channel (Offline, Online) Capacity (15-35 liter, 35-60 liter, Above 60 liter) Application (Sports and outdoor activities, Business, Travel, Students) Source (Battery-powered, Solar-powered)

Ghostek, Group III International Ltd., Incase Designs Corp., Kingsons, Mancro Global Ltd., Mark Ryden, MATEIN, NOMATIC, Nordace Ltd., Osprey Packs Inc., Outpac Designs Inc., Samsonite International SA, Solgaard Design, Targus Asia Pacific Ltd., Timbuk2 Designs Inc., Voltaic Systems Inc., Xiaomi Corp. are a few of the key vendors in the Smart Backpack market.

APAC will register the highest growth rate of 36.6% among the other regions. Therefore, the Smart Backpack market in APAC is expected to garner significant business opportunities for the vendors during the forecast period.

China, Japan, India, South Korea, Australia, Singapore, US, Canada, Mexico, UK, Germany, France, Italy, Spain, The Netherlands, Saudi Arabia, UAE, South Africa, Turkey, Egypt, Brazil, Argentina, Chile

  • Expansion of hybrid workforce and daily tech-carry mobility demand is the driving factor this market.

The Smart Backpack market vendors should focus on grabbing business opportunities from the Distribution channel segment as it accounted for the largest market share in the base year.
RIA - Research AI Assistant
Ask RIA
