Secondary Battery Market Analysis, Size, and Forecast 2026-2030: APAC (China, Japan, and India), Europe (Germany, UK, and France), North America (US, Canada, and Mexico), Middle East and Africa (Saudi Arabia, UAE, and South Africa), South America (Brazil and Argentina), and Rest of World (ROW)

Secondary Battery Market Analysis, Size, and Forecast 2026-2030:
APAC (China, Japan, and India), Europe (Germany, UK, and France), North America (US, Canada, and Mexico), Middle East and Africa (Saudi Arabia, UAE, and South Africa), South America (Brazil and Argentina), and Rest of World (ROW)

Published: May 2026 306 Pages SKU: IRTNTR40336

Market Overview at a Glance

$52561.8 B
Market Opportunity
27.3%
CAGR 2025 - 2030
46.6%
APAC Growth
$15968.9 B
Lead-acid segment 2024

Secondary Battery Market Size 2026-2030

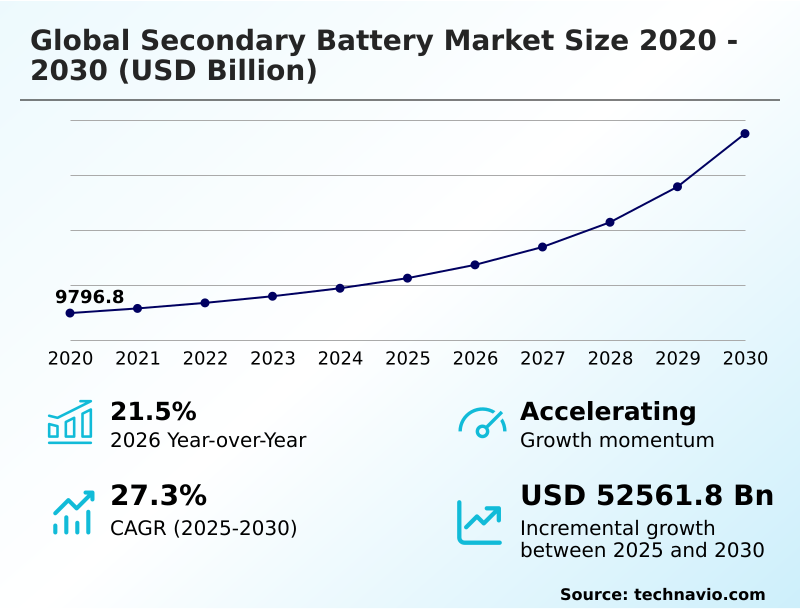
The secondary battery market size is valued to increase by USD 52561.8 billion, at a CAGR of 27.3% from 2025 to 2030. Rising demand for electric vehicles worldwide will drive the secondary battery market.

Major Market Trends & Insights

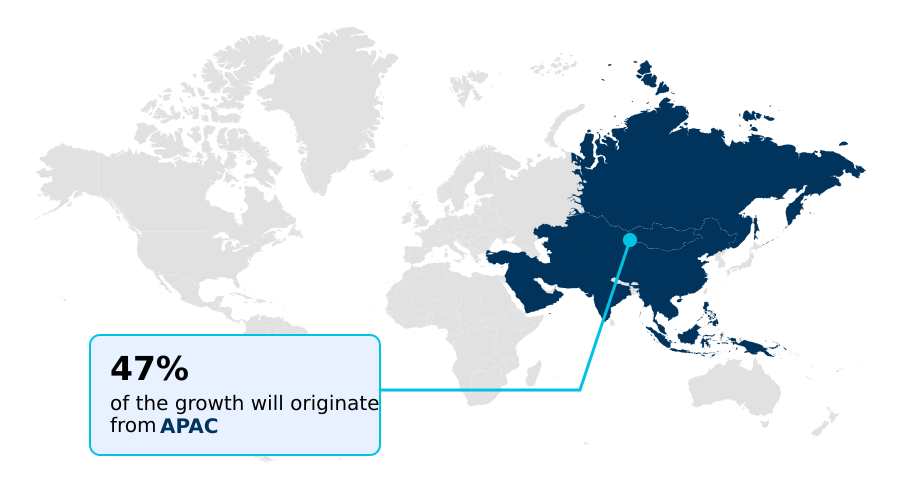
  • APAC dominated the market and accounted for a 46.6% growth during the forecast period.
  • By Technology - Lead-acid segment was valued at USD 15968.9 billion in 2024
  • By Application - Automotive batteries segment accounted for the largest market revenue share in 2024

Market Size & Forecast

  • Market Opportunities: USD 65258.6 billion
  • Market Future Opportunities: USD 52561.8 billion
  • CAGR from 2025 to 2030 : 27.3%

Market Summary

  • The secondary battery market is undergoing a significant transformation, driven by the convergence of energy transition and technological innovation. The imperative for efficient energy storage solutions is escalating, particularly with the global push toward electric mobility and renewable energy integration.
  • High energy density lithium ion batteries have become the cornerstone of this shift, powering everything from consumer electronics to large-scale battery energy storage systems that ensure grid stability.
  • A key business scenario involves logistics companies transitioning their fleets to electric vehicles; this requires not just the procurement of EVs, but a strategic investment in on-site fast charging batteries and sophisticated battery management systems to minimize downtime and optimize charging schedules based on energy tariffs, thereby impacting operational budgets and sustainability reporting.
  • This transition highlights the market's complexity, where performance metrics like cycle life and thermal management are as critical as the initial cost. The supply chain for these rechargeable battery systems is also evolving, with an increased focus on battery recycling and material recovery to mitigate raw material volatility.
  • This circular economy approach is becoming a critical component of long-term strategy for market participants.

What will be the Size of the Secondary Battery Market during the forecast period?

Get Key Insights on Market Forecast (PDF) Request Free Sample

How is the Secondary Battery Market Segmented?

The secondary battery industry research report provides comprehensive data (region-wise segment analysis), with forecasts and estimates in "USD billion" for the period 2026-2030, as well as historical data from 2020-2024 for the following segments.

  • Technology
    • Lead-acid
    • Lithium-ion
    • Others
  • Application
    • Automotive batteries
    • Industrial batteries
    • Portable batteries
    • Others
  • End-user
    • Residential
    • Commercial
    • Industrial
    • Utilities
  • Geography
    • APAC
      • China
      • Japan
      • India
    • Europe
      • Germany
      • UK
      • France
    • North America
      • US
      • Canada
      • Mexico
    • Middle East and Africa
      • Saudi Arabia
      • UAE
      • South Africa
    • South America
      • Brazil
      • Argentina
    • Rest of World (ROW)

By Technology Insights

The lead-acid segment is estimated to witness significant growth during the forecast period.

The market's segmentation reflects a diverse technological landscape where established and emerging solutions coexist.

The lead-acid battery systems segment, for instance, remains a vital component of the energy storage infrastructure, particularly for automotive lead acid batteries and industrial battery solutions requiring a reliable uninterruptible power supply.

While advanced battery technologies are gaining ground, this rechargeable battery format is critical for stationary energy storage and power grid stabilization.

Efforts are underway to improve battery reuse solutions for this segment, enhancing its sustainability profile within the broader market, where some facilities report recovery efficiencies over 90%.

Request Free Sample

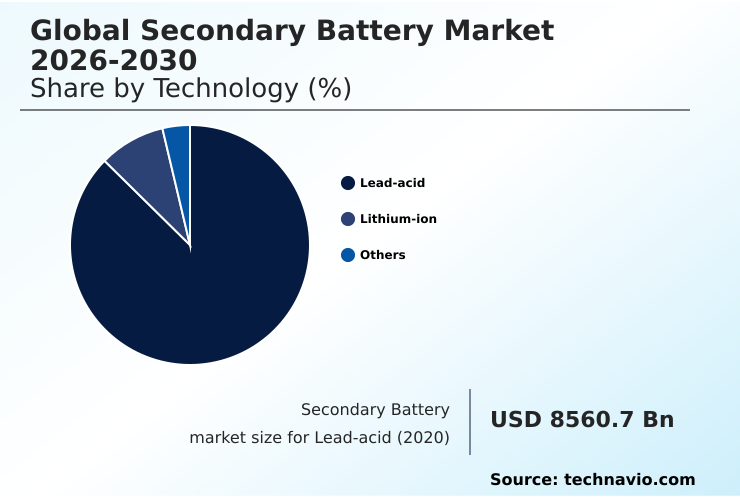
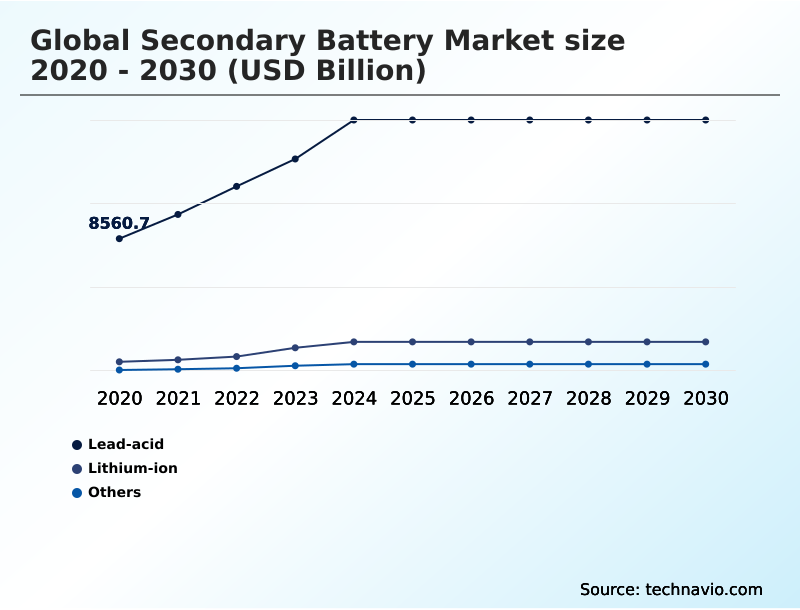
The Lead-acid segment was valued at USD 15968.9 billion in 2024 and showed a gradual increase during the forecast period.

Request Free Sample

Regional Analysis

APAC is estimated to contribute 46.6% to the growth of the global market during the forecast period.Technavio’s analysts have elaborately explained the regional trends and drivers that shape the market during the forecast period.

See How Secondary Battery Market Demand is Rising in APAC Request Free Sample

The geographic landscape is characterized by dominant manufacturing hubs in APAC, which accounts for over 46% of the incremental growth. This region excels in the production of lithium ion batteries, including prismatic lithium ion batteries for automotive battery packs.

North America and Europe are rapidly expanding their domestic capacities for rechargeable power systems to support industrial energy storage and electric mobility.

Key regions are differentiated by their focus on specific battery performance metrics, such as extending cycle life in utility-scale applications or boosting energy density for consumer electronics.

This regional specialization shapes the global supply of secondary battery technologies and their components.

Market Dynamics

Our researchers analyzed the data with 2025 as the base year, along with the key drivers, trends, and challenges. A holistic analysis of drivers will help companies refine their marketing strategies to gain a competitive advantage.

  • A detailed analysis of advancements in high energy density battery cell development reveals a market intensely focused on performance gains for electric mobility and electronics. However, the impact of raw material prices on battery production remains a significant variable influencing cost structures across the industry.
  • The secondary battery market segmentation by technology highlights the ongoing competition and distinct use cases when making a comparison of lead acid and lithium ion technologies. Concurrently, the secondary battery market segmentation by application shows how tailored solutions are created for automotive, industrial, and portable uses.
  • Key strategies for improving battery reuse efficiency are becoming integral to corporate sustainability goals, though significant challenges in developing battery recycling infrastructure persist globally. The fundamental role of secondary batteries in renewable integration cannot be overstated, as they are essential for grid support.
  • Innovations in thermal management for battery safety and optimizing battery management for extended cycle life are top R&D priorities. Furthermore, developments in solid state battery for electric vehicles and advancements in silicon anode lithium ion technology promise transformative changes. Secondary battery applications in industrial automation and understanding the growth factors for portable battery technologies reveal niche opportunities.
  • Analysis shows that residential energy storage adoption trends are accelerating, while commercial peak load management with batteries offers clear ROI. Utility scale energy storage for grid support and trends in ess battery systems for commercial use are governed by evolving secondary battery safety standards and regulations.
  • The economic viability of battery material recovery is improving, with some advanced processes showing a 20% higher yield in valuable materials compared to older methods, directly influencing supply chain strategies.

What are the key market drivers leading to the rise in the adoption of Secondary Battery Industry?

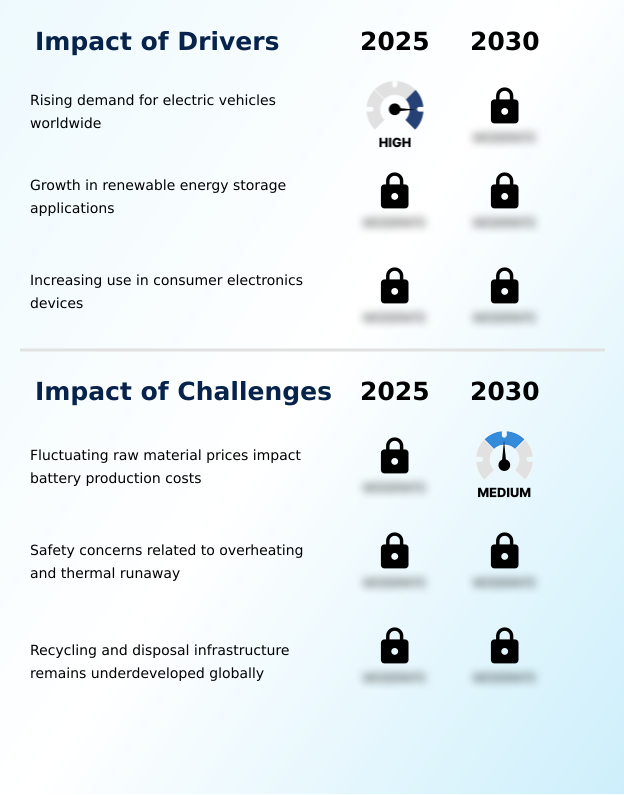
  • The rising demand for electric vehicles worldwide is a primary driver for the market, accelerating the need for high-performance rechargeable batteries.

  • Market growth is fundamentally driven by the accelerating electric vehicle adoption and the integration of renewable energy storage. The demand for lithium ion batteries is surging, underpinning the expansion of battery energy storage systems that are crucial for grid stability.
  • These energy storage solutions range from utility scale battery storage projects to decentralized energy storage in commercial buildings, improving energy resilience by 30%. The proliferation of consumer electronics devices further fuels demand.
  • Meanwhile, breakthroughs like silicon anode lithium ion technology are enhancing performance, making electrification more viable across all sectors and applications.

What are the market trends shaping the Secondary Battery Industry?

  • Advancements in solid-state battery technology development represent a significant trend. The industry is moving toward safer and more efficient energy storage solutions.

  • Key trends are shaping the future of high performance energy storage, with a significant push toward solid state battery development. These advanced energy storage systems promise enhanced safety and higher energy density, transforming applications from ev battery systems to portable energy solutions.
  • Innovations in cell chemistry, such as improved lithium iron phosphate formulations, are enabling fast charging batteries that meet consumer expectations. The adoption of home energy storage systems is also accelerating, with these units becoming 25% more compact while offering the same capacity. This shift reflects a market-wide demand for more efficient and safer technologies.

What challenges does the Secondary Battery Industry face during its growth?

  • Fluctuating raw material prices present a key challenge, directly impacting battery production costs and market stability.

  • Significant challenges persist, particularly concerning the battery supply chain and volatile battery manufacturing costs. Mitigating the risk of thermal runaway through advanced thermal management systems remains a top priority, as incidents can undermine consumer confidence.
  • The infrastructure for battery recycling and effective battery material recovery is still maturing, creating bottlenecks for ess battery systems and lithium ion polymer batteries used in industrial energy storage. Effective battery management systems are critical, not only for safety but also for maximizing efficiency, with advanced systems reducing energy waste by up to 15% during charging cycles.

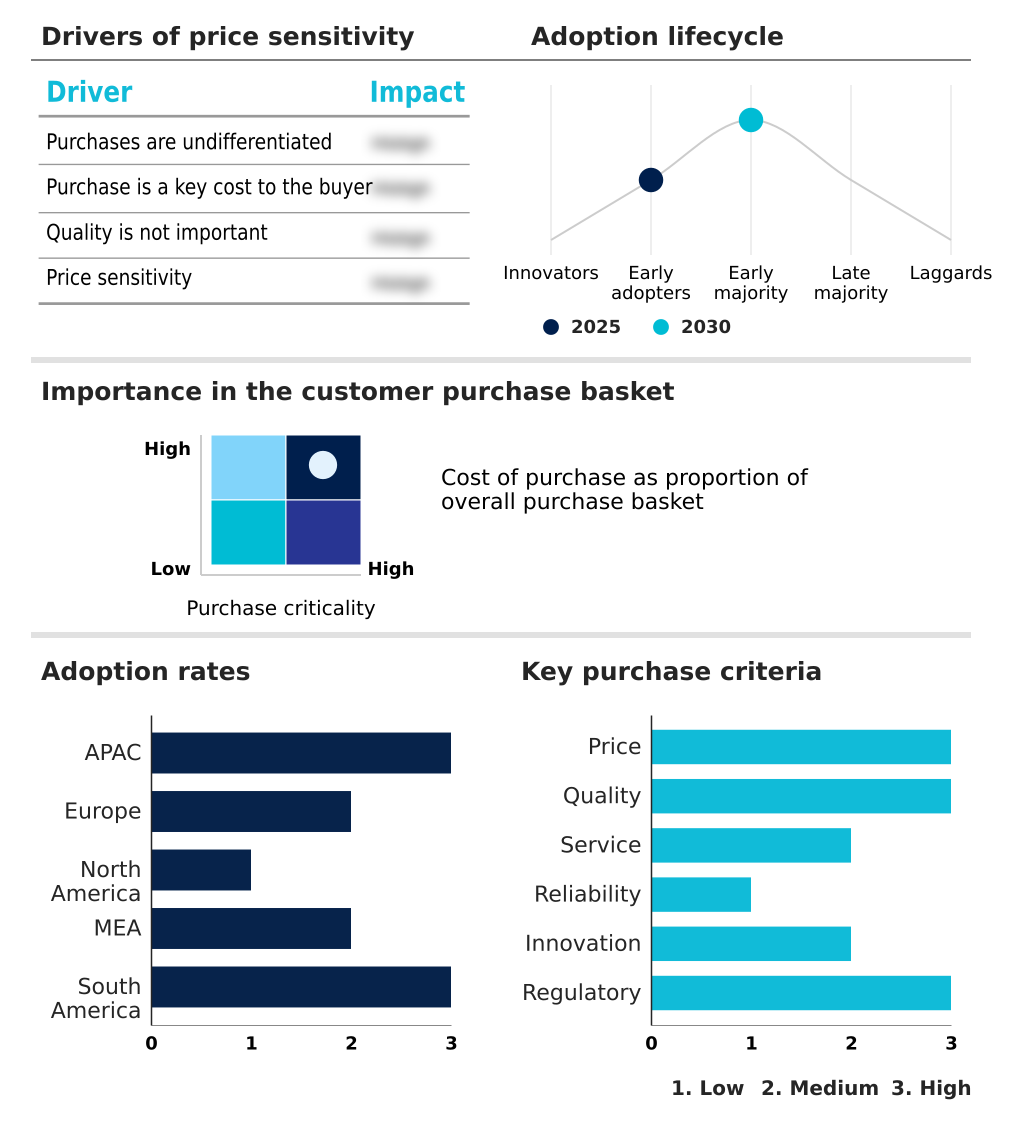
Exclusive Technavio Analysis on Customer Landscape

The secondary battery market forecasting report includes the adoption lifecycle of the market, covering from the innovator’s stage to the laggard’s stage. It focuses on adoption rates in different regions based on penetration. Furthermore, the secondary battery market report also includes key purchase criteria and drivers of price sensitivity to help companies evaluate and develop their market growth analysis strategies.

Customer Landscape of Secondary Battery Industry

Competitive Landscape

Companies are implementing various strategies, such as strategic alliances, secondary battery market forecast, partnerships, mergers and acquisitions, geographical expansion, and product/service launches, to enhance their presence in the industry.

A123 Systems LLC - Offerings include advanced lithium iron phosphate batteries and modular systems, pivotal for high-performance energy storage applications.

The industry research and growth report includes detailed analyses of the competitive landscape of the market and information about key companies, including:

  • A123 Systems LLC
  • AESC Group
  • Alliance Francaise d Atlanta
  • Amprius Technologies Inc.
  • BYD Co. Ltd.
  • CALB Group Co. Ltd.
  • CLARIOS LLC
  • Contemporary Amperex Ltd.
  • Discover Battery
  • EnerSys
  • EVE Energy Co. Ltd.
  • GS Yuasa International Ltd.
  • LG Energy Solution Ltd.
  • Lithium Werks
  • Murata Manufacturing Co. Ltd.
  • Northvolt AB
  • Panasonic Holdings Corp.
  • Samsung SDI Co. Ltd.
  • Toshiba Corp.
  • VARTA AG

Qualitative and quantitative analysis of companies has been conducted to help clients understand the wider business environment as well as the strengths and weaknesses of key industry players. Data is qualitatively analyzed to categorize companies as pure play, category-focused, industry-focused, and diversified; it is quantitatively analyzed to categorize companies as dominant, leading, strong, tentative, and weak.

Recent Development and News in Secondary battery market

  • In March, 2025, Albemarle Corporation highlighted continued volatility in lithium prices due to shifting global demand and supply imbalances, impacting battery manufacturing costs across industries.
  • In June, 2025, Redwood Materials announced expansion plans for its battery recycling operations to address growing volumes of end-of-life lithium ion batteries and improve material recovery efficiency.
  • In July, 2025, Samsung SDI announced advancements in high energy density battery cell development aimed at improving fast charging performance and extending battery life for electric vehicles and consumer electronics.
  • In September, 2025, Apple reported increased production of next generation devices with improved battery efficiency and optimized energy consumption systems, reflecting the continuous demand for advanced secondary batteries in consumer electronics.

Dive into Technavio’s robust research methodology, blending expert interviews, extensive data synthesis, and validated models for unparalleled Secondary Battery Market insights. See full methodology.

Market Scope
Page number 306
Base year 2025
Historic period 2020-2024
Forecast period 2026-2030
Growth momentum & CAGR Accelerate at a CAGR of 27.3%
Market growth 2026-2030 USD 52561.8 billion
Market structure Fragmented
YoY growth 2025-2026(%) 21.5%
Key countries China, Japan, India, South Korea, Australia, Indonesia, Germany, UK, France, Italy, Spain, The Netherlands, US, Canada, Mexico, Saudi Arabia, UAE, South Africa, Israel, Turkey, Brazil, Argentina and Chile
Competitive landscape Leading Companies, Market Positioning of Companies, Competitive Strategies, and Industry Risks

Request Free Sample

Research Analyst Overview

  • From a research perspective, the market is defined by the interplay between various secondary battery types, from legacy lead acid battery systems to advanced battery technologies. The push for high energy density is relentless, driving innovation in cell chemistry for both lithium ion batteries and emerging solid state battery concepts.
  • Battery management systems are increasingly sophisticated, crucial for optimizing cycle life and preventing thermal runaway. In the automotive sector, solutions range from traditional automotive lead acid batteries to advanced prismatic lithium ion batteries and silicon anode lithium ion formats. For stationary applications, battery energy storage systems, including ess battery systems, are fundamental for grid stability.
  • The evolution of lithium iron phosphate and lithium ion polymer batteries continues to expand application possibilities. A critical boardroom consideration is the lifecycle of these assets; with battery recycling now achieving over 90% material recovery in some streams, it is becoming a mandatory component of sustainable operational planning.

What are the Key Data Covered in this Secondary Battery Market Research and Growth Report?

  • What is the expected growth of the Secondary Battery Market between 2026 and 2030?

    • USD 52561.8 billion, at a CAGR of 27.3%

  • What segmentation does the market report cover?

    • The report is segmented by Technology (Lead-acid, Lithium-ion, and Others), Application (Automotive batteries, Industrial batteries, Portable batteries, and Others), End-user (Residential, Commercial, Industrial, and Utilities) and Geography (APAC, Europe, North America, Middle East and Africa, South America)

  • Which regions are analyzed in the report?

    • APAC, Europe, North America, Middle East and Africa and South America

  • What are the key growth drivers and market challenges?

    • Rising demand for electric vehicles worldwide, Fluctuating raw material prices impact battery production costs

  • Who are the major players in the Secondary Battery Market?

    • A123 Systems LLC, AESC Group, Alliance Francaise d Atlanta, Amprius Technologies Inc., BYD Co. Ltd., CALB Group Co. Ltd., CLARIOS LLC, Contemporary Amperex Ltd., Discover Battery, EnerSys, EVE Energy Co. Ltd., GS Yuasa International Ltd., LG Energy Solution Ltd., Lithium Werks, Murata Manufacturing Co. Ltd., Northvolt AB, Panasonic Holdings Corp., Samsung SDI Co. Ltd., Toshiba Corp. and VARTA AG

Market Research Insights

  • The market's dynamics are shaped by key demand drivers, including widespread electric vehicle adoption and the growth of renewable energy storage. The need for high performance energy storage is driving investment in energy storage infrastructure, from utility scale battery storage to decentralized energy storage solutions.
  • For industrial battery solutions and ev battery systems, optimized thermal management systems can improve efficiency by 15%. The battery supply chain is under pressure to meet demand, with battery manufacturing costs being a critical factor. Innovations in battery material recovery are supporting battery reuse solutions and improving the economics of rechargeable power systems.
  • Home energy storage systems and portable energy solutions for consumer electronics devices also represent significant segments, where battery performance metrics are key. Overall, advanced energy storage technologies are enabling a transition toward more resilient power systems, reducing reliance on traditional uninterruptible power supply setups and enhancing power grid stabilization.

We can help! Our analysts can customize this secondary battery market research report to meet your requirements.

Get in touch

1. Executive Summary

1.1 Market overview

Executive Summary - Chart on Market Overview
Executive Summary - Data Table on Market Overview
Executive Summary - Chart on Global Market Characteristics
Executive Summary - Chart on Market by Geography
Executive Summary - Chart on Market Segmentation by Technology
Executive Summary - Chart on Market Segmentation by Application
Executive Summary - Chart on Market Segmentation by End-user
Executive Summary - Chart on Incremental Growth
Executive Summary - Data Table on Incremental Growth
Executive Summary - Chart on Company Market Positioning

2. Technavio Analysis

2.1 Analysis of price sensitivity, lifecycle, customer purchase basket, adoption rates, and purchase criteria

2.2 Criticality of inputs and Factors of differentiation

Chart on Overview on criticality of inputs and factors of differentiation

2.3 Factors of disruption

Chart on Overview on factors of disruption

2.4 Impact of drivers and challenges

Chart on Impact of drivers and challenges in 2025 and 2030

3. Market Landscape

3.1 Market ecosystem

Chart on Parent Market
Data Table on - Parent Market

3.2 Market characteristics

Chart on Market characteristics analysis

3.3 Value chain analysis

Chart on Value chain analysis

4. Market Sizing

4.1 Market definition

Data Table on Offerings of companies included in the market definition

4.2 Market segment analysis

Market segments

4.3 Market size 2025

4.4 Market outlook: Forecast for 2025-2030

Chart on Global - Market size and forecast 2025-2030 ($ billion)
Data Table on Global - Market size and forecast 2025-2030 ($ billion)
Chart on Global Market: Year-over-year growth 2025-2030 (%)
Data Table on Global Market: Year-over-year growth 2025-2030 (%)

5. Historic Market Size

5.1 Global Secondary Battery Market 2020 - 2024

Historic Market Size - Data Table on Global Secondary Battery Market 2020 - 2024 ($ billion)

5.2 Technology segment analysis 2020 - 2024

Historic Market Size - Technology Segment 2020 - 2024 ($ billion)

5.3 Application segment analysis 2020 - 2024

Historic Market Size - Application Segment 2020 - 2024 ($ billion)

5.4 End-user segment analysis 2020 - 2024

Historic Market Size - End-user Segment 2020 - 2024 ($ billion)

5.5 Geography segment analysis 2020 - 2024

Historic Market Size - Geography Segment 2020 - 2024 ($ billion)

5.6 Country segment analysis 2020 - 2024

Historic Market Size - Country Segment 2020 - 2024 ($ billion)

6. Qualitative Analysis

6.1 Impact of AI on Global Secondary Battery Market

6.2 Impact of Geopolitical Conflicts on Global Secondary Battery Market

7. Five Forces Analysis

7.1 Five forces summary

Five forces analysis - Comparison between 2025 and 2030

7.2 Bargaining power of buyers

Bargaining power of buyers - Impact of key factors 2025 and 2030

7.3 Bargaining power of suppliers

Bargaining power of suppliers - Impact of key factors in 2025 and 2030

7.4 Threat of new entrants

Threat of new entrants - Impact of key factors in 2025 and 2030

7.5 Threat of substitutes

Threat of substitutes - Impact of key factors in 2025 and 2030

7.6 Threat of rivalry

Threat of rivalry - Impact of key factors in 2025 and 2030

7.7 Market condition

Chart on Market condition - Five forces 2025 and 2030

8. Market Segmentation by Technology

8.1 Market segments

Chart on Technology - Market share 2025-2030 (%)
Data Table on Technology - Market share 2025-2030 (%)

8.2 Comparison by Technology

Chart on Comparison by Technology
Data Table on Comparison by Technology

8.3 Lead-acid - Market size and forecast 2025-2030

Chart on Lead-acid - Market size and forecast 2025-2030 ($ billion)
Data Table on Lead-acid - Market size and forecast 2025-2030 ($ billion)
Chart on Lead-acid - Year-over-year growth 2025-2030 (%)
Data Table on Lead-acid - Year-over-year growth 2025-2030 (%)

8.4 Lithium-ion - Market size and forecast 2025-2030

Chart on Lithium-ion - Market size and forecast 2025-2030 ($ billion)
Data Table on Lithium-ion - Market size and forecast 2025-2030 ($ billion)
Chart on Lithium-ion - Year-over-year growth 2025-2030 (%)
Data Table on Lithium-ion - Year-over-year growth 2025-2030 (%)

8.5 Others - Market size and forecast 2025-2030

Chart on Others - Market size and forecast 2025-2030 ($ billion)
Data Table on Others - Market size and forecast 2025-2030 ($ billion)
Chart on Others - Year-over-year growth 2025-2030 (%)
Data Table on Others - Year-over-year growth 2025-2030 (%)

8.6 Market opportunity by Technology

Market opportunity by Technology ($ billion)
Data Table on Market opportunity by Technology ($ billion)

9. Market Segmentation by Application

9.1 Market segments

Chart on Application - Market share 2025-2030 (%)
Data Table on Application - Market share 2025-2030 (%)

9.2 Comparison by Application

Chart on Comparison by Application
Data Table on Comparison by Application

9.3 Automotive batteries - Market size and forecast 2025-2030

Chart on Automotive batteries - Market size and forecast 2025-2030 ($ billion)
Data Table on Automotive batteries - Market size and forecast 2025-2030 ($ billion)
Chart on Automotive batteries - Year-over-year growth 2025-2030 (%)
Data Table on Automotive batteries - Year-over-year growth 2025-2030 (%)

9.4 Industrial batteries - Market size and forecast 2025-2030

Chart on Industrial batteries - Market size and forecast 2025-2030 ($ billion)
Data Table on Industrial batteries - Market size and forecast 2025-2030 ($ billion)
Chart on Industrial batteries - Year-over-year growth 2025-2030 (%)
Data Table on Industrial batteries - Year-over-year growth 2025-2030 (%)

9.5 Portable batteries - Market size and forecast 2025-2030

Chart on Portable batteries - Market size and forecast 2025-2030 ($ billion)
Data Table on Portable batteries - Market size and forecast 2025-2030 ($ billion)
Chart on Portable batteries - Year-over-year growth 2025-2030 (%)
Data Table on Portable batteries - Year-over-year growth 2025-2030 (%)

9.6 Others - Market size and forecast 2025-2030

Chart on Others - Market size and forecast 2025-2030 ($ billion)
Data Table on Others - Market size and forecast 2025-2030 ($ billion)
Chart on Others - Year-over-year growth 2025-2030 (%)
Data Table on Others - Year-over-year growth 2025-2030 (%)

9.7 Market opportunity by Application

Market opportunity by Application ($ billion)
Data Table on Market opportunity by Application ($ billion)

10. Market Segmentation by End-user

10.1 Market segments

Chart on End-user - Market share 2025-2030 (%)
Data Table on End-user - Market share 2025-2030 (%)

10.2 Comparison by End-user

Chart on Comparison by End-user
Data Table on Comparison by End-user

10.3 Residential - Market size and forecast 2025-2030

Chart on Residential - Market size and forecast 2025-2030 ($ billion)
Data Table on Residential - Market size and forecast 2025-2030 ($ billion)
Chart on Residential - Year-over-year growth 2025-2030 (%)
Data Table on Residential - Year-over-year growth 2025-2030 (%)

10.4 Commercial - Market size and forecast 2025-2030

Chart on Commercial - Market size and forecast 2025-2030 ($ billion)
Data Table on Commercial - Market size and forecast 2025-2030 ($ billion)
Chart on Commercial - Year-over-year growth 2025-2030 (%)
Data Table on Commercial - Year-over-year growth 2025-2030 (%)

10.5 Industrial - Market size and forecast 2025-2030

Chart on Industrial - Market size and forecast 2025-2030 ($ billion)
Data Table on Industrial - Market size and forecast 2025-2030 ($ billion)
Chart on Industrial - Year-over-year growth 2025-2030 (%)
Data Table on Industrial - Year-over-year growth 2025-2030 (%)

10.6 Utilities - Market size and forecast 2025-2030

Chart on Utilities - Market size and forecast 2025-2030 ($ billion)
Data Table on Utilities - Market size and forecast 2025-2030 ($ billion)
Chart on Utilities - Year-over-year growth 2025-2030 (%)
Data Table on Utilities - Year-over-year growth 2025-2030 (%)

10.7 Market opportunity by End-user

Market opportunity by End-user ($ billion)
Data Table on Market opportunity by End-user ($ billion)

11. Customer Landscape

11.1 Customer landscape overview

Analysis of price sensitivity, lifecycle, customer purchase basket, adoption rates, and purchase criteria

12. Geographic Landscape

12.1 Geographic segmentation

Chart on Market share by geography 2025-2030 (%)
Data Table on Market share by geography 2025-2030 (%)

12.2 Geographic comparison

Chart on Geographic comparison
Data Table on Geographic comparison

12.3 APAC - Market size and forecast 2025-2030

Chart on APAC - Market size and forecast 2025-2030 ($ billion)
Data Table on APAC - Market size and forecast 2025-2030 ($ billion)
Chart on APAC - Year-over-year growth 2025-2030 (%)
Data Table on APAC - Year-over-year growth 2025-2030 (%)
Chart on Regional Comparison - APAC
Data Table on Regional Comparison - APAC

12.3.1 China - Market size and forecast 2025-2030

Chart on China - Market size and forecast 2025-2030 ($ billion)
Data Table on China - Market size and forecast 2025-2030 ($ billion)
Chart on China - Year-over-year growth 2025-2030 (%)
Data Table on China - Year-over-year growth 2025-2030 (%)

12.3.2 Japan - Market size and forecast 2025-2030

Chart on Japan - Market size and forecast 2025-2030 ($ billion)
Data Table on Japan - Market size and forecast 2025-2030 ($ billion)
Chart on Japan - Year-over-year growth 2025-2030 (%)
Data Table on Japan - Year-over-year growth 2025-2030 (%)

12.3.3 India - Market size and forecast 2025-2030

Chart on India - Market size and forecast 2025-2030 ($ billion)
Data Table on India - Market size and forecast 2025-2030 ($ billion)
Chart on India - Year-over-year growth 2025-2030 (%)
Data Table on India - Year-over-year growth 2025-2030 (%)

12.3.4 South Korea - Market size and forecast 2025-2030

Chart on South Korea - Market size and forecast 2025-2030 ($ billion)
Data Table on South Korea - Market size and forecast 2025-2030 ($ billion)
Chart on South Korea - Year-over-year growth 2025-2030 (%)
Data Table on South Korea - Year-over-year growth 2025-2030 (%)

12.3.5 Australia - Market size and forecast 2025-2030

Chart on Australia - Market size and forecast 2025-2030 ($ billion)
Data Table on Australia - Market size and forecast 2025-2030 ($ billion)
Chart on Australia - Year-over-year growth 2025-2030 (%)
Data Table on Australia - Year-over-year growth 2025-2030 (%)

12.3.6 Indonesia - Market size and forecast 2025-2030

Chart on Indonesia - Market size and forecast 2025-2030 ($ billion)
Data Table on Indonesia - Market size and forecast 2025-2030 ($ billion)
Chart on Indonesia - Year-over-year growth 2025-2030 (%)
Data Table on Indonesia - Year-over-year growth 2025-2030 (%)

12.4 Europe - Market size and forecast 2025-2030

Chart on Europe - Market size and forecast 2025-2030 ($ billion)
Data Table on Europe - Market size and forecast 2025-2030 ($ billion)
Chart on Europe - Year-over-year growth 2025-2030 (%)
Data Table on Europe - Year-over-year growth 2025-2030 (%)
Chart on Regional Comparison - Europe
Data Table on Regional Comparison - Europe

12.4.1 Germany - Market size and forecast 2025-2030

Chart on Germany - Market size and forecast 2025-2030 ($ billion)
Data Table on Germany - Market size and forecast 2025-2030 ($ billion)
Chart on Germany - Year-over-year growth 2025-2030 (%)
Data Table on Germany - Year-over-year growth 2025-2030 (%)

12.4.2 UK - Market size and forecast 2025-2030

Chart on UK - Market size and forecast 2025-2030 ($ billion)
Data Table on UK - Market size and forecast 2025-2030 ($ billion)
Chart on UK - Year-over-year growth 2025-2030 (%)
Data Table on UK - Year-over-year growth 2025-2030 (%)

12.4.3 France - Market size and forecast 2025-2030

Chart on France - Market size and forecast 2025-2030 ($ billion)
Data Table on France - Market size and forecast 2025-2030 ($ billion)
Chart on France - Year-over-year growth 2025-2030 (%)
Data Table on France - Year-over-year growth 2025-2030 (%)

12.4.4 Italy - Market size and forecast 2025-2030

Chart on Italy - Market size and forecast 2025-2030 ($ billion)
Data Table on Italy - Market size and forecast 2025-2030 ($ billion)
Chart on Italy - Year-over-year growth 2025-2030 (%)
Data Table on Italy - Year-over-year growth 2025-2030 (%)

12.4.5 Spain - Market size and forecast 2025-2030

Chart on Spain - Market size and forecast 2025-2030 ($ billion)
Data Table on Spain - Market size and forecast 2025-2030 ($ billion)
Chart on Spain - Year-over-year growth 2025-2030 (%)
Data Table on Spain - Year-over-year growth 2025-2030 (%)

12.4.6 The Netherlands - Market size and forecast 2025-2030

Chart on The Netherlands - Market size and forecast 2025-2030 ($ billion)
Data Table on The Netherlands - Market size and forecast 2025-2030 ($ billion)
Chart on The Netherlands - Year-over-year growth 2025-2030 (%)
Data Table on The Netherlands - Year-over-year growth 2025-2030 (%)

12.5 North America - Market size and forecast 2025-2030

Chart on North America - Market size and forecast 2025-2030 ($ billion)
Data Table on North America - Market size and forecast 2025-2030 ($ billion)
Chart on North America - Year-over-year growth 2025-2030 (%)
Data Table on North America - Year-over-year growth 2025-2030 (%)
Chart on Regional Comparison - North America
Data Table on Regional Comparison - North America

12.5.1 US - Market size and forecast 2025-2030

Chart on US - Market size and forecast 2025-2030 ($ billion)
Data Table on US - Market size and forecast 2025-2030 ($ billion)
Chart on US - Year-over-year growth 2025-2030 (%)
Data Table on US - Year-over-year growth 2025-2030 (%)

12.5.2 Canada - Market size and forecast 2025-2030

Chart on Canada - Market size and forecast 2025-2030 ($ billion)
Data Table on Canada - Market size and forecast 2025-2030 ($ billion)
Chart on Canada - Year-over-year growth 2025-2030 (%)
Data Table on Canada - Year-over-year growth 2025-2030 (%)

12.5.3 Mexico - Market size and forecast 2025-2030

Chart on Mexico - Market size and forecast 2025-2030 ($ billion)
Data Table on Mexico - Market size and forecast 2025-2030 ($ billion)
Chart on Mexico - Year-over-year growth 2025-2030 (%)
Data Table on Mexico - Year-over-year growth 2025-2030 (%)

12.6 Middle East and Africa - Market size and forecast 2025-2030

Chart on Middle East and Africa - Market size and forecast 2025-2030 ($ billion)
Data Table on Middle East and Africa - Market size and forecast 2025-2030 ($ billion)
Chart on Middle East and Africa - Year-over-year growth 2025-2030 (%)
Data Table on Middle East and Africa - Year-over-year growth 2025-2030 (%)
Chart on Regional Comparison - Middle East and Africa
Data Table on Regional Comparison - Middle East and Africa

12.6.1 Saudi Arabia - Market size and forecast 2025-2030

Chart on Saudi Arabia - Market size and forecast 2025-2030 ($ billion)
Data Table on Saudi Arabia - Market size and forecast 2025-2030 ($ billion)
Chart on Saudi Arabia - Year-over-year growth 2025-2030 (%)
Data Table on Saudi Arabia - Year-over-year growth 2025-2030 (%)

12.6.2 UAE - Market size and forecast 2025-2030

Chart on UAE - Market size and forecast 2025-2030 ($ billion)
Data Table on UAE - Market size and forecast 2025-2030 ($ billion)
Chart on UAE - Year-over-year growth 2025-2030 (%)
Data Table on UAE - Year-over-year growth 2025-2030 (%)

12.6.3 South Africa - Market size and forecast 2025-2030

Chart on South Africa - Market size and forecast 2025-2030 ($ billion)
Data Table on South Africa - Market size and forecast 2025-2030 ($ billion)
Chart on South Africa - Year-over-year growth 2025-2030 (%)
Data Table on South Africa - Year-over-year growth 2025-2030 (%)

12.6.4 Israel - Market size and forecast 2025-2030

Chart on Israel - Market size and forecast 2025-2030 ($ billion)
Data Table on Israel - Market size and forecast 2025-2030 ($ billion)
Chart on Israel - Year-over-year growth 2025-2030 (%)
Data Table on Israel - Year-over-year growth 2025-2030 (%)

12.6.5 Turkey - Market size and forecast 2025-2030

Chart on Turkey - Market size and forecast 2025-2030 ($ billion)
Data Table on Turkey - Market size and forecast 2025-2030 ($ billion)
Chart on Turkey - Year-over-year growth 2025-2030 (%)
Data Table on Turkey - Year-over-year growth 2025-2030 (%)

12.7 South America - Market size and forecast 2025-2030

Chart on South America - Market size and forecast 2025-2030 ($ billion)
Data Table on South America - Market size and forecast 2025-2030 ($ billion)
Chart on South America - Year-over-year growth 2025-2030 (%)
Data Table on South America - Year-over-year growth 2025-2030 (%)
Chart on Regional Comparison - South America
Data Table on Regional Comparison - South America

12.7.1 Brazil - Market size and forecast 2025-2030

Chart on Brazil - Market size and forecast 2025-2030 ($ billion)
Data Table on Brazil - Market size and forecast 2025-2030 ($ billion)
Chart on Brazil - Year-over-year growth 2025-2030 (%)
Data Table on Brazil - Year-over-year growth 2025-2030 (%)

12.7.2 Argentina - Market size and forecast 2025-2030

Chart on Argentina - Market size and forecast 2025-2030 ($ billion)
Data Table on Argentina - Market size and forecast 2025-2030 ($ billion)
Chart on Argentina - Year-over-year growth 2025-2030 (%)
Data Table on Argentina - Year-over-year growth 2025-2030 (%)

12.7.3 Chile - Market size and forecast 2025-2030

Chart on Chile - Market size and forecast 2025-2030 ($ billion)
Data Table on Chile - Market size and forecast 2025-2030 ($ billion)
Chart on Chile - Year-over-year growth 2025-2030 (%)
Data Table on Chile - Year-over-year growth 2025-2030 (%)

12.8 Market opportunity by geography

Market opportunity by geography ($ billion)
Data Tables on Market opportunity by geography ($ billion)

13. Drivers, Challenges, and Opportunity

13.1 Market drivers

Rising demand for electric vehicles worldwide
Growth in renewable energy storage applications
Increasing use in consumer electronics devices

13.2 Market challenges

Fluctuating raw material prices impact battery production costs
Safety concerns related to overheating and thermal runaway
Recycling and disposal infrastructure remains underdeveloped globally

13.3 Impact of drivers and challenges

Impact of drivers and challenges in 2025 and 2030

13.4 Market opportunities

Advancements in solid state battery technology development
Increasing focus on battery recycling and reuse solutions
Shift toward high energy density and fast charging batteries

14. Competitive Landscape

14.1 Overview

14.2

Overview on criticality of inputs and factors of differentiation

14.3 Landscape disruption

Overview on factors of disruption

14.4 Industry risks

Impact of key risks on business

15. Competitive Analysis

15.1 Companies profiled

Companies covered

15.2 Company ranking index

15.3 Market positioning of companies

Matrix on companies position and classification

15.4 A123 Systems LLC

A123 Systems LLC - Overview
A123 Systems LLC - Product / Service
A123 Systems LLC - Key offerings
SWOT

15.5 AESC Group

AESC Group - Overview
AESC Group - Product / Service
AESC Group - Key offerings
SWOT

15.6 Alliance Francaise d Atlanta

Alliance Francaise d Atlanta - Overview
Alliance Francaise d Atlanta - Product / Service
Alliance Francaise d Atlanta - Key offerings
SWOT

15.7 Amprius Technologies Inc.

Amprius Technologies Inc. - Overview
Amprius Technologies Inc. - Product / Service
Amprius Technologies Inc. - Key offerings
SWOT

15.8 BYD Co. Ltd.

BYD Co. Ltd. - Overview
BYD Co. Ltd. - Business segments
BYD Co. Ltd. - Key offerings
BYD Co. Ltd. - Segment focus
SWOT

15.9 CALB Group Co. Ltd.

CALB Group Co. Ltd. - Overview
CALB Group Co. Ltd. - Product / Service
CALB Group Co. Ltd. - Key offerings
SWOT

15.10 CLARIOS LLC

CLARIOS LLC - Overview
CLARIOS LLC - Product / Service
CLARIOS LLC - Key offerings
SWOT

15.11 Discover Battery

Discover Battery - Overview
Discover Battery - Product / Service
Discover Battery - Key offerings
SWOT

15.12 EnerSys

EnerSys - Overview
EnerSys - Business segments
EnerSys - Key offerings
EnerSys - Segment focus
SWOT

15.13 GS Yuasa International Ltd.

GS Yuasa International Ltd. - Overview
GS Yuasa International Ltd. - Product / Service
GS Yuasa International Ltd. - Key offerings
SWOT

15.14 Murata Manufacturing Co. Ltd.

Murata Manufacturing Co. Ltd. - Overview
Murata Manufacturing Co. Ltd. - Business segments
Murata Manufacturing Co. Ltd. - Key offerings
Murata Manufacturing Co. Ltd. - Segment focus
SWOT

15.15 Panasonic Holdings Corp.

Panasonic Holdings Corp. - Overview
Panasonic Holdings Corp. - Business segments
Panasonic Holdings Corp. - Key news
Panasonic Holdings Corp. - Key offerings
Panasonic Holdings Corp. - Segment focus
SWOT

15.16 Samsung SDI Co. Ltd.

Samsung SDI Co. Ltd. - Overview
Samsung SDI Co. Ltd. - Business segments
Samsung SDI Co. Ltd. - Key offerings
Samsung SDI Co. Ltd. - Segment focus
SWOT

15.17 Toshiba Corp.

Toshiba Corp. - Overview
Toshiba Corp. - Business segments
Toshiba Corp. - Key offerings
Toshiba Corp. - Segment focus
SWOT

15.18 VARTA AG

VARTA AG - Overview
VARTA AG - Business segments
VARTA AG - Key news
VARTA AG - Key offerings
VARTA AG - Segment focus
SWOT

16. Appendix

16.1 Scope of the report

Market definition
Objectives
Notes and caveats

16.2 Inclusions and exclusions checklist

Inclusions checklist
Exclusions checklist

16.3 Currency conversion rates for US$

16.4 Research methodology

16.5 Data procurement

Information sources

16.6 Data validation

16.7 Validation techniques employed for market sizing

16.8 Data synthesis

16.9 360 degree market analysis

16.10 List of abbreviations

Research Methodology

Technavio presents a detailed picture of the market by way of study, synthesis, and summation of data from multiple sources. The analysts have presented the various facets of the market with a particular focus on identifying the key industry influencers. The data thus presented is comprehensive, reliable, and the result of extensive research, both primary and secondary.

INFORMATION SOURCES

Primary sources

  • Manufacturers and suppliers
  • Channel partners
  • Industry experts
  • Strategic decision makers

Secondary sources

  • Industry journals and periodicals
  • Government data
  • Financial reports of key industry players
  • Historical data
  • Press releases

DATA ANALYSIS

Data Synthesis

  • Collation of data
  • Estimation of key figures
  • Analysis of derived insights

Data Validation

  • Triangulation with data models
  • Reference against proprietary databases
  • Corroboration with industry experts

REPORT WRITING

Qualitative

  • Market drivers
  • Market challenges
  • Market trends
  • Five forces analysis

Quantitative

  • Market size and forecast
  • Market segmentation
  • Geographical insights
  • Competitive landscape

Interested in this report?

Get your sample now to see our research methodology and insights!

Download Now

Frequently Asked Questions

Secondary Battery market growth will increase by USD 52561.8 billion during 2026-2030.

The Secondary Battery market is expected to grow at a CAGR of 27.3% during 2026-2030.

Secondary Battery market is segmented by Technology (Lead-acid, Lithium-ion, Others) Application (Automotive batteries, Industrial batteries, Portable batteries, Others) End-user (Residential, Commercial, Industrial, Utilities)

A123 Systems LLC, AESC Group, Alliance Francaise d Atlanta, Amprius Technologies Inc., BYD Co. Ltd., CALB Group Co. Ltd., CLARIOS LLC, Contemporary Amperex Ltd., Discover Battery, EnerSys, EVE Energy Co. Ltd., GS Yuasa International Ltd., LG Energy Solution Ltd., Lithium Werks, Murata Manufacturing Co. Ltd., Northvolt AB, Panasonic Holdings Corp., Samsung SDI Co. Ltd., Toshiba Corp., VARTA AG are a few of the key vendors in the Secondary Battery market.

APAC will register the highest growth rate of 46.6% among the other regions. Therefore, the Secondary Battery market in APAC is expected to garner significant business opportunities for the vendors during the forecast period.

China, Japan, India, South Korea, Australia, Indonesia, Germany, UK, France, Italy, Spain, The Netherlands, US, Canada, Mexico, Saudi Arabia, UAE, South Africa, Israel, Turkey, Brazil, Argentina, Chile

  • Rising demand for electric vehicles worldwide is the driving factor this market.

The Secondary Battery market vendors should focus on grabbing business opportunities from the Technology segment as it accounted for the largest market share in the base year.
RIA - Research AI Assistant
Ask RIA