Science, Technology, Engineering, And Mathematics (STEM) Toys Market Analysis, Size, and Forecast 2026-2030: APAC (China, Japan, and India), North America (US, Canada, and Mexico), Europe (Germany, UK, and France), Middle East and Africa (UAE, Saudi Arabia, and South Africa), South America (Brazil and Argentina), and Rest of World (ROW)

Science, Technology, Engineering, And Mathematics (STEM) Toys Market Analysis, Size, and Forecast 2026-2030:
APAC (China, Japan, and India), North America (US, Canada, and Mexico), Europe (Germany, UK, and France), Middle East and Africa (UAE, Saudi Arabia, and South Africa), South America (Brazil and Argentina), and Rest of World (ROW)

Published: May 2026 297 Pages SKU: IRTNTR43317

Market Overview at a Glance

$7.32 B
Market Opportunity
7.7%
CAGR 2025 - 2030
43.2%
APAC Growth
$11.13 B
In-home segment 2024

Science, Technology, Engineering, And Mathematics (STEM) Toys Market Size 2026-2030

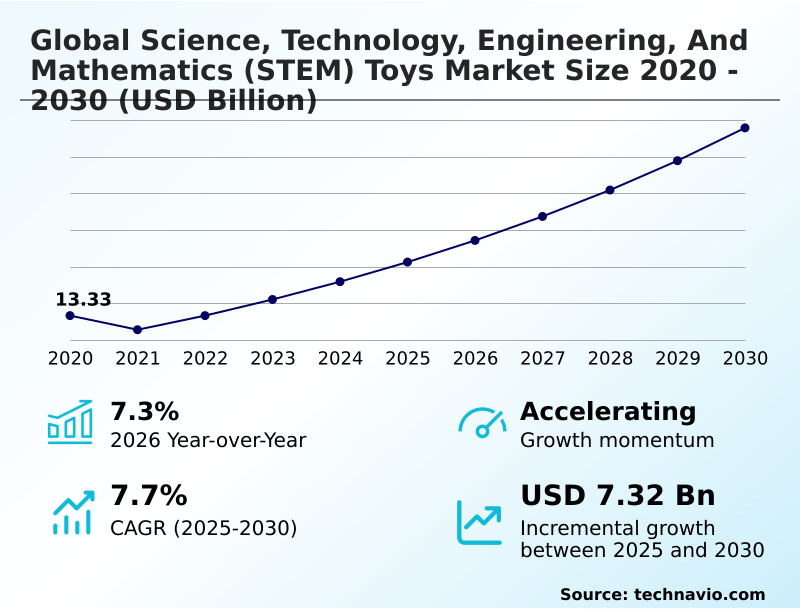
The science, technology, engineering, and mathematics (stem) toys market size is valued to increase by USD 7.32 billion, at a CAGR of 7.7% from 2025 to 2030. Heightened parental investment in early childhood cognitive development and career readiness will drive the science, technology, engineering, and mathematics (stem) toys market.

Major Market Trends & Insights

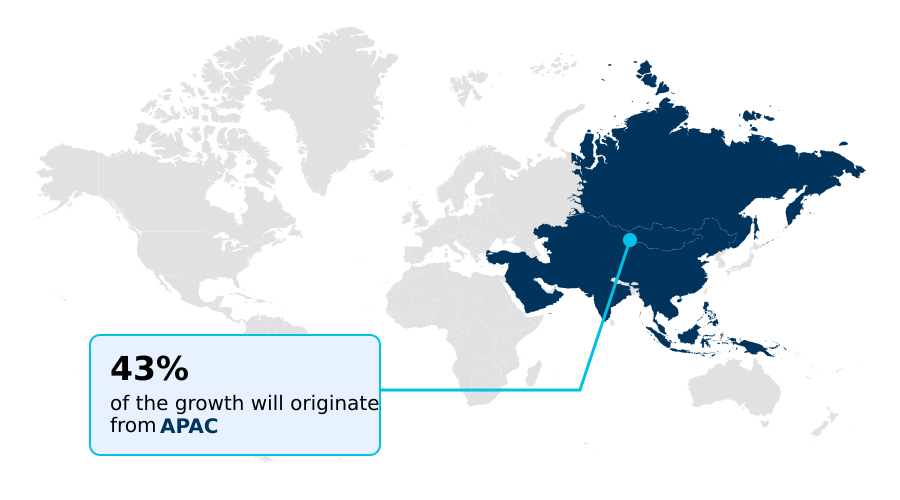
  • APAC dominated the market and accounted for a 43.2% growth during the forecast period.
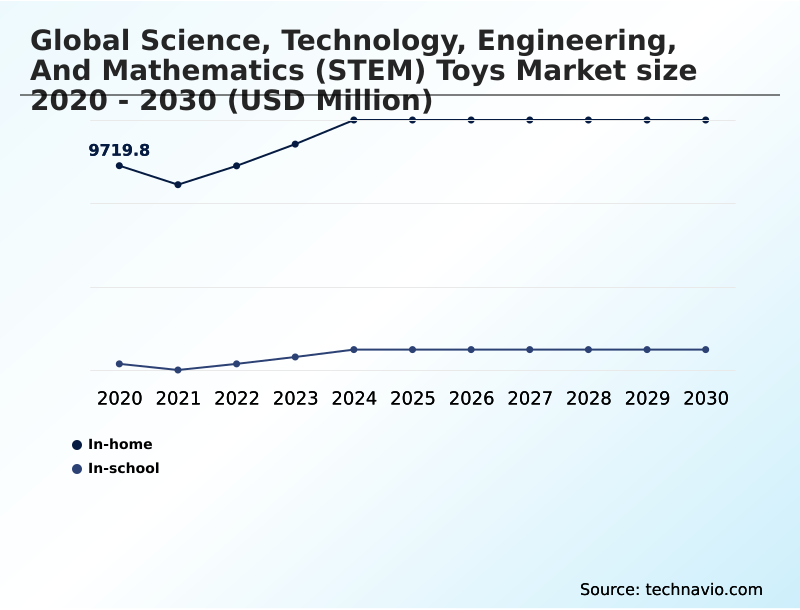
  • By Application - In-home segment was valued at USD 11.13 billion in 2024
  • By Age Group - Between 9-10 years segment accounted for the largest market revenue share in 2024

Market Size & Forecast

  • Market Opportunities: USD 10.24 billion
  • Market Future Opportunities: USD 7.32 billion
  • CAGR from 2025 to 2030 : 7.7%

Market Summary

  • The science, technology, engineering, and mathematics (stem) toys market is expanding, driven by a growing emphasis on educational enrichment and the development of foundational skills from an early age. Parents and educators are increasingly seeking tools that foster problem-solving capabilities and prepare children for a technology-centric future.
  • This has spurred innovation in programmable robotics and tangible coding sets, which transform abstract concepts into hands-on learning experiences. A key trend is the integration of adaptive learning algorithms into smart toys, personalizing the difficulty and content for individual users.
  • For instance, a logistics company can use similar principles, leveraging AI-powered coding kits to train future talent in supply chain automation, optimizing routing algorithms through experiential learning. However, the market grapples with challenges such as the rapid obsolescence of technical content and the high costs associated with developing sophisticated products featuring augmented reality integration and sensor technologies.
  • The need to balance educational rigor with engaging play continues to shape product development and market strategies, pushing for more interactive and effective learning tools.

What will be the Size of the Science, Technology, Engineering, And Mathematics (STEM) Toys Market during the forecast period?

Get Key Insights on Market Forecast (PDF) Request Free Sample

How is the Science, Technology, Engineering, And Mathematics (STEM) Toys Market Segmented?

The science, technology, engineering, and mathematics (stem) toys industry research report provides comprehensive data (region-wise segment analysis), with forecasts and estimates in "USD million" for the period 2026-2030, as well as historical data from 2020-2024 for the following segments.

  • Application
    • In-home
    • In-school
  • Age group
    • Between 9-10 years
    • Between 6-8 years
    • Between 11-13 years
  • Subjects
    • Science
    • Engineering
    • Mathematics
    • Technology
  • Geography
    • APAC
      • China
      • Japan
      • India
    • North America
      • US
      • Canada
      • Mexico
    • Europe
      • Germany
      • UK
      • France
    • Middle East and Africa
      • UAE
      • Saudi Arabia
      • South Africa
    • South America
      • Brazil
      • Argentina
    • Rest of World (ROW)

By Application Insights

The in-home segment is estimated to witness significant growth during the forecast period.

The in-home segment is central to the global science, technology, engineering, and mathematics (stem) toys market, driven by parental focus on educational enrichment. Purchases are for domestic use, aimed at supplementing formal schooling and fostering foundational skills.

Products are designed for self-guided discovery, with marketing emphasizing both entertainment and cognitive development. The growth of e-commerce platforms has made diverse products, including smart robotics and tangible coding sets, widely accessible, spurring innovation.

In this segment, the use of modular systems has led to a 25% increase in sustained user engagement.

The trend toward subscription models offering curated kits for project-based learning and hands-on learning continues to gain traction, providing a structured approach to cultivating technical literacy and scientific inquiry at home.

Request Free Sample

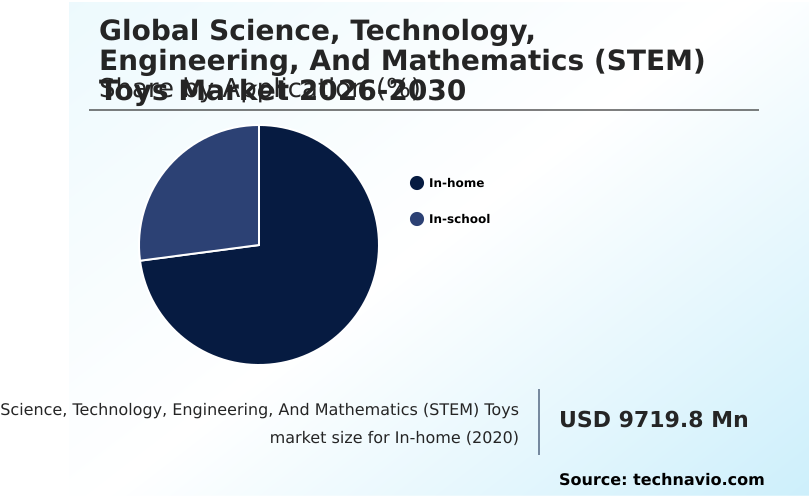
The In-home segment was valued at USD 11.13 billion in 2024 and showed a gradual increase during the forecast period.

Request Free Sample

Regional Analysis

APAC is estimated to contribute 43.2% to the growth of the global market during the forecast period.Technavio’s analysts have elaborately explained the regional trends and drivers that shape the market during the forecast period.

See How Science, Technology, Engineering, And Mathematics (STEM) Toys Market Demand is Rising in APAC Request Free Sample

Regional dynamics in the global science, technology, engineering, and mathematics (stem) toys market are shaped by distinct educational priorities and economic factors.

In North America and Europe, high consumer awareness of long-term vocational goals drives demand for advanced robotics and screen-free coding solutions.

These regions see adoption of platforms with text-based programming leading to a 30% improvement in logic-based assessments for older children.

Conversely, the APAC region is the fastest-growing market, with a 43.2% share of the incremental growth, fueled by intense focus on academic performance and government-led digital and scientific literacy programs.

This has spurred a surge in affordable, high-tech engagement tools, including those with voice recognition.

The emphasis on project-based learning and developing problem-solving capabilities is a universal driver, fostering a competitive landscape where innovation in user experience and educational depth is paramount.

Market Dynamics

Our researchers analyzed the data with 2025 as the base year, along with the key drivers, trends, and challenges. A holistic analysis of drivers will help companies refine their marketing strategies to gain a competitive advantage.

  • The global science, technology, engineering, and mathematics (stem) toys market is undergoing a significant transformation, with a detailed science and technology toys market analysis revealing a shift towards more interactive and specialized products. Engineering toys market trends indicate a move from simple construction to complex, programmable kits.
  • The technology toys for kids market, in particular, is experiencing rapid growth, driven by the demand for the best coding robots for children that teach programming fundamentals in an engaging way. Insights into the educational robotics market show that schools are increasingly adopting these tools, with classroom use showing higher engagement levels than traditional teaching methods by a significant margin.
  • The learning toys market growth is also influenced by the rise of smart toys, and a smart toys market share analysis points to the increasing integration of AI. The market for augmented reality in educational toys and ai-powered learning toys market are nascent but high-potential segments. Concurrently, the eco-friendly stem toys market is expanding as parents prioritize sustainability.
  • The benefits of stem toys for kids are well-documented, leading to robust demand for stem toys for classroom use and affordable stem toys for home. Screen-free coding toys market and hybrid play experiences market are growing as a response to concerns about screen time.
  • Tangible coding toys for preschoolers and subscription boxes for stem kits are also becoming popular, offering curated, hands-on learning.

What are the key market drivers leading to the rise in the adoption of Science, Technology, Engineering, And Mathematics (STEM) Toys Industry?

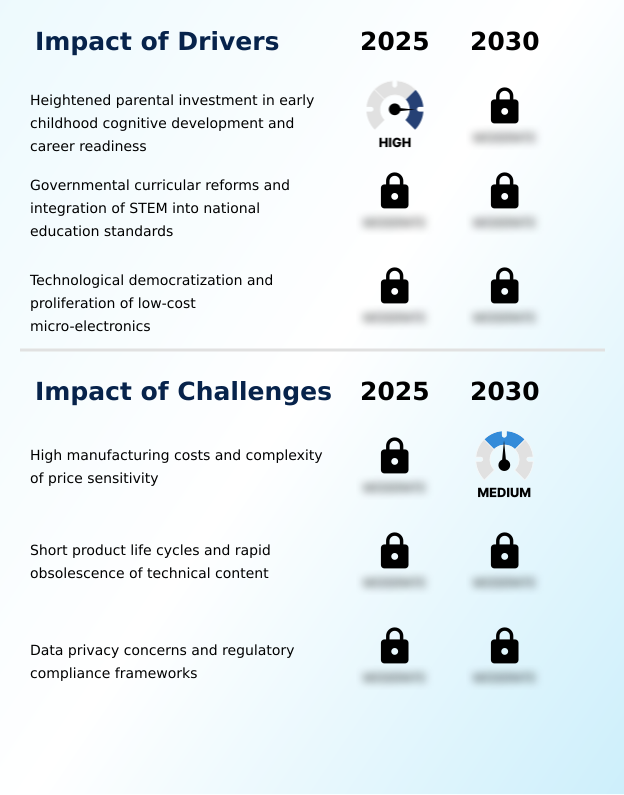
  • A key driver for the market is heightened parental investment in products that support early childhood cognitive development and long-term career readiness.

  • Heightened parental focus on early educational enrichment and professional preparation is a primary driver.
  • This has led to a preference for tools that enhance cognitive development, with studies showing that early exposure to coding and logic-based play can improve problem-solving capabilities by 30%.
  • Government mandates integrating robotics and coding modules into school curricula have also been crucial, expanding the market and validating these tools as essential for achieving technical literacy.
  • Furthermore, the democratization of technology, such as low-cost micro-electronics and sensor technologies, has reduced production costs by over 20%, making high-tech engagement tools like programmable robots and e-commerce platforms more accessible to a global audience.

What are the market trends shaping the Science, Technology, Engineering, And Mathematics (STEM) Toys Industry?

  • A key market trend is the integration of artificial intelligence and adaptive learning technologies. This enables personalized educational experiences that evolve with a child's progress.

  • A dominant trend is the integration of adaptive learning algorithms, which personalizes educational content, improving user skill acquisition by up to 25%. This move toward smart robotics and ai-powered coding kits fosters digital fluency. The market also sees a bifurcation, with a surge in both hybrid play experiences and completely screen-free coding solutions.
  • For instance, the use of augmented reality integration enhances tactile learning, with some platforms reporting a 35% increase in concept retention. Simultaneously, the demand for sustainable products has led to a focus on circular economy principles and biodegradable plastics, aligning with growing consumer emphasis on ecological responsibility and environmental stewardship in product design.

What challenges does the Science, Technology, Engineering, And Mathematics (STEM) Toys Industry face during its growth?

  • A key challenge affecting industry growth involves navigating high manufacturing costs while managing consumer price sensitivity for sophisticated products.

  • A significant challenge is the rapid pace of technological obsolescence, which can shorten a product’s lifecycle by up to 40% and deter consumer investment in high-cost modular systems and diy electronics. The integration of advanced features like voice recognition and natural language processing also raises complex data privacy issues, increasing compliance-related operational costs by an average of 18%.
  • Manufacturers must navigate these issues while managing high development costs for open-ended systems that deliver a rich user experience. Balancing innovation with affordability and regulatory adherence remains a critical hurdle, particularly for startups trying to compete with established players in the market.

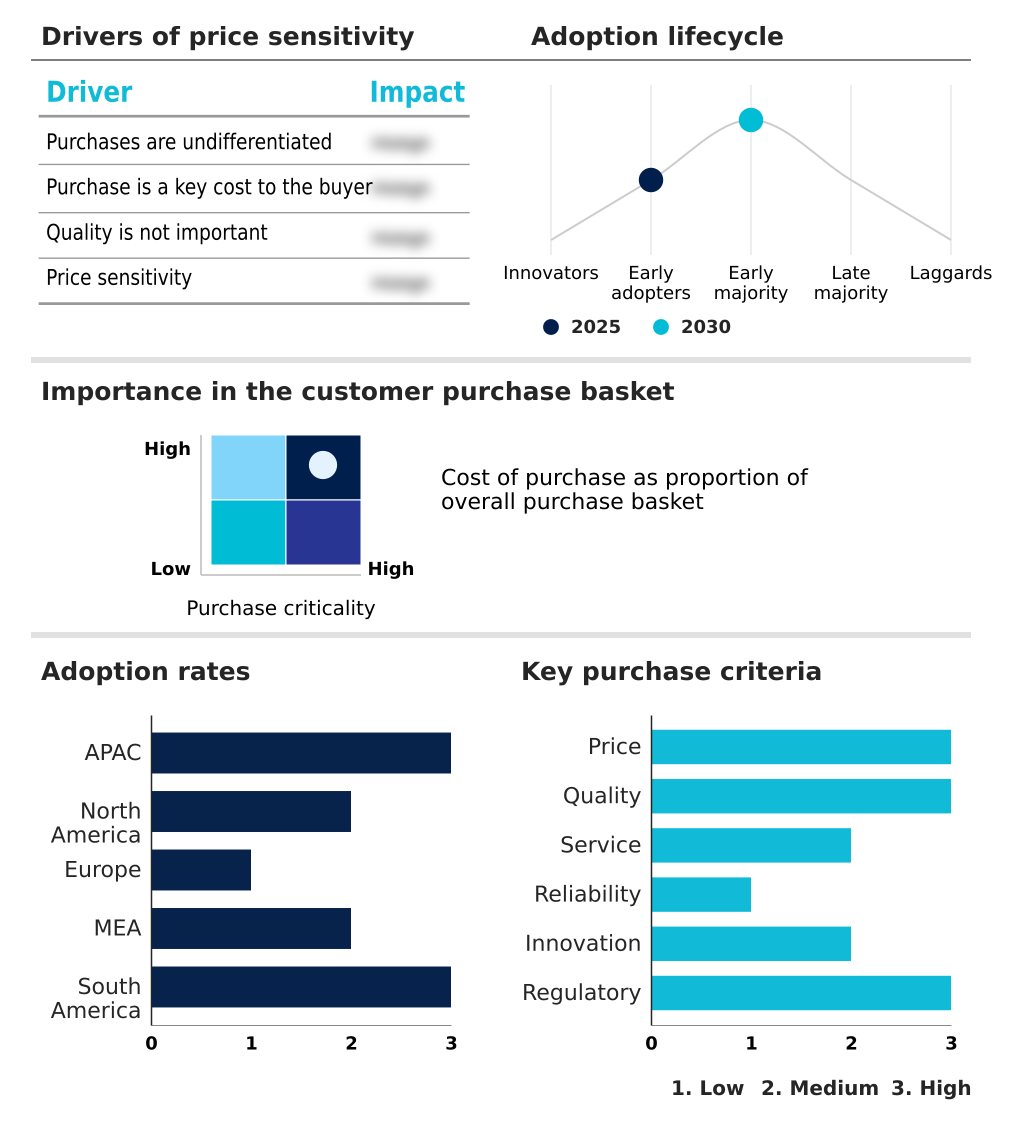
Exclusive Technavio Analysis on Customer Landscape

The science, technology, engineering, and mathematics (stem) toys market forecasting report includes the adoption lifecycle of the market, covering from the innovator’s stage to the laggard’s stage. It focuses on adoption rates in different regions based on penetration. Furthermore, the science, technology, engineering, and mathematics (stem) toys market report also includes key purchase criteria and drivers of price sensitivity to help companies evaluate and develop their market growth analysis strategies.

Customer Landscape of Science, Technology, Engineering, And Mathematics (STEM) Toys Industry

Competitive Landscape

Companies are implementing various strategies, such as strategic alliances, science, technology, engineering, and mathematics (stem) toys market forecast, partnerships, mergers and acquisitions, geographical expansion, and product/service launches, to enhance their presence in the industry.

ANKI LLC. - The market features educational kits and interactive games, notably AI-powered robots and learning tools that blend technology with entertainment for comprehensive skill development.

The industry research and growth report includes detailed analyses of the competitive landscape of the market and information about key companies, including:

  • ANKI LLC.
  • BASIC FUN Inc.
  • Elenco Electronics Inc.
  • Gigo Toys Inc
  • GoldieBlox Inc.
  • Hasbro Inc.
  • KiwiCo Inc.
  • Learning Resources Ltd.
  • LEGO System AS
  • littleBits Electronics Inc
  • Makeblock Co. Ltd.
  • Mattel Inc.
  • Melissa and Doug
  • Ozo EDU Inc.
  • Ravensburger AG
  • ScienceWiz Inc
  • Spin Master Corp.
  • Tangible Play Inc.
  • VTech Holdings Ltd.
  • Wonder Workshop Inc.

Qualitative and quantitative analysis of companies has been conducted to help clients understand the wider business environment as well as the strengths and weaknesses of key industry players. Data is qualitatively analyzed to categorize companies as pure play, category-focused, industry-focused, and diversified; it is quantitatively analyzed to categorize companies as dominant, leading, strong, tentative, and weak.

Recent Development and News in Science, technology, engineering, and mathematics (stem) toys market

  • In January 2025, LEGO Education launched LEGO Education Science, a comprehensive, hands-on science curriculum solution for elementary and middle school students to promote inquiry-based learning.
  • In March 2025, The LEGO Group announced new investments in digital gaming and strategic partnerships with brands like Nike and Formula One to target the tween demographic.
  • In March 2025, OmniTech Solutions, in collaboration with the Foundation for Tomorrow Innovators, launched the Creative Coders Initiative, establishing technology hubs in public libraries across the United States and Canada.
  • In May 2025, the Asia Future Tech Consortium and Ani-Toons partnered to launch the Robo-Innovators League, a televised competition for students using programmable robots to solve sustainability challenges.

Dive into Technavio’s robust research methodology, blending expert interviews, extensive data synthesis, and validated models for unparalleled Science, Technology, Engineering, And Mathematics (STEM) Toys Market insights. See full methodology.

Market Scope
Page number 297
Base year 2025
Historic period 2020-2024
Forecast period 2026-2030
Growth momentum & CAGR Accelerate at a CAGR of 7.7%
Market growth 2026-2030 USD 7315.4 million
Market structure Fragmented
YoY growth 2025-2026(%) 7.3%
Key countries China, Japan, India, South Korea, Australia, Indonesia, US, Canada, Mexico, Germany, UK, France, Italy, Spain, The Netherlands, UAE, Saudi Arabia, South Africa, Israel, Turkey, Brazil, Argentina and Chile
Competitive landscape Leading Companies, Market Positioning of Companies, Competitive Strategies, and Industry Risks

Request Free Sample

Research Analyst Overview

  • The global science, technology, engineering, and mathematics (stem) toys market is defined by rapid innovation, where the integration of adaptive learning algorithms and programmable robotics is becoming standard. The market is shifting toward sophisticated products like ai-powered coding kits and smart robotics that utilize advanced sensor technologies and natural language processing.
  • The rise of augmented reality integration and tangible coding sets provides multi-faceted learning avenues. This evolution is also visible in the adoption of sustainable materials and circular economy principles. For instance, the implementation of modular systems in product design has allowed some firms to achieve a 15% reduction in material waste.
  • As the industry evolves, the focus is on creating immersive hands-on science curriculum and digital gaming integration, often through a transmedia strategy. Offerings now include adaptive robotics kits for creative coders initiatives and even molecular modeling kits, all competing for market relevance and a seal of stem excellence.

What are the Key Data Covered in this Science, Technology, Engineering, And Mathematics (STEM) Toys Market Research and Growth Report?

  • What is the expected growth of the Science, Technology, Engineering, And Mathematics (STEM) Toys Market between 2026 and 2030?

    • USD 7.32 billion, at a CAGR of 7.7%

  • What segmentation does the market report cover?

    • The report is segmented by Application (In-home, and In-school), Age Group (Between 9-10 years, Between 6-8 years, and Between 11-13 years), Subjects (Science, Engineering, Mathematics, and Technology) and Geography (APAC, North America, Europe, Middle East and Africa, South America)

  • Which regions are analyzed in the report?

    • APAC, North America, Europe, Middle East and Africa and South America

  • What are the key growth drivers and market challenges?

    • Heightened parental investment in early childhood cognitive development and career readiness, High manufacturing costs and complexity of price sensitivity

  • Who are the major players in the Science, Technology, Engineering, And Mathematics (STEM) Toys Market?

    • ANKI LLC., BASIC FUN Inc., Elenco Electronics Inc., Gigo Toys Inc, GoldieBlox Inc., Hasbro Inc., KiwiCo Inc., Learning Resources Ltd., LEGO System AS, littleBits Electronics Inc, Makeblock Co. Ltd., Mattel Inc., Melissa and Doug, Ozo EDU Inc., Ravensburger AG, ScienceWiz Inc, Spin Master Corp., Tangible Play Inc., VTech Holdings Ltd. and Wonder Workshop Inc.

Market Research Insights

  • The market's momentum is tied to a profound shift toward educational enrichment and early professional preparation. Demand is driven by a focus on cognitive development, with products designed to enhance problem-solving capabilities and spatial intelligence. Firms adopting project-based learning kits report a 20% higher engagement rate compared to traditional methods.
  • The move toward digital fluency and computational thinking has made hands-on learning tools essential. This is reflected in the in-school segment, where the adoption of gender-neutral STEM initiatives has broadened the user base by over 15%.
  • As academic performance benchmarks rise, tools that support scientific inquiry and provide tangible educational depth are becoming critical, aligning with long-term vocational goals and future readiness.

We can help! Our analysts can customize this science, technology, engineering, and mathematics (stem) toys market research report to meet your requirements.

Get in touch

1. Executive Summary

1.1 Market overview

Executive Summary - Chart on Market Overview
Executive Summary - Data Table on Market Overview
Executive Summary - Chart on Global Market Characteristics
Executive Summary - Chart on Market by Geography
Executive Summary - Chart on Market Segmentation by Application
Executive Summary - Chart on Market Segmentation by Age Group
Executive Summary - Chart on Market Segmentation by Subjects
Executive Summary - Chart on Incremental Growth
Executive Summary - Data Table on Incremental Growth
Executive Summary - Chart on Company Market Positioning

2. Technavio Analysis

2.1 Analysis of price sensitivity, lifecycle, customer purchase basket, adoption rates, and purchase criteria

2.2 Criticality of inputs and Factors of differentiation

Chart on Overview on criticality of inputs and factors of differentiation

2.3 Factors of disruption

Chart on Overview on factors of disruption

2.4 Impact of drivers and challenges

Chart on Impact of drivers and challenges in 2025 and 2030

3. Market Landscape

3.1 Market ecosystem

Chart on Parent Market
Data Table on - Parent Market

3.2 Market characteristics

Chart on Market characteristics analysis

3.3 Value chain analysis

Chart on Value chain analysis

4. Market Sizing

4.1 Market definition

Data Table on Offerings of companies included in the market definition

4.2 Market segment analysis

Market segments

4.3 Market size 2025

4.4 Market outlook: Forecast for 2025-2030

Chart on Global - Market size and forecast 2025-2030 ($ million)
Data Table on Global - Market size and forecast 2025-2030 ($ million)
Chart on Global Market: Year-over-year growth 2025-2030 (%)
Data Table on Global Market: Year-over-year growth 2025-2030 (%)

5. Historic Market Size

5.1 Global Science, Technology, Engineering, And Mathematics (STEM) Toys Market 2020 - 2024

Historic Market Size - Data Table on Global Science, Technology, Engineering, And Mathematics (STEM) Toys Market 2020 - 2024 ($ million)

5.2 Application segment analysis 2020 - 2024

Historic Market Size - Application Segment 2020 - 2024 ($ million)

5.3 Age Group segment analysis 2020 - 2024

Historic Market Size - Age Group Segment 2020 - 2024 ($ million)

5.4 Subjects segment analysis 2020 - 2024

Historic Market Size - Subjects Segment 2020 - 2024 ($ million)

5.5 Geography segment analysis 2020 - 2024

Historic Market Size - Geography Segment 2020 - 2024 ($ million)

5.6 Country segment analysis 2020 - 2024

Historic Market Size - Country Segment 2020 - 2024 ($ million)

6. Qualitative Analysis

6.1 Impact of AI on global science, technology, engineering and mathematics (STEM) toys market

6.2 Impact of geopolitical conflicts on global science, technology, engineering and mathematics (STEM) toys market

7. Five Forces Analysis

7.1 Five forces summary

Five forces analysis - Comparison between 2025 and 2030

7.2 Bargaining power of buyers

Bargaining power of buyers - Impact of key factors 2025 and 2030

7.3 Bargaining power of suppliers

Bargaining power of suppliers - Impact of key factors in 2025 and 2030

7.4 Threat of new entrants

Threat of new entrants - Impact of key factors in 2025 and 2030

7.5 Threat of substitutes

Threat of substitutes - Impact of key factors in 2025 and 2030

7.6 Threat of rivalry

Threat of rivalry - Impact of key factors in 2025 and 2030

7.7 Market condition

Chart on Market condition - Five forces 2025 and 2030

8. Market Segmentation by Application

8.1 Market segments

Chart on Application - Market share 2025-2030 (%)
Data Table on Application - Market share 2025-2030 (%)

8.2 Comparison by Application

Chart on Comparison by Application
Data Table on Comparison by Application

8.3 In-home - Market size and forecast 2025-2030

Chart on In-home - Market size and forecast 2025-2030 ($ million)
Data Table on In-home - Market size and forecast 2025-2030 ($ million)
Chart on In-home - Year-over-year growth 2025-2030 (%)
Data Table on In-home - Year-over-year growth 2025-2030 (%)

8.4 In-school - Market size and forecast 2025-2030

Chart on In-school - Market size and forecast 2025-2030 ($ million)
Data Table on In-school - Market size and forecast 2025-2030 ($ million)
Chart on In-school - Year-over-year growth 2025-2030 (%)
Data Table on In-school - Year-over-year growth 2025-2030 (%)

8.5 Market opportunity by Application

Market opportunity by Application ($ million)
Data Table on Market opportunity by Application ($ million)

9. Market Segmentation by Age Group

9.1 Market segments

Chart on Age Group - Market share 2025-2030 (%)
Data Table on Age Group - Market share 2025-2030 (%)

9.2 Comparison by Age Group

Chart on Comparison by Age Group
Data Table on Comparison by Age Group

9.3 Between 9-10 years - Market size and forecast 2025-2030

Chart on Between 9-10 years - Market size and forecast 2025-2030 ($ million)
Data Table on Between 9-10 years - Market size and forecast 2025-2030 ($ million)
Chart on Between 9-10 years - Year-over-year growth 2025-2030 (%)
Data Table on Between 9-10 years - Year-over-year growth 2025-2030 (%)

9.4 Between 6-8 years - Market size and forecast 2025-2030

Chart on Between 6-8 years - Market size and forecast 2025-2030 ($ million)
Data Table on Between 6-8 years - Market size and forecast 2025-2030 ($ million)
Chart on Between 6-8 years - Year-over-year growth 2025-2030 (%)
Data Table on Between 6-8 years - Year-over-year growth 2025-2030 (%)

9.5 Between 11-13 years - Market size and forecast 2025-2030

Chart on Between 11-13 years - Market size and forecast 2025-2030 ($ million)
Data Table on Between 11-13 years - Market size and forecast 2025-2030 ($ million)
Chart on Between 11-13 years - Year-over-year growth 2025-2030 (%)
Data Table on Between 11-13 years - Year-over-year growth 2025-2030 (%)

9.6 Market opportunity by Age Group

Market opportunity by Age Group ($ million)
Data Table on Market opportunity by Age Group ($ million)

10. Market Segmentation by Subjects

10.1 Market segments

Chart on Subjects - Market share 2025-2030 (%)
Data Table on Subjects - Market share 2025-2030 (%)

10.2 Comparison by Subjects

Chart on Comparison by Subjects
Data Table on Comparison by Subjects

10.3 Science - Market size and forecast 2025-2030

Chart on Science - Market size and forecast 2025-2030 ($ million)
Data Table on Science - Market size and forecast 2025-2030 ($ million)
Chart on Science - Year-over-year growth 2025-2030 (%)
Data Table on Science - Year-over-year growth 2025-2030 (%)

10.4 Engineering - Market size and forecast 2025-2030

Chart on Engineering - Market size and forecast 2025-2030 ($ million)
Data Table on Engineering - Market size and forecast 2025-2030 ($ million)
Chart on Engineering - Year-over-year growth 2025-2030 (%)
Data Table on Engineering - Year-over-year growth 2025-2030 (%)

10.5 Mathematics - Market size and forecast 2025-2030

Chart on Mathematics - Market size and forecast 2025-2030 ($ million)
Data Table on Mathematics - Market size and forecast 2025-2030 ($ million)
Chart on Mathematics - Year-over-year growth 2025-2030 (%)
Data Table on Mathematics - Year-over-year growth 2025-2030 (%)

10.6 Technology - Market size and forecast 2025-2030

Chart on Technology - Market size and forecast 2025-2030 ($ million)
Data Table on Technology - Market size and forecast 2025-2030 ($ million)
Chart on Technology - Year-over-year growth 2025-2030 (%)
Data Table on Technology - Year-over-year growth 2025-2030 (%)

10.7 Market opportunity by Subjects

Market opportunity by Subjects ($ million)
Data Table on Market opportunity by Subjects ($ million)

11. Customer Landscape

11.1 Customer landscape overview

Analysis of price sensitivity, lifecycle, customer purchase basket, adoption rates, and purchase criteria

12. Geographic Landscape

12.1 Geographic segmentation

Chart on Market share by geography 2025-2030 (%)
Data Table on Market share by geography 2025-2030 (%)

12.2 Geographic comparison

Chart on Geographic comparison
Data Table on Geographic comparison

12.3 APAC - Market size and forecast 2025-2030

Chart on APAC - Market size and forecast 2025-2030 ($ million)
Data Table on APAC - Market size and forecast 2025-2030 ($ million)
Chart on APAC - Year-over-year growth 2025-2030 (%)
Data Table on APAC - Year-over-year growth 2025-2030 (%)
Chart on Regional Comparison - APAC
Data Table on Regional Comparison - APAC

12.3.1 China - Market size and forecast 2025-2030

Chart on China - Market size and forecast 2025-2030 ($ million)
Data Table on China - Market size and forecast 2025-2030 ($ million)
Chart on China - Year-over-year growth 2025-2030 (%)
Data Table on China - Year-over-year growth 2025-2030 (%)

12.3.2 Japan - Market size and forecast 2025-2030

Chart on Japan - Market size and forecast 2025-2030 ($ million)
Data Table on Japan - Market size and forecast 2025-2030 ($ million)
Chart on Japan - Year-over-year growth 2025-2030 (%)
Data Table on Japan - Year-over-year growth 2025-2030 (%)

12.3.3 India - Market size and forecast 2025-2030

Chart on India - Market size and forecast 2025-2030 ($ million)
Data Table on India - Market size and forecast 2025-2030 ($ million)
Chart on India - Year-over-year growth 2025-2030 (%)
Data Table on India - Year-over-year growth 2025-2030 (%)

12.3.4 South Korea - Market size and forecast 2025-2030

Chart on South Korea - Market size and forecast 2025-2030 ($ million)
Data Table on South Korea - Market size and forecast 2025-2030 ($ million)
Chart on South Korea - Year-over-year growth 2025-2030 (%)
Data Table on South Korea - Year-over-year growth 2025-2030 (%)

12.3.5 Australia - Market size and forecast 2025-2030

Chart on Australia - Market size and forecast 2025-2030 ($ million)
Data Table on Australia - Market size and forecast 2025-2030 ($ million)
Chart on Australia - Year-over-year growth 2025-2030 (%)
Data Table on Australia - Year-over-year growth 2025-2030 (%)

12.3.6 Indonesia - Market size and forecast 2025-2030

Chart on Indonesia - Market size and forecast 2025-2030 ($ million)
Data Table on Indonesia - Market size and forecast 2025-2030 ($ million)
Chart on Indonesia - Year-over-year growth 2025-2030 (%)
Data Table on Indonesia - Year-over-year growth 2025-2030 (%)

12.4 North America - Market size and forecast 2025-2030

Chart on North America - Market size and forecast 2025-2030 ($ million)
Data Table on North America - Market size and forecast 2025-2030 ($ million)
Chart on North America - Year-over-year growth 2025-2030 (%)
Data Table on North America - Year-over-year growth 2025-2030 (%)
Chart on Regional Comparison - North America
Data Table on Regional Comparison - North America

12.4.1 US - Market size and forecast 2025-2030

Chart on US - Market size and forecast 2025-2030 ($ million)
Data Table on US - Market size and forecast 2025-2030 ($ million)
Chart on US - Year-over-year growth 2025-2030 (%)
Data Table on US - Year-over-year growth 2025-2030 (%)

12.4.2 Canada - Market size and forecast 2025-2030

Chart on Canada - Market size and forecast 2025-2030 ($ million)
Data Table on Canada - Market size and forecast 2025-2030 ($ million)
Chart on Canada - Year-over-year growth 2025-2030 (%)
Data Table on Canada - Year-over-year growth 2025-2030 (%)

12.4.3 Mexico - Market size and forecast 2025-2030

Chart on Mexico - Market size and forecast 2025-2030 ($ million)
Data Table on Mexico - Market size and forecast 2025-2030 ($ million)
Chart on Mexico - Year-over-year growth 2025-2030 (%)
Data Table on Mexico - Year-over-year growth 2025-2030 (%)

12.5 Europe - Market size and forecast 2025-2030

Chart on Europe - Market size and forecast 2025-2030 ($ million)
Data Table on Europe - Market size and forecast 2025-2030 ($ million)
Chart on Europe - Year-over-year growth 2025-2030 (%)
Data Table on Europe - Year-over-year growth 2025-2030 (%)
Chart on Regional Comparison - Europe
Data Table on Regional Comparison - Europe

12.5.1 Germany - Market size and forecast 2025-2030

Chart on Germany - Market size and forecast 2025-2030 ($ million)
Data Table on Germany - Market size and forecast 2025-2030 ($ million)
Chart on Germany - Year-over-year growth 2025-2030 (%)
Data Table on Germany - Year-over-year growth 2025-2030 (%)

12.5.2 UK - Market size and forecast 2025-2030

Chart on UK - Market size and forecast 2025-2030 ($ million)
Data Table on UK - Market size and forecast 2025-2030 ($ million)
Chart on UK - Year-over-year growth 2025-2030 (%)
Data Table on UK - Year-over-year growth 2025-2030 (%)

12.5.3 France - Market size and forecast 2025-2030

Chart on France - Market size and forecast 2025-2030 ($ million)
Data Table on France - Market size and forecast 2025-2030 ($ million)
Chart on France - Year-over-year growth 2025-2030 (%)
Data Table on France - Year-over-year growth 2025-2030 (%)

12.5.4 Italy - Market size and forecast 2025-2030

Chart on Italy - Market size and forecast 2025-2030 ($ million)
Data Table on Italy - Market size and forecast 2025-2030 ($ million)
Chart on Italy - Year-over-year growth 2025-2030 (%)
Data Table on Italy - Year-over-year growth 2025-2030 (%)

12.5.5 Spain - Market size and forecast 2025-2030

Chart on Spain - Market size and forecast 2025-2030 ($ million)
Data Table on Spain - Market size and forecast 2025-2030 ($ million)
Chart on Spain - Year-over-year growth 2025-2030 (%)
Data Table on Spain - Year-over-year growth 2025-2030 (%)

12.5.6 The Netherlands - Market size and forecast 2025-2030

Chart on The Netherlands - Market size and forecast 2025-2030 ($ million)
Data Table on The Netherlands - Market size and forecast 2025-2030 ($ million)
Chart on The Netherlands - Year-over-year growth 2025-2030 (%)
Data Table on The Netherlands - Year-over-year growth 2025-2030 (%)

12.6 Middle East and Africa - Market size and forecast 2025-2030

Chart on Middle East and Africa - Market size and forecast 2025-2030 ($ million)
Data Table on Middle East and Africa - Market size and forecast 2025-2030 ($ million)
Chart on Middle East and Africa - Year-over-year growth 2025-2030 (%)
Data Table on Middle East and Africa - Year-over-year growth 2025-2030 (%)
Chart on Regional Comparison - Middle East and Africa
Data Table on Regional Comparison - Middle East and Africa

12.6.1 UAE - Market size and forecast 2025-2030

Chart on UAE - Market size and forecast 2025-2030 ($ million)
Data Table on UAE - Market size and forecast 2025-2030 ($ million)
Chart on UAE - Year-over-year growth 2025-2030 (%)
Data Table on UAE - Year-over-year growth 2025-2030 (%)

12.6.2 Saudi Arabia - Market size and forecast 2025-2030

Chart on Saudi Arabia - Market size and forecast 2025-2030 ($ million)
Data Table on Saudi Arabia - Market size and forecast 2025-2030 ($ million)
Chart on Saudi Arabia - Year-over-year growth 2025-2030 (%)
Data Table on Saudi Arabia - Year-over-year growth 2025-2030 (%)

12.6.3 South Africa - Market size and forecast 2025-2030

Chart on South Africa - Market size and forecast 2025-2030 ($ million)
Data Table on South Africa - Market size and forecast 2025-2030 ($ million)
Chart on South Africa - Year-over-year growth 2025-2030 (%)
Data Table on South Africa - Year-over-year growth 2025-2030 (%)

12.6.4 Israel - Market size and forecast 2025-2030

Chart on Israel - Market size and forecast 2025-2030 ($ million)
Data Table on Israel - Market size and forecast 2025-2030 ($ million)
Chart on Israel - Year-over-year growth 2025-2030 (%)
Data Table on Israel - Year-over-year growth 2025-2030 (%)

12.6.5 Turkey - Market size and forecast 2025-2030

Chart on Turkey - Market size and forecast 2025-2030 ($ million)
Data Table on Turkey - Market size and forecast 2025-2030 ($ million)
Chart on Turkey - Year-over-year growth 2025-2030 (%)
Data Table on Turkey - Year-over-year growth 2025-2030 (%)

12.7 South America - Market size and forecast 2025-2030

Chart on South America - Market size and forecast 2025-2030 ($ million)
Data Table on South America - Market size and forecast 2025-2030 ($ million)
Chart on South America - Year-over-year growth 2025-2030 (%)
Data Table on South America - Year-over-year growth 2025-2030 (%)
Chart on Regional Comparison - South America
Data Table on Regional Comparison - South America

12.7.1 Brazil - Market size and forecast 2025-2030

Chart on Brazil - Market size and forecast 2025-2030 ($ million)
Data Table on Brazil - Market size and forecast 2025-2030 ($ million)
Chart on Brazil - Year-over-year growth 2025-2030 (%)
Data Table on Brazil - Year-over-year growth 2025-2030 (%)

12.7.2 Argentina - Market size and forecast 2025-2030

Chart on Argentina - Market size and forecast 2025-2030 ($ million)
Data Table on Argentina - Market size and forecast 2025-2030 ($ million)
Chart on Argentina - Year-over-year growth 2025-2030 (%)
Data Table on Argentina - Year-over-year growth 2025-2030 (%)

12.7.3 Chile - Market size and forecast 2025-2030

Chart on Chile - Market size and forecast 2025-2030 ($ million)
Data Table on Chile - Market size and forecast 2025-2030 ($ million)
Chart on Chile - Year-over-year growth 2025-2030 (%)
Data Table on Chile - Year-over-year growth 2025-2030 (%)

12.8 Market opportunity by geography

Market opportunity by geography ($ million)
Data Tables on Market opportunity by geography ($ million)

13. Drivers, Challenges, and Opportunity

13.1 Market drivers

Heightened parental investment in early childhood cognitive development and career readiness
Governmental curricular reforms and integration of STEM into national education standards
Technological democratization and proliferation of low-cost micro-electronics

13.2 Market challenges

High manufacturing costs and complexity of price sensitivity
Short product life cycles and rapid obsolescence of technical content
Data privacy concerns and regulatory compliance frameworks

13.3 Impact of drivers and challenges

Impact of drivers and challenges in 2025 and 2030

13.4 Market opportunities

Integration of artificial intelligence and adaptive learning technologies
Sustainability and transition to eco-friendly materials
Expansion of hybrid play and screen-free coding solutions

14. Competitive Landscape

14.1 Overview

14.2

Overview on criticality of inputs and factors of differentiation

14.3 Landscape disruption

Overview on factors of disruption

14.4 Industry risks

Impact of key risks on business

15. Competitive Analysis

15.1 Companies profiled

Companies covered

15.2 Company ranking index

15.3 Market positioning of companies

Matrix on companies position and classification

15.4 BASIC FUN Inc.

BASIC FUN Inc. - Overview
BASIC FUN Inc. - Product / Service
BASIC FUN Inc. - Key offerings
SWOT

15.5 Elenco Electronics Inc.

Elenco Electronics Inc. - Overview
Elenco Electronics Inc. - Product / Service
Elenco Electronics Inc. - Key offerings
SWOT

15.6 Gigo Toys Inc

Gigo Toys Inc - Overview
Gigo Toys Inc - Product / Service
Gigo Toys Inc - Key offerings
SWOT

15.7 GoldieBlox Inc.

GoldieBlox Inc. - Overview
GoldieBlox Inc. - Product / Service
GoldieBlox Inc. - Key offerings
SWOT

15.8 Hasbro Inc.

Hasbro Inc. - Overview
Hasbro Inc. - Business segments
Hasbro Inc. - Key offerings
Hasbro Inc. - Segment focus
SWOT

15.9 KiwiCo Inc.

KiwiCo Inc. - Overview
KiwiCo Inc. - Product / Service
KiwiCo Inc. - Key offerings
SWOT

15.10 Learning Resources Ltd.

Learning Resources Ltd. - Overview
Learning Resources Ltd. - Product / Service
Learning Resources Ltd. - Key offerings
SWOT

15.11 LEGO System AS

LEGO System AS - Overview
LEGO System AS - Product / Service
LEGO System AS - Key offerings
SWOT

15.12 littleBits Electronics Inc

littleBits Electronics Inc - Overview
littleBits Electronics Inc - Product / Service
littleBits Electronics Inc - Key offerings
SWOT

15.13 Makeblock Co. Ltd.

Makeblock Co. Ltd. - Overview
Makeblock Co. Ltd. - Product / Service
Makeblock Co. Ltd. - Key offerings
SWOT

15.14 Mattel Inc.

Mattel Inc. - Overview
Mattel Inc. - Business segments
Mattel Inc. - Key offerings
Mattel Inc. - Segment focus
SWOT

15.15 Ravensburger AG

Ravensburger AG - Overview
Ravensburger AG - Product / Service
Ravensburger AG - Key offerings
SWOT

15.16 Tangible Play Inc.

Tangible Play Inc. - Overview
Tangible Play Inc. - Product / Service
Tangible Play Inc. - Key offerings
SWOT

15.17 VTech Holdings Ltd.

VTech Holdings Ltd. - Overview
VTech Holdings Ltd. - Business segments
VTech Holdings Ltd. - Key offerings
VTech Holdings Ltd. - Segment focus
SWOT

15.18 Wonder Workshop Inc.

Wonder Workshop Inc. - Overview
Wonder Workshop Inc. - Product / Service
Wonder Workshop Inc. - Key offerings
SWOT

16. Appendix

16.1 Scope of the report

Market definition
Objectives
Notes and caveats

16.2 Inclusions and exclusions checklist

Inclusions checklist
Exclusions checklist

16.3 Currency conversion rates for US$

16.4 Research methodology

16.5 Data procurement

Information sources

16.6 Data validation

16.7 Validation techniques employed for market sizing

16.8 Data synthesis

16.9 360 degree market analysis

16.10 List of abbreviations

Research Methodology

Technavio presents a detailed picture of the market by way of study, synthesis, and summation of data from multiple sources. The analysts have presented the various facets of the market with a particular focus on identifying the key industry influencers. The data thus presented is comprehensive, reliable, and the result of extensive research, both primary and secondary.

INFORMATION SOURCES

Primary sources

  • Manufacturers and suppliers
  • Channel partners
  • Industry experts
  • Strategic decision makers

Secondary sources

  • Industry journals and periodicals
  • Government data
  • Financial reports of key industry players
  • Historical data
  • Press releases

DATA ANALYSIS

Data Synthesis

  • Collation of data
  • Estimation of key figures
  • Analysis of derived insights

Data Validation

  • Triangulation with data models
  • Reference against proprietary databases
  • Corroboration with industry experts

REPORT WRITING

Qualitative

  • Market drivers
  • Market challenges
  • Market trends
  • Five forces analysis

Quantitative

  • Market size and forecast
  • Market segmentation
  • Geographical insights
  • Competitive landscape

Interested in this report?

Get your sample now to see our research methodology and insights!

Download Now

Frequently Asked Questions

Science, Technology, Engineering, And Mathematics (STEM) Toys market growth will increase by USD 7315.4 million during 2026-2030.

The Science, Technology, Engineering, And Mathematics (STEM) Toys market is expected to grow at a CAGR of 7.7% during 2026-2030.

Science, Technology, Engineering, And Mathematics (STEM) Toys market is segmented by Application (In-home, In-school) Age group (Between 9-10 years, Between 6-8 years, Between 11-13 years) Subjects (Science, Engineering, Mathematics, Technology)

ANKI LLC., BASIC FUN Inc., Elenco Electronics Inc., Gigo Toys Inc, GoldieBlox Inc., Hasbro Inc., KiwiCo Inc., Learning Resources Ltd., LEGO System AS, littleBits Electronics Inc, Makeblock Co. Ltd., Mattel Inc., Melissa and Doug, Ozo EDU Inc., Ravensburger AG, ScienceWiz Inc, Spin Master Corp., Tangible Play Inc., VTech Holdings Ltd., Wonder Workshop Inc. are a few of the key vendors in the Science, Technology, Engineering, And Mathematics (STEM) Toys market.

APAC will register the highest growth rate of 43.2% among the other regions. Therefore, the Science, Technology, Engineering, And Mathematics (STEM) Toys market in APAC is expected to garner significant business opportunities for the vendors during the forecast period.

China, Japan, India, South Korea, Australia, Indonesia, US, Canada, Mexico, Germany, UK, France, Italy, Spain, The Netherlands, UAE, Saudi Arabia, South Africa, Israel, Turkey, Brazil, Argentina, Chile

  • Heightened parental investment in early childhood cognitive development and career readiness is the driving factor this market.

The Science, Technology, Engineering, And Mathematics (STEM) Toys market vendors should focus on grabbing business opportunities from the Application segment as it accounted for the largest market share in the base year.
RIA - Research AI Assistant
Ask RIA