Plasma Lamp Market Analysis, Size, and Forecast 2026-2030: Europe (Germany, UK, and France), APAC (China, Japan, and India), North America (US, Canada, and Mexico), Middle East and Africa (Saudi Arabia, UAE, and South Africa), South America (Brazil and Argentina), and Rest of World (ROW)

Plasma Lamp Market Analysis, Size, and Forecast 2026-2030:
Europe (Germany, UK, and France), APAC (China, Japan, and India), North America (US, Canada, and Mexico), Middle East and Africa (Saudi Arabia, UAE, and South Africa), South America (Brazil and Argentina), and Rest of World (ROW)

Published: Apr 2026 298 Pages SKU: IRTNTR74523

Market Overview at a Glance

$170.1 Mn
Market Opportunity
4.7%
CAGR 2025 - 2030
34.6%
Europe Growth
$345.2 Mn
300 Watt segment 2024

Plasma Lamp Market Size 2026-2030

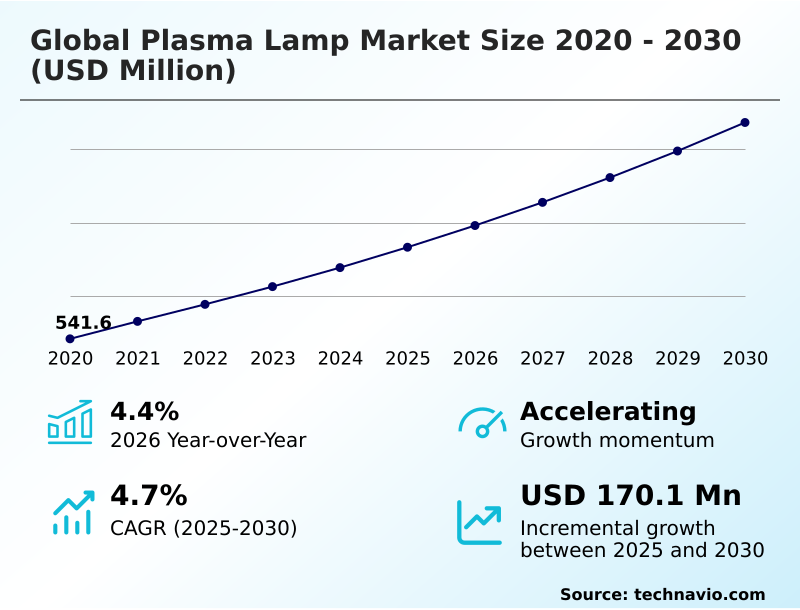
The plasma lamp market size is valued to increase by USD 170.1 million, at a CAGR of 4.7% from 2025 to 2030. Rising integration of plasma technology in controlled environment agriculture will drive the plasma lamp market.

Major Market Trends & Insights

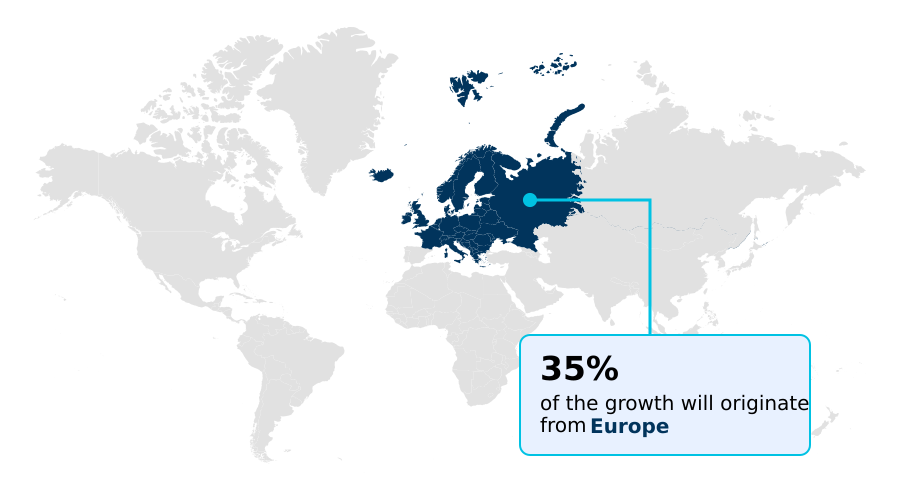
  • Europe dominated the market and accounted for a 34.6% growth during the forecast period.
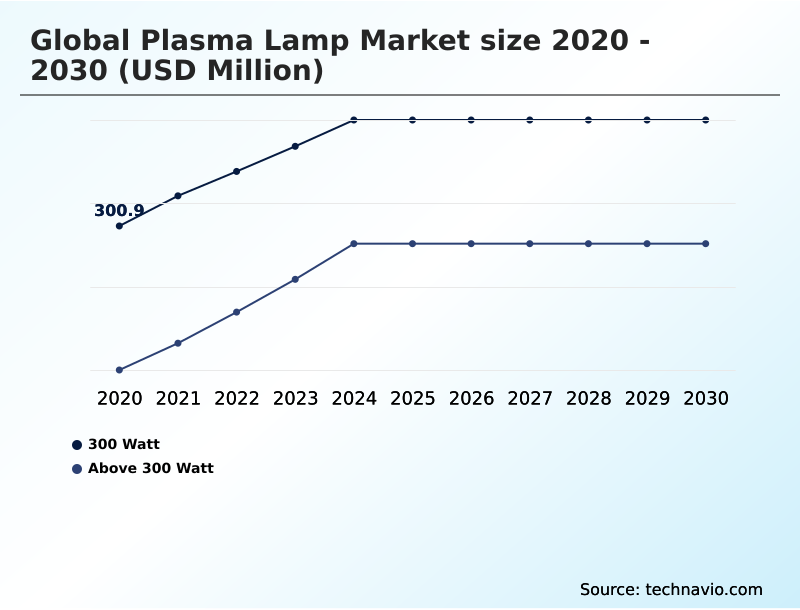
  • By Type - 300 Watt segment was valued at USD 345.2 million in 2024
  • By Application - Industrial segment accounted for the largest market revenue share in 2024

Market Size & Forecast

  • Market Opportunities: USD 295 million
  • Market Future Opportunities: USD 170.1 million
  • CAGR from 2025 to 2030 : 4.7%

Market Summary

  • The Plasma Lamp Market is undergoing a significant transformation, moving beyond niche applications to become a critical component in high-performance sectors. This evolution is driven by the unique capabilities of electrodeless plasma technology, which utilizes radio frequency power to excite a noble gas mixture within a durable quartz bulb.
  • The resulting high-intensity discharge produces a continuous spectrum light, closely mimicking natural sunlight. This characteristic is indispensable in fields like controlled environment agriculture, where spectral precision directly impacts crop yield and quality. For example, a large-scale vertical farming operator can leverage this technology for superior canopy penetration, achieving more uniform growth and reducing harvest cycle times, thereby enhancing operational efficiency.
  • While high initial costs compared to mainstream LED solutions present a challenge, the extended lifespan, minimal lumen depreciation, and high color rendering index of plasma lamps ensure a strong value proposition for industrial, scientific, and infrastructure applications where performance cannot be compromised. The technology's resilience in harsh environments further solidifies its role in mission-critical systems.

What will be the Size of the Plasma Lamp Market during the forecast period?

Get Key Insights on Market Forecast (PDF) Request Free Sample

How is the Plasma Lamp Market Segmented?

The plasma lamp industry research report provides comprehensive data (region-wise segment analysis), with forecasts and estimates in "USD million" for the period 2026-2030, as well as historical data from 2020-2024 for the following segments.

  • Type
    • 300 Watt
    • Above 300 Watt
  • Application
    • Industrial
    • Roadways and tunnels
    • Sports and entertainment
    • Horticulture
    • Others
  • Distribution channel
    • Retail
    • E-commerce
    • Direct sales
  • Geography
    • Europe
      • Germany
      • UK
      • France
    • APAC
      • China
      • Japan
      • India
    • North America
      • US
      • Canada
      • Mexico
    • Middle East and Africa
      • Saudi Arabia
      • UAE
      • South Africa
    • South America
      • Brazil
      • Argentina
    • Rest of World (ROW)

By Type Insights

The 300 watt segment is estimated to witness significant growth during the forecast period.

The 300-watt segment is pivotal, characterized by demands for efficient, moderate-intensity illumination balancing energy consumption with light output.

This wattage, utilizing advanced waveguide technologies and electrodeless plasma technology, is optimal for precision agriculture, where it provides a continuous spectrum light for controlled environment agriculture without the excess heat that can damage crops.

This spectral precision promotes vigorous plant growth. In commercial facilities, these units are used for high-bay lighting, enhancing visual clarity, while their electrode-less design extends operational lifespan, reducing replacement frequencies by over 60% compared to legacy systems.

Scientific sectors also rely on this wattage for the luminous efficacy required in precision testing equipment and medical sterilization.

Request Free Sample

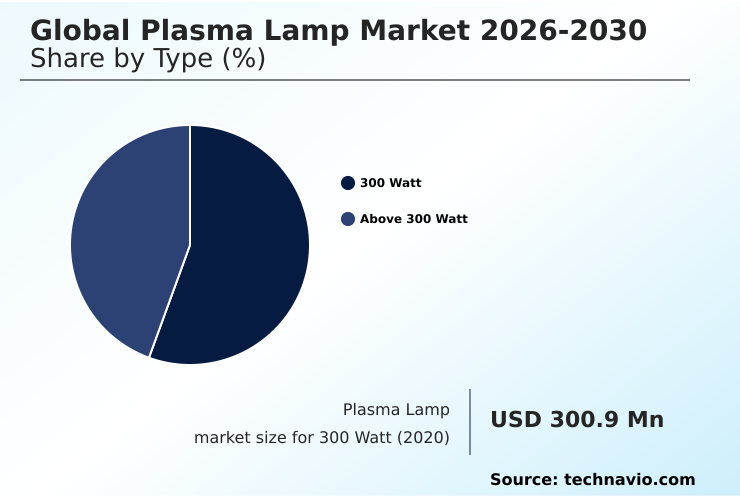
The 300 Watt segment was valued at USD 345.2 million in 2024 and showed a gradual increase during the forecast period.

Request Free Sample

Regional Analysis

Europe is estimated to contribute 34.6% to the growth of the global market during the forecast period.Technavio’s analysts have elaborately explained the regional trends and drivers that shape the market during the forecast period.

See How Plasma Lamp Market Demand is Rising in Europe Request Free Sample

The geographic landscape of the market is characterized by distinct regional drivers and adoption patterns.

Europe currently leads, accounting for over 34% of the market opportunity, a position reinforced by stringent environmental regulations favoring mercury-free, high-efficacy lighting and early adoption in roadway and tunnel lighting.

The region's focus on gas-discharge physics and advanced scientific instrumentation also supports innovation. In contrast, APAC is the fastest-growing region, driven by rapid industrialization and government-led smart city initiatives.

Manufacturing hubs in the region are integrating plasma for high-bay lighting and industrial process monitoring, achieving an average 20% improvement in energy efficiency.

This dual dynamic of mature, regulation-driven adoption in Europe and rapid, infrastructure-focused growth in APAC defines the market's global trajectory, with specialized applications like UV curing systems gaining traction across both regions.

Market Dynamics

Our researchers analyzed the data with 2025 as the base year, along with the key drivers, trends, and challenges. A holistic analysis of drivers will help companies refine their marketing strategies to gain a competitive advantage.

  • Strategic decisions around lighting technology are increasingly complex, weighing the benefits and costs of various advanced systems. The use of plasma lamp for indoor horticulture is a key area of interest, where full-spectrum plasma grow lights offer distinct advantages. When considering plasma lamp vs LED for agriculture, factors like canopy penetration and spectral completeness are critical differentiators.
  • Beyond agriculture, high-intensity plasma for stadium lighting is becoming standard for broadcast-quality illumination, while electrode-less plasma industrial lighting offers durability in harsh environments. The inherent benefits of plasma lighting in tunnels include superior visibility and reduced maintenance. Specialized applications continue to expand, from UV plasma for medical disinfection to the use of plasma lamp for scientific research.
  • However, adoption is tempered by the high cost of plasma lighting systems and considerations regarding maintenance of plasma lighting systems, which, while infrequent, requires specialized expertise. Facility managers report that maintenance cycles for plasma systems are half as frequent as those for metal halide equivalents, significantly impacting operational budgets.
  • Furthermore, plasma lamp electromagnetic interference issues must be addressed through careful engineering to ensure compliance, particularly in sensitive electronic environments.

What are the key market drivers leading to the rise in the adoption of Plasma Lamp Industry?

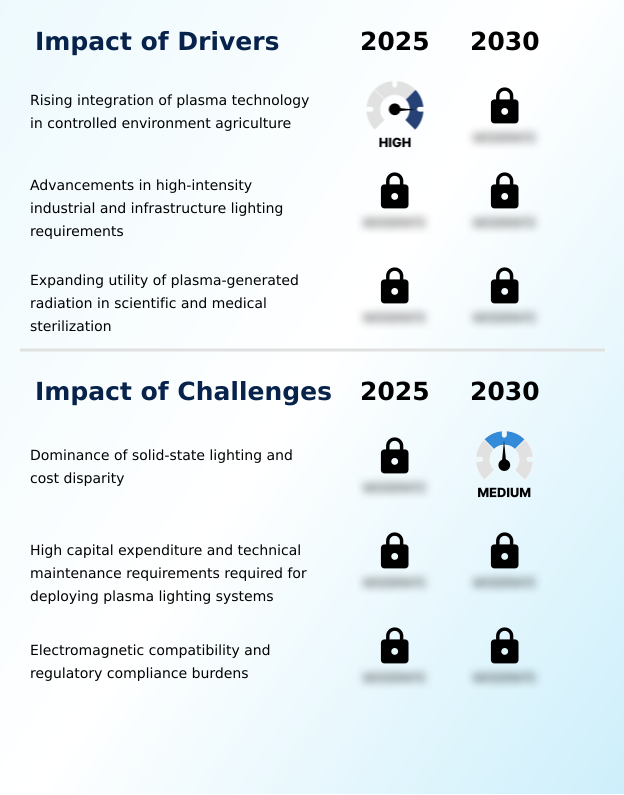
  • The rising integration of plasma technology within controlled environment agriculture, particularly for its ability to mimic natural sunlight, stands as a key driver for market growth.

  • Market growth is propelled by advancements in high-intensity industrial and infrastructure lighting. In high-mast applications, plasma lamps are enhancing visibility by over 25% compared to traditional metal halide lights, a critical factor for safety in ports and airports.
  • The expanding use of plasma-generated radiation in scientific and medical sterilization provides another major driver, with systems achieving 99.9% pathogen neutralization rates. This capability, combined with the technology's mercury-free design, aligns with stringent global hygiene standards.
  • Furthermore, the utility of plasma in industrial UV curing systems and as a metrology light source for the semiconductor industry showcases its versatility.
  • This cross-industry adoption for specialized technical tasks is cementing its role as an indispensable technology for precision and reliability.

What are the market trends shaping the Plasma Lamp Industry?

  • A key market trend is the growing adoption of plasma lighting in commercial horticulture and vertical farming, driven by the technology's ability to enhance crop yields and quality.

  • Key market trends are driven by the adoption of high-performance lighting in specialized sectors. The integration of plasma systems in commercial horticulture and vertical farming is accelerating, as these technologies enhance photosynthetic photon flux density by up to 15%, directly improving crop yields.
  • Concurrently, their use in urban infrastructure is expanding, particularly for roadway and tunnel lighting, where superior visibility in adverse conditions can reduce accident rates. Within smart city initiatives, these advanced fixtures are reducing maintenance dispatches by 30%.
  • This trend is supported by ongoing advancements in specialized UV plasma applications for medical sterilization and industrial process monitoring, where the technology's reliability and high-intensity output are critical. The demand for aquascaping illumination and broadcast-quality lighting for entertainment venues further diversifies the application landscape.

What challenges does the Plasma Lamp Industry face during its growth?

  • The market dominance of solid-state lighting, coupled with a significant initial cost disparity, presents a key challenge to the plasma lamp industry's widespread adoption and growth.

  • The primary challenge remains the market dominance of solid-state lighting and a significant cost disparity. The initial capital outlay for a plasma lighting system is often 3x higher than for comparable high-output LED fixtures, creating a substantial barrier to entry for many potential users.
  • Furthermore, technical complexities related to electromagnetic compatibility and regulatory compliance add to the overall cost and development time. Ensuring systems do not cause interference requires sophisticated engineering, which can add up to 15% to the total unit cost.
  • These factors, combined with the high capital expenditure for deployment and the need for specialized maintenance knowledge, confine plasma technology to niche applications where its unique performance characteristics, like its use in satellite component testing, justify the premium investment.

Exclusive Technavio Analysis on Customer Landscape

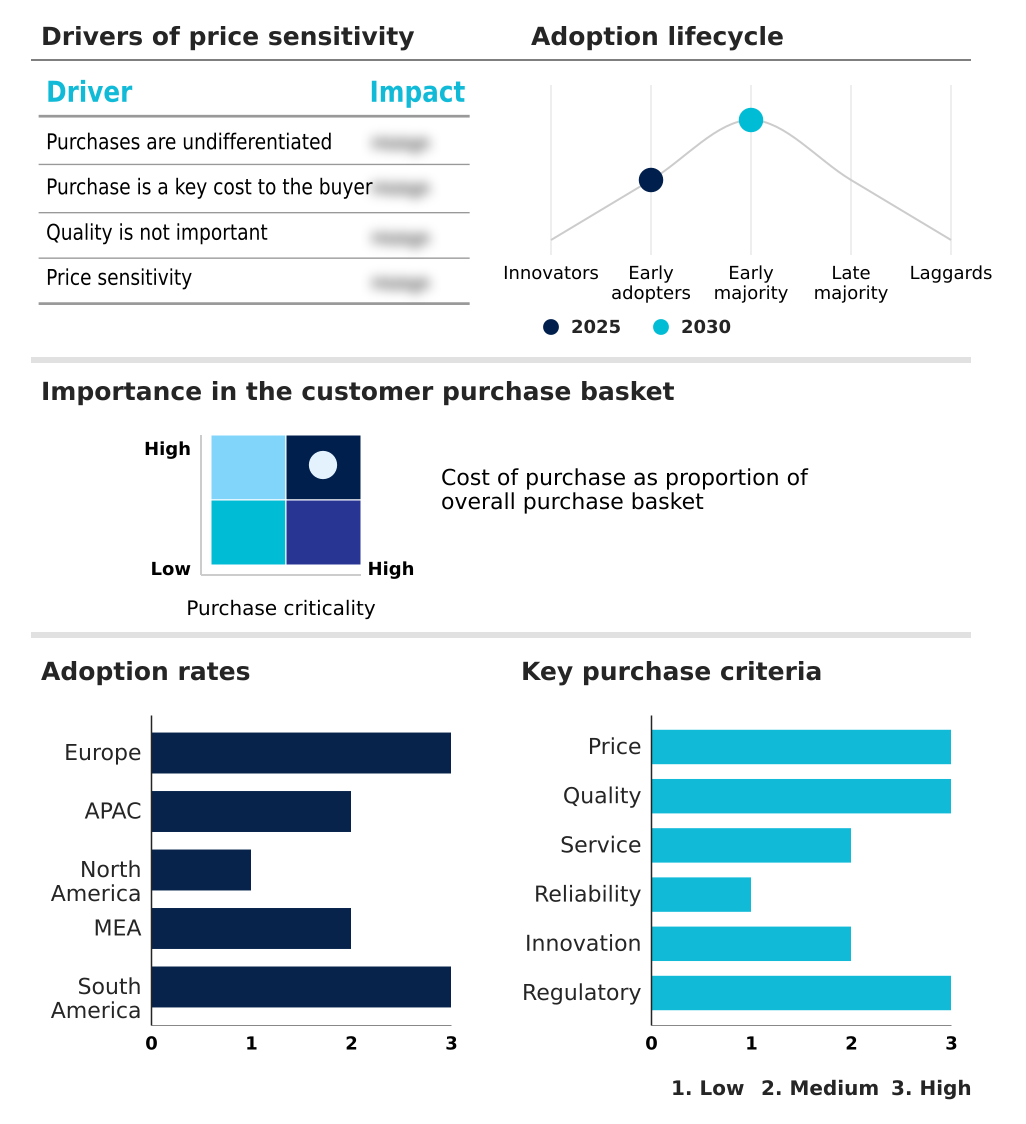
The plasma lamp market forecasting report includes the adoption lifecycle of the market, covering from the innovator’s stage to the laggard’s stage. It focuses on adoption rates in different regions based on penetration. Furthermore, the plasma lamp market report also includes key purchase criteria and drivers of price sensitivity to help companies evaluate and develop their market growth analysis strategies.

Customer Landscape of Plasma Lamp Industry

Competitive Landscape

Companies are implementing various strategies, such as strategic alliances, plasma lamp market forecast, partnerships, mergers and acquisitions, geographical expansion, and product/service launches, to enhance their presence in the industry.

Ceravision Ltd. - Offerings center on high-intensity, full-spectrum illumination systems engineered for specialized industrial, horticultural, and scientific applications where performance and reliability are critical.

The industry research and growth report includes detailed analyses of the competitive landscape of the market and information about key companies, including:

  • Ceravision Ltd.
  • Endura LED
  • Excelitas Technologies Corp.
  • Foshan Electrical and Lighting
  • Griffin and Ray Inc.
  • Hamamatsu Photonics KK
  • Heraeus Holding GmbH
  • Hive Lighting Inc.
  • Ka Shui International Holdings
  • LG Electronics Inc.
  • Lumileds Holding BV
  • Luxim Corp
  • Opple Lighting Co. Ltd.
  • Panasonic Holdings Corp.
  • Plasma International
  • PLS GmbH
  • Seoul Semiconductor Co. Ltd.
  • Signify NV
  • Sunle Lighting Co Ltd
  • Ushio Inc.

Qualitative and quantitative analysis of companies has been conducted to help clients understand the wider business environment as well as the strengths and weaknesses of key industry players. Data is qualitatively analyzed to categorize companies as pure play, category-focused, industry-focused, and diversified; it is quantitatively analyzed to categorize companies as dominant, leading, strong, tentative, and weak.

Recent Development and News in Plasma lamp market

  • In April 2025, Ushio Inc. completed its acquisition of the industrial and entertainment lamp business from ams OSRAM, significantly expanding its production capacity for high-performance plasma systems.
  • In March 2025, Musco Lighting announced a strategic partnership with the Bahrain International Circuit to upgrade the motorsport track's lighting to high-intensity plasma fixtures for broadcast-quality illumination.
  • In February 2025, Hefei CASM Technology Co., Ltd. launched a new series of light-emitting plasma modules for large-scale greenhouses, featuring a solid-state microwave source that increases photosynthetic photon flux density.
  • In December 2024, Energetiq Technology confirmed the successful deployment of its advanced laser-driven plasma light source in a high-precision metrology project, enabling next-generation semiconductor wafer inspection.

Dive into Technavio’s robust research methodology, blending expert interviews, extensive data synthesis, and validated models for unparalleled Plasma Lamp Market insights. See full methodology.

Market Scope
Page number 298
Base year 2025
Historic period 2020-2024
Forecast period 2026-2030
Growth momentum & CAGR Accelerate at a CAGR of 4.7%
Market growth 2026-2030 USD 170.1 million
Market structure Fragmented
YoY growth 2025-2026(%) 4.4%
Key countries Germany, UK, France, Italy, Spain, The Netherlands, China, Japan, India, South Korea, Australia, Indonesia, US, Canada, Mexico, Saudi Arabia, UAE, South Africa, Israel, Turkey, Brazil, Argentina and Chile
Competitive landscape Leading Companies, Market Positioning of Companies, Competitive Strategies, and Industry Risks

Request Free Sample

Research Analyst Overview

  • The market is defined by a strategic pivot toward applications demanding superior performance metrics, where electrodeless plasma technology provides a distinct advantage. This technology, powered by radio frequency power and sophisticated microwave generators, creates a high-intensity discharge within a noble gas mixture contained in a quartz bulb, resulting in unparalleled spectral precision and a high color rendering index.
  • The shift toward integrating UVC spectrum capabilities for industrial and medical sterilization represents a key boardroom-level decision, impacting corporate strategy around safety and compliance. Systems featuring this technology have demonstrated up to a 50% reduction in lumen depreciation over 10,000 hours of continuous operation. The technology's continuous spectrum light offers superior thermal management and luminous efficacy compared to legacy systems.
  • This makes light-emitting plasma solutions, which utilize advanced magnetrons and RF drivers, indispensable for applications where light quality and long-term reliability are paramount, including solar simulation and high-stakes industrial inspections.

What are the Key Data Covered in this Plasma Lamp Market Research and Growth Report?

  • What is the expected growth of the Plasma Lamp Market between 2026 and 2030?

    • USD 170.1 million, at a CAGR of 4.7%

  • What segmentation does the market report cover?

    • The report is segmented by Type (300 Watt, and Above 300 Watt), Application (Industrial, Roadways and tunnels, Sports and entertainment, Horticulture, and Others), Distribution Channel (Retail, E-commerce, and Direct sales) and Geography (Europe, APAC, North America, Middle East and Africa, South America)

  • Which regions are analyzed in the report?

    • Europe, APAC, North America, Middle East and Africa and South America

  • What are the key growth drivers and market challenges?

    • Rising integration of plasma technology in controlled environment agriculture, Dominance of solid-state lighting and cost disparity

  • Who are the major players in the Plasma Lamp Market?

    • Ceravision Ltd., Endura LED, Excelitas Technologies Corp., Foshan Electrical and Lighting, Griffin and Ray Inc., Hamamatsu Photonics KK, Heraeus Holding GmbH, Hive Lighting Inc., Ka Shui International Holdings, LG Electronics Inc., Lumileds Holding BV, Luxim Corp, Opple Lighting Co. Ltd., Panasonic Holdings Corp., Plasma International, PLS GmbH, Seoul Semiconductor Co. Ltd., Signify NV, Sunle Lighting Co Ltd and Ushio Inc.

Market Research Insights

  • Market dynamics are shaped by a strategic shift toward high-value applications where performance outweighs initial cost. The integration of plasma systems into smart city infrastructure and public transit corridors is accelerating, as these solutions demonstrate a 40% reduction in required maintenance cycles over legacy high-pressure sodium lamps.
  • Simultaneously, adoption in precision agriculture and vertical farming is driven by measurable quality improvements, with some operators reporting a 15% increase in secondary metabolite production in high-value crops. This growth is supported by demand from specialized sectors like scientific instrumentation and automotive materials testing.
  • Use in broadcast-quality lighting for sports venues also highlights the technology's superior performance, where its flicker-free operation is a key requirement.

We can help! Our analysts can customize this plasma lamp market research report to meet your requirements.

Get in touch

1. Executive Summary

1.1 Market overview

Executive Summary - Chart on Market Overview
Executive Summary - Data Table on Market Overview
Executive Summary - Chart on Global Market Characteristics
Executive Summary - Chart on Market by Geography
Executive Summary - Chart on Market Segmentation by Type
Executive Summary - Chart on Market Segmentation by Application
Executive Summary - Chart on Market Segmentation by Distribution Channel
Executive Summary - Chart on Incremental Growth
Executive Summary - Data Table on Incremental Growth
Executive Summary - Chart on Company Market Positioning

2. Technavio Analysis

2.1 Analysis of price sensitivity, lifecycle, customer purchase basket, adoption rates, and purchase criteria

2.2 Criticality of inputs and Factors of differentiation

Chart on Overview on criticality of inputs and factors of differentiation

2.3 Factors of disruption

Chart on Overview on factors of disruption

2.4 Impact of drivers and challenges

Chart on Impact of drivers and challenges in 2025 and 2030

3. Market Landscape

3.1 Market ecosystem

Chart on Parent Market
Data Table on - Parent Market

3.2 Market characteristics

Chart on Market characteristics analysis

3.3 Value chain analysis

Chart on Value chain analysis

4. Market Sizing

4.1 Market definition

Data Table on Offerings of companies included in the market definition

4.2 Market segment analysis

Market segments

4.3 Market size 2025

4.4 Market outlook: Forecast for 2025-2030

Chart on Global - Market size and forecast 2025-2030 ($ million)
Data Table on Global - Market size and forecast 2025-2030 ($ million)
Chart on Global Market: Year-over-year growth 2025-2030 (%)
Data Table on Global Market: Year-over-year growth 2025-2030 (%)

5. Historic Market Size

5.1 Global Plasma Lamp Market 2020 - 2024

Historic Market Size - Data Table on Global Plasma Lamp Market 2020 - 2024 ($ million)

5.2 Type segment analysis 2020 - 2024

Historic Market Size - Type Segment 2020 - 2024 ($ million)

5.3 Application segment analysis 2020 - 2024

Historic Market Size - Application Segment 2020 - 2024 ($ million)

5.4 Distribution Channel segment analysis 2020 - 2024

Historic Market Size - Distribution Channel Segment 2020 - 2024 ($ million)

5.5 Geography segment analysis 2020 - 2024

Historic Market Size - Geography Segment 2020 - 2024 ($ million)

5.6 Country segment analysis 2020 - 2024

Historic Market Size - Country Segment 2020 - 2024 ($ million)

6. Qualitative Analysis

6.1 Impact of AI on Global Plasma Lamp Market

6.2 Impact of Geopolitical Conflicts on Global Plasma Lamp Market

7. Five Forces Analysis

7.1 Five forces summary

Five forces analysis - Comparison between 2025 and 2030

7.2 Bargaining power of buyers

Bargaining power of buyers - Impact of key factors 2025 and 2030

7.3 Bargaining power of suppliers

Bargaining power of suppliers - Impact of key factors in 2025 and 2030

7.4 Threat of new entrants

Threat of new entrants - Impact of key factors in 2025 and 2030

7.5 Threat of substitutes

Threat of substitutes - Impact of key factors in 2025 and 2030

7.6 Threat of rivalry

Threat of rivalry - Impact of key factors in 2025 and 2030

7.7 Market condition

Chart on Market condition - Five forces 2025 and 2030

8. Market Segmentation by Type

8.1 Market segments

Chart on Type - Market share 2025-2030 (%)
Data Table on Type - Market share 2025-2030 (%)

8.2 Comparison by Type

Chart on Comparison by Type
Data Table on Comparison by Type

8.3 300 Watt - Market size and forecast 2025-2030

Chart on 300 Watt - Market size and forecast 2025-2030 ($ million)
Data Table on 300 Watt - Market size and forecast 2025-2030 ($ million)
Chart on 300 Watt - Year-over-year growth 2025-2030 (%)
Data Table on 300 Watt - Year-over-year growth 2025-2030 (%)

8.4 Above 300 Watt - Market size and forecast 2025-2030

Chart on Above 300 Watt - Market size and forecast 2025-2030 ($ million)
Data Table on Above 300 Watt - Market size and forecast 2025-2030 ($ million)
Chart on Above 300 Watt - Year-over-year growth 2025-2030 (%)
Data Table on Above 300 Watt - Year-over-year growth 2025-2030 (%)

8.5 Market opportunity by Type

Market opportunity by Type ($ million)
Data Table on Market opportunity by Type ($ million)

9. Market Segmentation by Application

9.1 Market segments

Chart on Application - Market share 2025-2030 (%)
Data Table on Application - Market share 2025-2030 (%)

9.2 Comparison by Application

Chart on Comparison by Application
Data Table on Comparison by Application

9.3 Industrial - Market size and forecast 2025-2030

Chart on Industrial - Market size and forecast 2025-2030 ($ million)
Data Table on Industrial - Market size and forecast 2025-2030 ($ million)
Chart on Industrial - Year-over-year growth 2025-2030 (%)
Data Table on Industrial - Year-over-year growth 2025-2030 (%)

9.4 Roadways and tunnels - Market size and forecast 2025-2030

Chart on Roadways and tunnels - Market size and forecast 2025-2030 ($ million)
Data Table on Roadways and tunnels - Market size and forecast 2025-2030 ($ million)
Chart on Roadways and tunnels - Year-over-year growth 2025-2030 (%)
Data Table on Roadways and tunnels - Year-over-year growth 2025-2030 (%)

9.5 Sports and entertainment - Market size and forecast 2025-2030

Chart on Sports and entertainment - Market size and forecast 2025-2030 ($ million)
Data Table on Sports and entertainment - Market size and forecast 2025-2030 ($ million)
Chart on Sports and entertainment - Year-over-year growth 2025-2030 (%)
Data Table on Sports and entertainment - Year-over-year growth 2025-2030 (%)

9.6 Horticulture - Market size and forecast 2025-2030

Chart on Horticulture - Market size and forecast 2025-2030 ($ million)
Data Table on Horticulture - Market size and forecast 2025-2030 ($ million)
Chart on Horticulture - Year-over-year growth 2025-2030 (%)
Data Table on Horticulture - Year-over-year growth 2025-2030 (%)

9.7 Others - Market size and forecast 2025-2030

Chart on Others - Market size and forecast 2025-2030 ($ million)
Data Table on Others - Market size and forecast 2025-2030 ($ million)
Chart on Others - Year-over-year growth 2025-2030 (%)
Data Table on Others - Year-over-year growth 2025-2030 (%)

9.8 Market opportunity by Application

Market opportunity by Application ($ million)
Data Table on Market opportunity by Application ($ million)

10. Market Segmentation by Distribution Channel

10.1 Market segments

Chart on Distribution Channel - Market share 2025-2030 (%)
Data Table on Distribution Channel - Market share 2025-2030 (%)

10.2 Comparison by Distribution Channel

Chart on Comparison by Distribution Channel
Data Table on Comparison by Distribution Channel

10.3 Retail - Market size and forecast 2025-2030

Chart on Retail - Market size and forecast 2025-2030 ($ million)
Data Table on Retail - Market size and forecast 2025-2030 ($ million)
Chart on Retail - Year-over-year growth 2025-2030 (%)
Data Table on Retail - Year-over-year growth 2025-2030 (%)

10.4 E-commerce - Market size and forecast 2025-2030

Chart on E-commerce - Market size and forecast 2025-2030 ($ million)
Data Table on E-commerce - Market size and forecast 2025-2030 ($ million)
Chart on E-commerce - Year-over-year growth 2025-2030 (%)
Data Table on E-commerce - Year-over-year growth 2025-2030 (%)

10.5 Direct sales - Market size and forecast 2025-2030

Chart on Direct sales - Market size and forecast 2025-2030 ($ million)
Data Table on Direct sales - Market size and forecast 2025-2030 ($ million)
Chart on Direct sales - Year-over-year growth 2025-2030 (%)
Data Table on Direct sales - Year-over-year growth 2025-2030 (%)

10.6 Market opportunity by Distribution Channel

Market opportunity by Distribution Channel ($ million)
Data Table on Market opportunity by Distribution Channel ($ million)

11. Customer Landscape

11.1 Customer landscape overview

Analysis of price sensitivity, lifecycle, customer purchase basket, adoption rates, and purchase criteria

12. Geographic Landscape

12.1 Geographic segmentation

Chart on Market share by geography 2025-2030 (%)
Data Table on Market share by geography 2025-2030 (%)

12.2 Geographic comparison

Chart on Geographic comparison
Data Table on Geographic comparison

12.3 Europe - Market size and forecast 2025-2030

Chart on Europe - Market size and forecast 2025-2030 ($ million)
Data Table on Europe - Market size and forecast 2025-2030 ($ million)
Chart on Europe - Year-over-year growth 2025-2030 (%)
Data Table on Europe - Year-over-year growth 2025-2030 (%)
Chart on Regional Comparison - Europe
Data Table on Regional Comparison - Europe

12.3.1 Germany - Market size and forecast 2025-2030

Chart on Germany - Market size and forecast 2025-2030 ($ million)
Data Table on Germany - Market size and forecast 2025-2030 ($ million)
Chart on Germany - Year-over-year growth 2025-2030 (%)
Data Table on Germany - Year-over-year growth 2025-2030 (%)

12.3.2 UK - Market size and forecast 2025-2030

Chart on UK - Market size and forecast 2025-2030 ($ million)
Data Table on UK - Market size and forecast 2025-2030 ($ million)
Chart on UK - Year-over-year growth 2025-2030 (%)
Data Table on UK - Year-over-year growth 2025-2030 (%)

12.3.3 France - Market size and forecast 2025-2030

Chart on France - Market size and forecast 2025-2030 ($ million)
Data Table on France - Market size and forecast 2025-2030 ($ million)
Chart on France - Year-over-year growth 2025-2030 (%)
Data Table on France - Year-over-year growth 2025-2030 (%)

12.3.4 Italy - Market size and forecast 2025-2030

Chart on Italy - Market size and forecast 2025-2030 ($ million)
Data Table on Italy - Market size and forecast 2025-2030 ($ million)
Chart on Italy - Year-over-year growth 2025-2030 (%)
Data Table on Italy - Year-over-year growth 2025-2030 (%)

12.3.5 Spain - Market size and forecast 2025-2030

Chart on Spain - Market size and forecast 2025-2030 ($ million)
Data Table on Spain - Market size and forecast 2025-2030 ($ million)
Chart on Spain - Year-over-year growth 2025-2030 (%)
Data Table on Spain - Year-over-year growth 2025-2030 (%)

12.3.6 The Netherlands - Market size and forecast 2025-2030

Chart on The Netherlands - Market size and forecast 2025-2030 ($ million)
Data Table on The Netherlands - Market size and forecast 2025-2030 ($ million)
Chart on The Netherlands - Year-over-year growth 2025-2030 (%)
Data Table on The Netherlands - Year-over-year growth 2025-2030 (%)

12.4 APAC - Market size and forecast 2025-2030

Chart on APAC - Market size and forecast 2025-2030 ($ million)
Data Table on APAC - Market size and forecast 2025-2030 ($ million)
Chart on APAC - Year-over-year growth 2025-2030 (%)
Data Table on APAC - Year-over-year growth 2025-2030 (%)
Chart on Regional Comparison - APAC
Data Table on Regional Comparison - APAC

12.4.1 China - Market size and forecast 2025-2030

Chart on China - Market size and forecast 2025-2030 ($ million)
Data Table on China - Market size and forecast 2025-2030 ($ million)
Chart on China - Year-over-year growth 2025-2030 (%)
Data Table on China - Year-over-year growth 2025-2030 (%)

12.4.2 Japan - Market size and forecast 2025-2030

Chart on Japan - Market size and forecast 2025-2030 ($ million)
Data Table on Japan - Market size and forecast 2025-2030 ($ million)
Chart on Japan - Year-over-year growth 2025-2030 (%)
Data Table on Japan - Year-over-year growth 2025-2030 (%)

12.4.3 India - Market size and forecast 2025-2030

Chart on India - Market size and forecast 2025-2030 ($ million)
Data Table on India - Market size and forecast 2025-2030 ($ million)
Chart on India - Year-over-year growth 2025-2030 (%)
Data Table on India - Year-over-year growth 2025-2030 (%)

12.4.4 South Korea - Market size and forecast 2025-2030

Chart on South Korea - Market size and forecast 2025-2030 ($ million)
Data Table on South Korea - Market size and forecast 2025-2030 ($ million)
Chart on South Korea - Year-over-year growth 2025-2030 (%)
Data Table on South Korea - Year-over-year growth 2025-2030 (%)

12.4.5 Australia - Market size and forecast 2025-2030

Chart on Australia - Market size and forecast 2025-2030 ($ million)
Data Table on Australia - Market size and forecast 2025-2030 ($ million)
Chart on Australia - Year-over-year growth 2025-2030 (%)
Data Table on Australia - Year-over-year growth 2025-2030 (%)

12.4.6 Indonesia - Market size and forecast 2025-2030

Chart on Indonesia - Market size and forecast 2025-2030 ($ million)
Data Table on Indonesia - Market size and forecast 2025-2030 ($ million)
Chart on Indonesia - Year-over-year growth 2025-2030 (%)
Data Table on Indonesia - Year-over-year growth 2025-2030 (%)

12.5 North America - Market size and forecast 2025-2030

Chart on North America - Market size and forecast 2025-2030 ($ million)
Data Table on North America - Market size and forecast 2025-2030 ($ million)
Chart on North America - Year-over-year growth 2025-2030 (%)
Data Table on North America - Year-over-year growth 2025-2030 (%)
Chart on Regional Comparison - North America
Data Table on Regional Comparison - North America

12.5.1 US - Market size and forecast 2025-2030

Chart on US - Market size and forecast 2025-2030 ($ million)
Data Table on US - Market size and forecast 2025-2030 ($ million)
Chart on US - Year-over-year growth 2025-2030 (%)
Data Table on US - Year-over-year growth 2025-2030 (%)

12.5.2 Canada - Market size and forecast 2025-2030

Chart on Canada - Market size and forecast 2025-2030 ($ million)
Data Table on Canada - Market size and forecast 2025-2030 ($ million)
Chart on Canada - Year-over-year growth 2025-2030 (%)
Data Table on Canada - Year-over-year growth 2025-2030 (%)

12.5.3 Mexico - Market size and forecast 2025-2030

Chart on Mexico - Market size and forecast 2025-2030 ($ million)
Data Table on Mexico - Market size and forecast 2025-2030 ($ million)
Chart on Mexico - Year-over-year growth 2025-2030 (%)
Data Table on Mexico - Year-over-year growth 2025-2030 (%)

12.6 Middle East and Africa - Market size and forecast 2025-2030

Chart on Middle East and Africa - Market size and forecast 2025-2030 ($ million)
Data Table on Middle East and Africa - Market size and forecast 2025-2030 ($ million)
Chart on Middle East and Africa - Year-over-year growth 2025-2030 (%)
Data Table on Middle East and Africa - Year-over-year growth 2025-2030 (%)
Chart on Regional Comparison - Middle East and Africa
Data Table on Regional Comparison - Middle East and Africa

12.6.1 Saudi Arabia - Market size and forecast 2025-2030

Chart on Saudi Arabia - Market size and forecast 2025-2030 ($ million)
Data Table on Saudi Arabia - Market size and forecast 2025-2030 ($ million)
Chart on Saudi Arabia - Year-over-year growth 2025-2030 (%)
Data Table on Saudi Arabia - Year-over-year growth 2025-2030 (%)

12.6.2 UAE - Market size and forecast 2025-2030

Chart on UAE - Market size and forecast 2025-2030 ($ million)
Data Table on UAE - Market size and forecast 2025-2030 ($ million)
Chart on UAE - Year-over-year growth 2025-2030 (%)
Data Table on UAE - Year-over-year growth 2025-2030 (%)

12.6.3 South Africa - Market size and forecast 2025-2030

Chart on South Africa - Market size and forecast 2025-2030 ($ million)
Data Table on South Africa - Market size and forecast 2025-2030 ($ million)
Chart on South Africa - Year-over-year growth 2025-2030 (%)
Data Table on South Africa - Year-over-year growth 2025-2030 (%)

12.6.4 Israel - Market size and forecast 2025-2030

Chart on Israel - Market size and forecast 2025-2030 ($ million)
Data Table on Israel - Market size and forecast 2025-2030 ($ million)
Chart on Israel - Year-over-year growth 2025-2030 (%)
Data Table on Israel - Year-over-year growth 2025-2030 (%)

12.6.5 Turkey - Market size and forecast 2025-2030

Chart on Turkey - Market size and forecast 2025-2030 ($ million)
Data Table on Turkey - Market size and forecast 2025-2030 ($ million)
Chart on Turkey - Year-over-year growth 2025-2030 (%)
Data Table on Turkey - Year-over-year growth 2025-2030 (%)

12.7 South America - Market size and forecast 2025-2030

Chart on South America - Market size and forecast 2025-2030 ($ million)
Data Table on South America - Market size and forecast 2025-2030 ($ million)
Chart on South America - Year-over-year growth 2025-2030 (%)
Data Table on South America - Year-over-year growth 2025-2030 (%)
Chart on Regional Comparison - South America
Data Table on Regional Comparison - South America

12.7.1 Brazil - Market size and forecast 2025-2030

Chart on Brazil - Market size and forecast 2025-2030 ($ million)
Data Table on Brazil - Market size and forecast 2025-2030 ($ million)
Chart on Brazil - Year-over-year growth 2025-2030 (%)
Data Table on Brazil - Year-over-year growth 2025-2030 (%)

12.7.2 Argentina - Market size and forecast 2025-2030

Chart on Argentina - Market size and forecast 2025-2030 ($ million)
Data Table on Argentina - Market size and forecast 2025-2030 ($ million)
Chart on Argentina - Year-over-year growth 2025-2030 (%)
Data Table on Argentina - Year-over-year growth 2025-2030 (%)

12.7.3 Chile - Market size and forecast 2025-2030

Chart on Chile - Market size and forecast 2025-2030 ($ million)
Data Table on Chile - Market size and forecast 2025-2030 ($ million)
Chart on Chile - Year-over-year growth 2025-2030 (%)
Data Table on Chile - Year-over-year growth 2025-2030 (%)

12.8 Market opportunity by geography

Market opportunity by geography ($ million)
Data Tables on Market opportunity by geography ($ million)

13. Drivers, Challenges, and Opportunity

13.1 Market drivers

Rising integration of plasma technology in controlled environment agriculture
Advancements in high-intensity industrial and infrastructure lighting requirements
Expanding utility of plasma-generated radiation in scientific and medical sterilization

13.2 Market challenges

Dominance of solid-state lighting and cost disparity
High capital expenditure and technical maintenance requirements required for deploying plasma lighting systems
Electromagnetic compatibility and regulatory compliance burdens

13.3 Impact of drivers and challenges

Impact of drivers and challenges in 2025 and 2030

13.4 Market opportunities

Growing adoption of plasma lighting in commercial horticulture and vertical farming
Integration of high-intensity plasma systems in urban infrastructure modernization
Advancements in specialized UV plasma applications for medical and industrial sterilization

14. Competitive Landscape

14.1 Overview

14.2

Overview on criticality of inputs and factors of differentiation

14.3 Landscape disruption

Overview on factors of disruption

14.4 Industry risks

Impact of key risks on business

15. Competitive Analysis

15.1 Companies profiled

Companies covered

15.2 Company ranking index

15.3 Market positioning of companies

Matrix on companies position and classification

15.4 Ceravision Ltd.

Ceravision Ltd. - Overview
Ceravision Ltd. - Product / Service
Ceravision Ltd. - Key offerings
SWOT

15.5 Endura LED

Endura LED - Overview
Endura LED - Product / Service
Endura LED - Key offerings
SWOT

15.6 Excelitas Technologies Corp.

Excelitas Technologies Corp. - Overview
Excelitas Technologies Corp. - Product / Service
Excelitas Technologies Corp. - Key offerings
SWOT

15.7 Foshan Electrical and Lighting

Foshan Electrical and Lighting - Overview
Foshan Electrical and Lighting - Product / Service
Foshan Electrical and Lighting - Key offerings
SWOT

15.8 Griffin and Ray Inc.

Griffin and Ray Inc. - Overview
Griffin and Ray Inc. - Product / Service
Griffin and Ray Inc. - Key offerings
SWOT

15.9 Hamamatsu Photonics KK

Hamamatsu Photonics KK - Overview
Hamamatsu Photonics KK - Business segments
Hamamatsu Photonics KK - Key offerings
Hamamatsu Photonics KK - Segment focus
SWOT

15.10 Heraeus Holding GmbH

Heraeus Holding GmbH - Overview
Heraeus Holding GmbH - Product / Service
Heraeus Holding GmbH - Key offerings
SWOT

15.11 Hive Lighting Inc.

Hive Lighting Inc. - Overview
Hive Lighting Inc. - Product / Service
Hive Lighting Inc. - Key offerings
SWOT

15.12 Ka Shui International Holdings

Ka Shui International Holdings - Overview
Ka Shui International Holdings - Product / Service
Ka Shui International Holdings - Key offerings
SWOT

15.13 Luxim Corp

Luxim Corp - Overview
Luxim Corp - Product / Service
Luxim Corp - Key offerings
SWOT

15.14 Opple Lighting Co. Ltd.

Opple Lighting Co. Ltd. - Overview
Opple Lighting Co. Ltd. - Product / Service
Opple Lighting Co. Ltd. - Key offerings
SWOT

15.15 Panasonic Holdings Corp.

Panasonic Holdings Corp. - Overview
Panasonic Holdings Corp. - Business segments
Panasonic Holdings Corp. - Key news
Panasonic Holdings Corp. - Key offerings
Panasonic Holdings Corp. - Segment focus
SWOT

15.16 Plasma International

Plasma International - Overview
Plasma International - Product / Service
Plasma International - Key offerings
SWOT

15.17 PLS GmbH

PLS GmbH - Overview
PLS GmbH - Product / Service
PLS GmbH - Key offerings
SWOT

15.18 Sunle Lighting Co Ltd

Sunle Lighting Co Ltd - Overview
Sunle Lighting Co Ltd - Product / Service
Sunle Lighting Co Ltd - Key offerings
SWOT

16. Appendix

16.1 Scope of the report

Market definition
Objectives
Notes and caveats

16.2 Inclusions and exclusions checklist

Inclusions checklist
Exclusions checklist

16.3 Currency conversion rates for US$

16.4 Research methodology

16.5 Data procurement

Information sources

16.6 Data validation

16.7 Validation techniques employed for market sizing

16.8 Data synthesis

16.9 360 degree market analysis

16.10 List of abbreviations

Research Methodology

Technavio presents a detailed picture of the market by way of study, synthesis, and summation of data from multiple sources. The analysts have presented the various facets of the market with a particular focus on identifying the key industry influencers. The data thus presented is comprehensive, reliable, and the result of extensive research, both primary and secondary.

INFORMATION SOURCES

Primary sources

  • Manufacturers and suppliers
  • Channel partners
  • Industry experts
  • Strategic decision makers

Secondary sources

  • Industry journals and periodicals
  • Government data
  • Financial reports of key industry players
  • Historical data
  • Press releases

DATA ANALYSIS

Data Synthesis

  • Collation of data
  • Estimation of key figures
  • Analysis of derived insights

Data Validation

  • Triangulation with data models
  • Reference against proprietary databases
  • Corroboration with industry experts

REPORT WRITING

Qualitative

  • Market drivers
  • Market challenges
  • Market trends
  • Five forces analysis

Quantitative

  • Market size and forecast
  • Market segmentation
  • Geographical insights
  • Competitive landscape

Interested in this report?

Get your sample now to see our research methodology and insights!

Download Now

Frequently Asked Questions

Plasma Lamp market growth will increase by USD 170.1 million during 2026-2030.

The Plasma Lamp market is expected to grow at a CAGR of 4.7% during 2026-2030.

Plasma Lamp market is segmented by Type (300 Watt, Above 300 Watt) Application (Industrial, Roadways and tunnels, Sports and entertainment, Horticulture, Others) Distribution channel (Retail, E-commerce, Direct sales)

Ceravision Ltd., Endura LED, Excelitas Technologies Corp., Foshan Electrical and Lighting, Griffin and Ray Inc., Hamamatsu Photonics KK, Heraeus Holding GmbH, Hive Lighting Inc., Ka Shui International Holdings, LG Electronics Inc., Lumileds Holding BV, Luxim Corp, Opple Lighting Co. Ltd., Panasonic Holdings Corp., Plasma International, PLS GmbH, Seoul Semiconductor Co. Ltd., Signify NV, Sunle Lighting Co Ltd, Ushio Inc. are a few of the key vendors in the Plasma Lamp market.

Europe will register the highest growth rate of 34.6% among the other regions. Therefore, the Plasma Lamp market in Europe is expected to garner significant business opportunities for the vendors during the forecast period.

Germany, UK, France, Italy, Spain, The Netherlands, China, Japan, India, South Korea, Australia, Indonesia, US, Canada, Mexico, Saudi Arabia, UAE, South Africa, Israel, Turkey, Brazil, Argentina, Chile

  • Rising integration of plasma technology in controlled environment agriculture is the driving factor this market.

The Plasma Lamp market vendors should focus on grabbing business opportunities from the Type segment as it accounted for the largest market share in the base year.
RIA - Research AI Assistant
Ask RIA