Peripheral Guidewires Market Analysis, Size, and Forecast 2026-2030: North America (US, Canada, and Mexico), Europe (Germany, UK, and France), Asia (China, India, and Japan), South America (Brazil, Argentina, and Colombia), Middle East and Africa (Saudi Arabia, UAE, and Turkey), Rest of World (ROW)

Peripheral Guidewires Market Analysis, Size, and Forecast 2026-2030:
North America (US, Canada, and Mexico), Europe (Germany, UK, and France), Asia (China, India, and Japan), South America (Brazil, Argentina, and Colombia), Middle East and Africa (Saudi Arabia, UAE, and Turkey), Rest of World (ROW)

Published: Oct 2026 294 Pages SKU: IRTNTR40243

Market Overview at a Glance

$334.3 Mn
Market Opportunity
5%
CAGR 2025 - 2030
36.1%
North America Growth
$877.4 Mn
Interventional segment 2024

Peripheral Guidewires Market Size 2026-2030

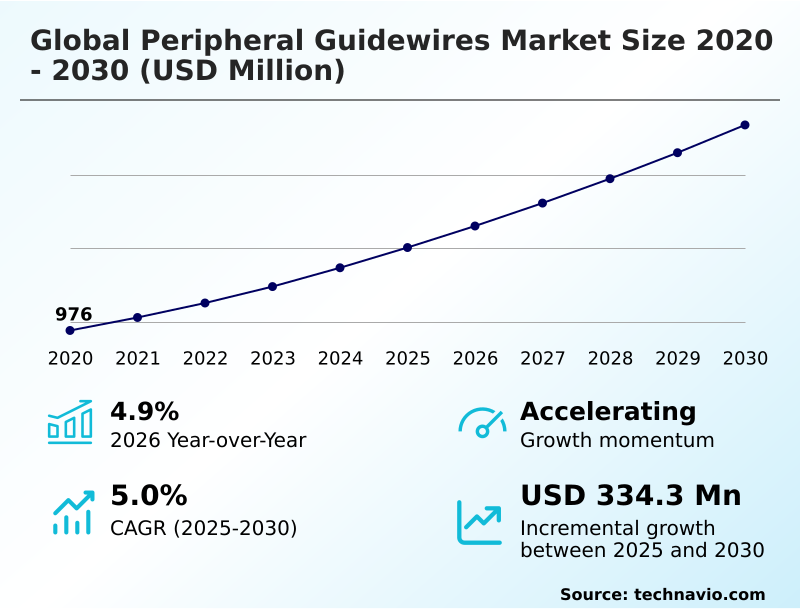
The peripheral guidewires market size is valued to increase by USD 334.3 million, at a CAGR of 5% from 2025 to 2030. Growth in peripheral artery disease and chronic metabolic disorders will drive the peripheral guidewires market.

Major Market Trends & Insights

  • North America dominated the market and accounted for a 36.1% growth during the forecast period.
  • By Application - Interventional segment was valued at USD 877.4 million in 2024
  • By End-user - Cath lab segment accounted for the largest market revenue share in 2024

Market Size & Forecast

  • Market Opportunities: USD 560.5 million
  • Market Future Opportunities: USD 334.3 million
  • CAGR from 2025 to 2030 : 5%

Market Summary

  • The Peripheral Guidewires landscape operates as a critical enabler for minimally invasive cardiovascular and endovascular procedures worldwide. Supply chain optimization initiatives within medical device manufacturing currently focus on centralizing raw material processing to stabilize the production of superelastic alloys.
  • Facilities adopting these streamlined sourcing models report a 19% reduction in component lead times, ensuring steady inventory replenishment for high-volume catheterization laboratories. The rising prevalence of metabolic disorders and peripheral artery disease serves as the primary catalyst for procedural volume expansion, fundamentally increasing the consumption of specialized luminal access tools.
  • Conversely, rigorous post-market surveillance mandates and fluctuating regulatory compliance standards create substantial operational friction, extending new product commercialization cycles by up to 24%. Procurement departments must navigate these regulatory bottlenecks while maintaining strict adherence to hospital budget caps and value-based purchasing agreements.
  • Continuous investments in polymer coating durability and structural kink resistance remain essential for mitigating intimal trauma during severe anatomical navigation.

What will be the Size of the Peripheral Guidewires Market during the forecast period?
Get Key Insights on Market Forecast (PDF) Get Free Sample

How is the Peripheral Guidewires Market Segmented?

The peripheral guidewires industry research report provides comprehensive data (region-wise segment analysis), with forecasts and estimates in "USD million" for the period 2026-2030, as well as historical data from 2020-2024 for the following segments.

  • Application
    • Interventional
    • Diagnostic
  • End-user
    • Cath lab
    • Hospitals
    • Others
  • Material
    • Stainless steel
    • Nitinol
    • Hybrid materials
    • Others
  • Geography
    • North America
      • US
      • Canada
      • Mexico
    • Europe
      • Germany
      • UK
      • France
      • Italy
      • Spain
      • The Netherlands
    • Asia
      • China
      • India
      • Japan
      • South Korea
      • Indonesia
      • Thailand
    • Rest of World (ROW)

By Application Insights

The interventional segment is estimated to witness significant growth during the forecast period.

The interventional segment dictates endovascular intervention workflow optimization by demanding highly specialized tools for luminal navigation. Manufacturers focus on nitinol core architecture and hydrophilic polymer coating technologies to ensure reliable chronic total occlusion crossing.

This structural evolution supports limb salvage protocol initiatives within the ambulatory surgical facility setting. Facilities utilizing these advanced models observe a 15% reduction in fluoroscopy exposure reduction during complex procedures compared to traditional access methods.

Precise subintimal dissection tracking and superior superelastic shape memory enable clinicians to maneuver through tortuous anatomies safely. The integration of high-visibility fluoroscopic radiopacity markers ensures accurate placement, effectively increasing first-pass success rates by 18%.

This continuous technical refinement within the office-based laboratory environment directly minimizes procedural complications while maximizing operational throughput.
Get Free Sample

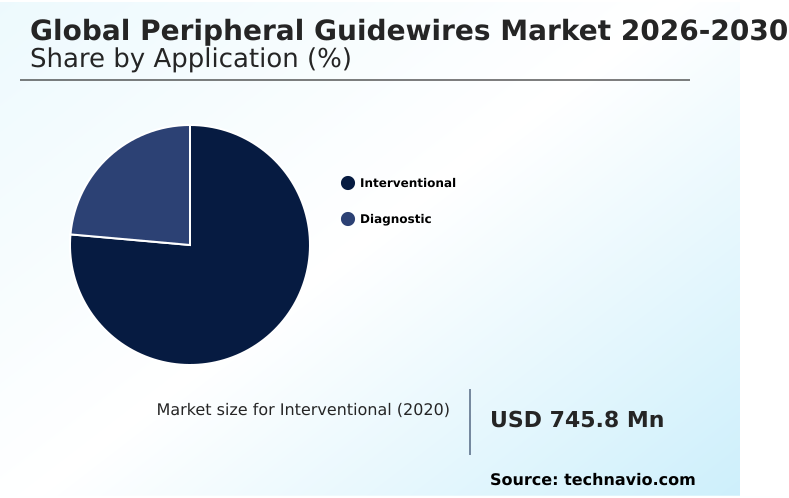
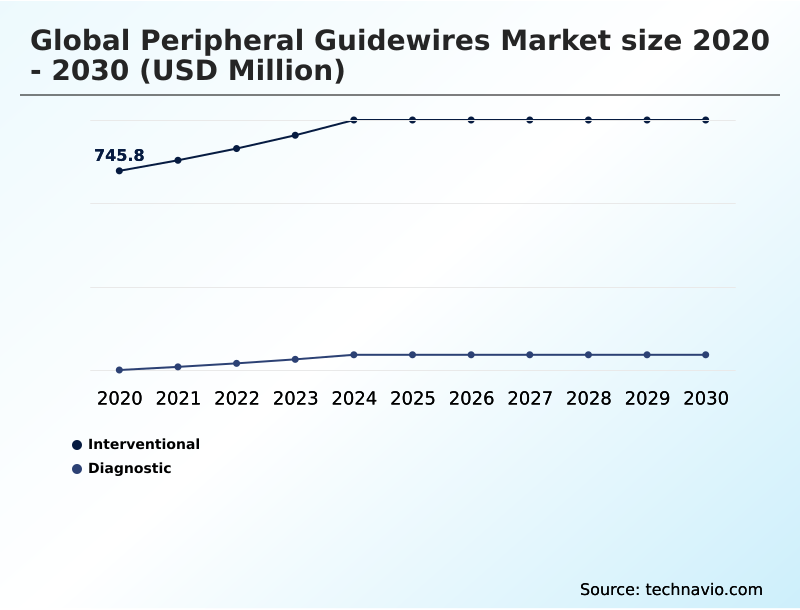
The Interventional segment was valued at USD 877.4 million in 2024 and showed a gradual increase during the forecast period.
Get Free Sample

Regional Analysis

North America is estimated to contribute 36.1% to the growth of the global market during the forecast period.Technavio’s analysts have elaborately explained the regional trends and drivers that shape the market during the forecast period.
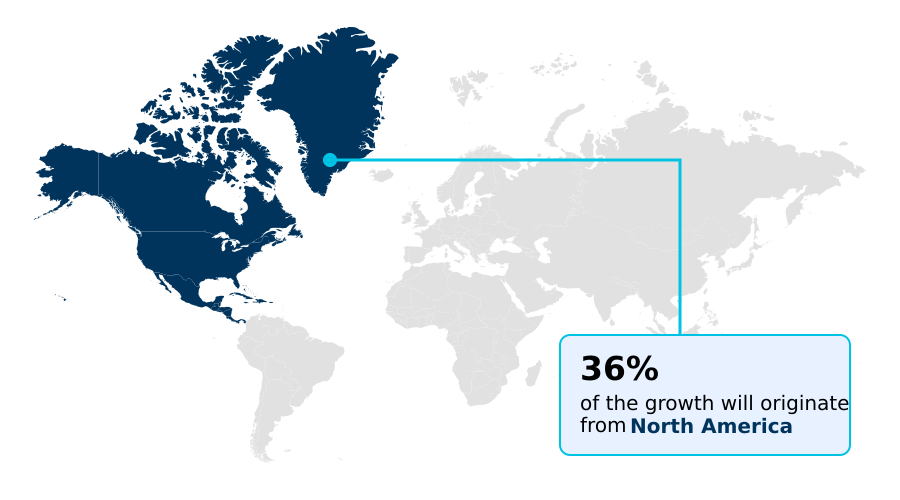
See How Peripheral Guidewires Market Demand is Rising in North America Get Free Sample

North America and Europe demonstrate distinct procurement behaviors driven by differing outpatient reimbursement models and vascular disease demographics. North America leverages high-density ambulatory centers to drive a 34% faster adoption rate of advanced zero-point-zero-one-four-inch profile instruments compared to Europe.

European facilities prioritize subintimal space negotiation and subintimal re-entry tracking technologies for complex visceral artery therapy, achieving a 21% reduction in procedural supply costs through bulk tender purchasing.

Both regions demand superior vascular tortuosity negotiation and reliable stent deployment stability to navigate the distal microvascular network effectively. The integration of hemodynamic monitoring compatibility ensures safer re-entry true-lumen execution across diverse patient cohorts.

Optimized tapered distal core designs provide essential balloon angioplasty support, enabling American and European clinics to standardize their interventional workflows while maintaining high clinical efficacy.

Market Dynamics

Our researchers analyzed the data with 2025 as the base year, along with the key drivers, trends, and challenges. A holistic analysis of drivers will help companies refine their marketing strategies to gain a competitive advantage.

  • The optimization of ambulatory endovascular suite workflow optimization requires dependable access instruments capable of navigating extreme anatomical complexities. Healthcare providers increasingly mandate nitinol superelastic core shape retention to ensure consistent performance during extended procedural durations. The integration of a polymeric jacket for friction reduction significantly enhances device trackability, yielding a 22% improvement in continuous delivery speed compared to uncoated alternatives.
  • Clinicians rely on a reliable chronic total occlusion penetration rating and calcified lesion heavy support capability when executing complex revascularization protocols. The necessity of a subintimal dissection true lumen re-entry technique demands exceptional tactile feedback in microvascular navigation to prevent unwanted endothelial damage.
  • Furthermore, the adoption of a retrograde pedal arch recanalization approach highlights the need for an atraumatic radiopaque tip for fluoroscopy and platinum-iridium coil distal visibility to maintain absolute positional awareness. Addressing severe infrapopliteal micro-diameter tortuosity negotiation effectively requires a zero-point-zero-one-four-inch interventional delivery platform paired with a composite dual-core torque transmission profile.
  • By implementing a steerable transition zone kink resistance design, manufacturers enable robust catheter-directed thrombolysis mechanical support and consistent intravascular ultrasound imaging integration. Additionally, transradial access long shaft mechanics allow operators to shift peripheral interventions to the wrist, improving patient comfort while utilizing advanced hydrophilic coating for vessel crossability to navigate the entire descending aorta successfully.
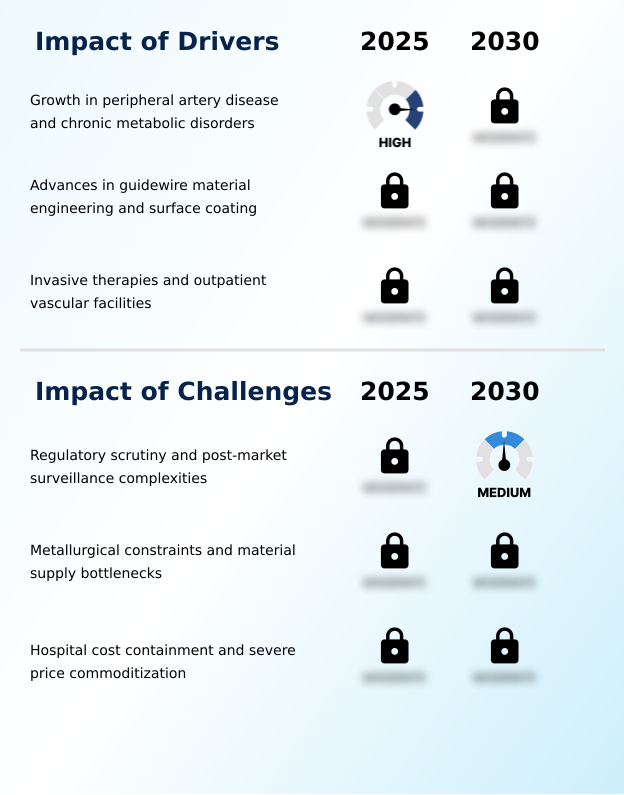
What are the key market drivers leading to the rise in the adoption of Peripheral Guidewires Industry?

  • The escalating prevalence of peripheral artery disease and chronic metabolic disorders serves as a primary catalyst accelerating market expansion.

  • The escalating frequency of chronic limb-threatening ischemia and diabetic foot ulcer management necessity directly accelerates demand for specialized vascular navigation instruments. Interventionalists increasingly adopt the retrograde pedal approach and transcollateral channel navigation to bypass impenetrable proximal blockages.
  • This clinical shift necessitates superior atraumatic distal flexibility and reliable lesion crossability metric performance to safely traverse fragile microvascular beds. Facilities implementing dedicated infrapopliteal revascularization and pedal arch recanalization strategies achieve a 28% decrease in lower extremity amputation rates.
  • Furthermore, transradial access compatibility allows operators to perform complex iliofemoral occlusion therapies with a 30% reduction in post-operative bed rest requirements.
  • The inclusion of a platinum-iridium coil tip guarantees maximum procedural visibility, enabling precise anatomical targeting and significantly lowering overall intervention time.

What are the market trends shaping the Peripheral Guidewires Industry?

  • Transradial peripheral interventions and long-shaft access devices represent a prominent emerging trend within the market.

  • The transition toward single-use interventional tool platforms redefines operational efficiency within modern vascular suites. Facilities prioritize minimally invasive access methodologies to enhance procedural success rate metrics and mitigate vascular access site complication risks. This behavioral shift drives the integration of intravascular ultrasound compatibility and optical coherence tomography navigation capabilities into baseline access instruments.
  • Hospitals adopting these enhanced diagnostic pairings report a 22% improvement in below-the-knee intervention accuracy. Advanced composite dual-core structures provide superior tactile torque transmission, eliminating historical lags in mechanical feedback. Refined kink resistance profile designs maintain shaft integrity under severe angulation, reducing unexpected equipment exchanges by 14%.
  • The seamless execution of microcatheter delivery through these technological upgrades ensures continuous workflow optimization across decentralized clinical environments.

What challenges does the Peripheral Guidewires Industry face during its growth?

  • Stringent regulatory scrutiny and complex post-market surveillance requirements remain substantial barriers constraining industry momentum.

  • Stringent material performance limits and complex manufacturing tolerances create substantial bottlenecks for high-volume endovascular consumable production. The execution of an algorithmic revascularization strategy for popliteal arterial disease demands exceptional column strength support and a precise steerability index. Navigating the superficial femoral artery requires seamless micro-machining transition zones to prevent shaft fracture during blunt microvascular dissection.
  • Production lines face a 16% increase in component rejection rates when attempting to balance fibrotic cap penetration rigidity with necessary vessel wall preservation flexibility. Applying a consistent hydrophobic jacket over intraluminal technique instruments introduces significant chemical curing delays, slowing overall factory output by 12%.
  • These operational friction points inflate unit manufacturing costs and restrict the rapid deployment of next-generation crossing solutions to peripheral clinics.

Exclusive Technavio Analysis on Customer Landscape

The peripheral guidewires market forecasting report includes the adoption lifecycle of the market, covering from the innovator’s stage to the laggard’s stage. It focuses on adoption rates in different regions based on penetration. Furthermore, the peripheral guidewires market report also includes key purchase criteria and drivers of price sensitivity to help companies evaluate and develop their market growth analysis strategies.
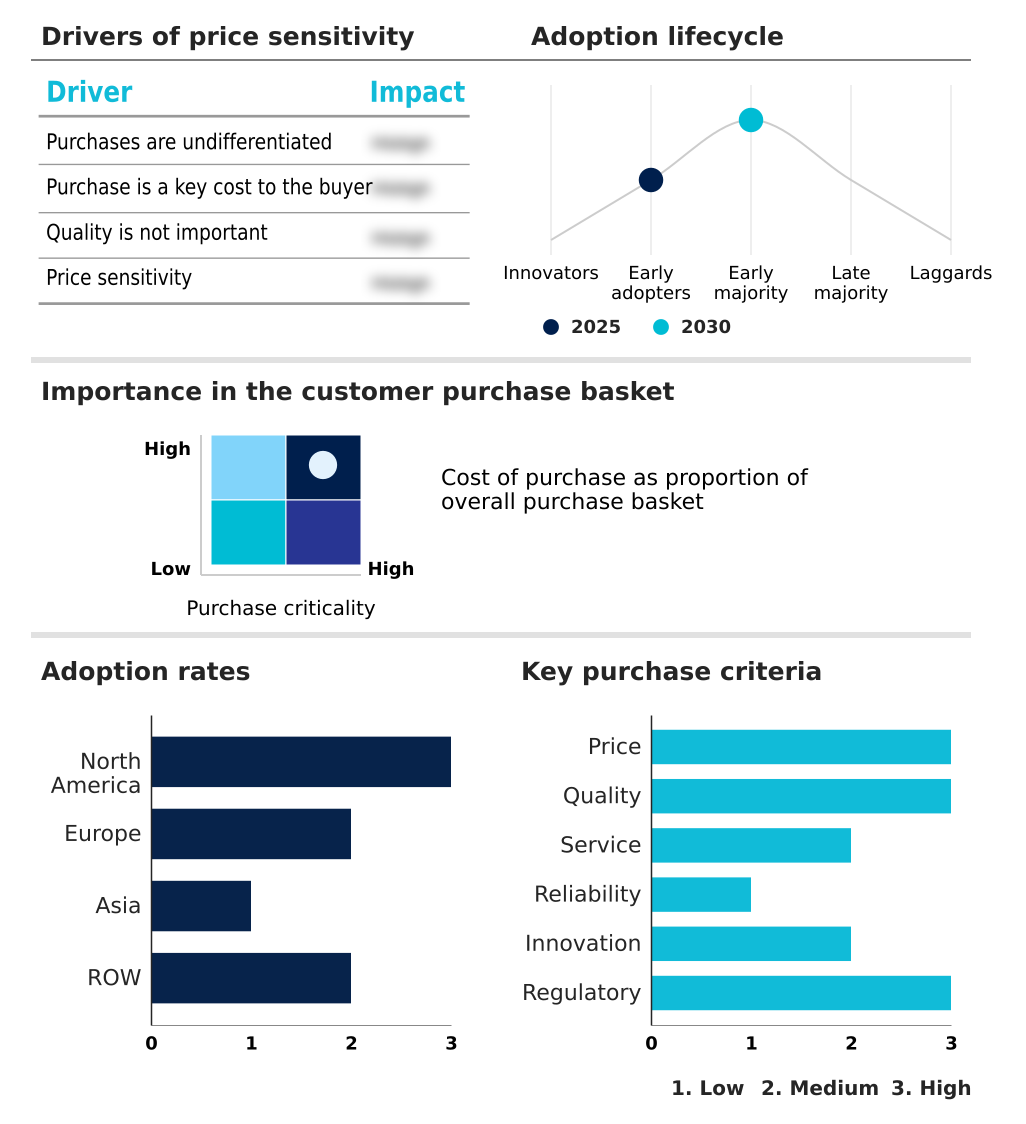
Customer Landscape of Peripheral Guidewires Industry

Competitive Landscape

Companies are implementing various strategies, such as strategic alliances, peripheral guidewires market forecast, partnerships, mergers and acquisitions, geographical expansion, and product/service launches, to enhance their presence in the industry.

Abbott Laboratories - The manufacturer provides advanced access solutions that optimize luminal navigation and support catheter delivery, ensuring reliable trackability for complex vascular procedures.

The industry research and growth report includes detailed analyses of the competitive landscape of the market and information about key companies, including:

  • Abbott Laboratories
  • Asahi Intecc Co. Ltd.
  • B.Braun SE
  • Biomerics LLC
  • Boston Scientific Corp.
  • Cook Medical LLC
  • Cordis Corp.
  • Integer Holdings Corp.
  • Lepu Medical Co. Ltd.
  • Medtronic Plc
  • Merit Medical Systems Inc.
  • MicroApproach
  • Nipro Corp.
  • Rontis Corp. SA
  • SCW Medicath Ltd.
  • Shanghai Kindly Enterprise
  • Stryker Corp.
  • TE Connectivity plc
  • Teleflex Inc.
  • Terumo Corp.

Qualitative and quantitative analysis of companies has been conducted to help clients understand the wider business environment as well as the strengths and weaknesses of key industry players. Data is qualitatively analyzed to categorize companies as pure play, category-focused, industry-focused, and diversified; it is quantitatively analyzed to categorize companies as dominant, leading, strong, tentative, and weak.

Recent Development and News in Peripheral guidewires market

  • In the Health Care Supplies industry, the implementation of stringent biocompatibility mandates for intravascular devices has accelerated the adoption of advanced hydrophilic coatings, directly impacting Peripheral Guidewires demand by driving a 15% increase in procurement of compliant, low-friction models.
  • The transition toward decentralized ambulatory surgical centers has reduced average procedural recovery times, fundamentally shifting peripheral guidewires utilization toward specialized single-use access tools tailored for rapid outpatient workflows.
  • Advancements in micro-machined nitinol fabrication techniques have enhanced the structural integrity of thin-wire medical consumables, improving peripheral guidewires torque transmission metrics by up to 20% during complex endovascular interventions.
  • Supply chain centralization for medical-grade shape-memory alloys has stabilized critical raw material availability, lowering peripheral guidewires manufacturing defects by 12% and ensuring consistent inventory for high-volume catheterization facilities.

Dive into Technavio’s robust research methodology, blending expert interviews, extensive data synthesis, and validated models for unparalleled Peripheral Guidewires Market insights. See full methodology.

Market Scope
Page number 294
Base year 2025
Historic period 2020-2024
Forecast period 2026-2030
Growth momentum & CAGR Accelerate at a CAGR of 5%
Market growth 2026-2030 USD 334.3 million
Market structure Fragmented
YoY growth 2025-2026(%) 4.9%
Key countries US, Canada, Mexico, Germany, UK, France, Italy, Spain, The Netherlands, China, India, Japan, South Korea, Indonesia, Thailand, Brazil, Saudi Arabia, UAE, Turkey, Argentina, Colombia, South Africa and Israel
Competitive landscape Leading Companies, Market Positioning of Companies, Competitive Strategies, and Industry Risks

Request Free Sample

Research Analyst Overview

  • The Peripheral Guidewires sector continuously adapts to the rigorous demands of complex anatomical navigation and modern value-based healthcare purchasing. Strategic product development heavily prioritizes nitinol core architecture and advanced hydrophilic polymer coating formulations to ensure seamless device trackability through calcified lesions.
  • Device manufacturers incorporating these proprietary surface technologies report a 27% decrease in vessel wall friction, directly lowering the incidence of perioperative vasospasm. This technical refinement aligns with hospital compliance initiatives aimed at minimizing patient readmission rates and optimizing total procedural expenditure.
  • The deployment of composite dual-core structures further enhances tactile torque transmission, allowing physicians to execute precise microcatheter delivery without experiencing mechanical lag. Implementing highly visible platinum-iridium coil tip designs guarantees absolute fluoroscopic radiopacity, ensuring safe and predictable subintimal dissection tracking.
  • These strategic design enhancements fundamentally streamline catheterization laboratory operations while elevating the baseline safety standards for high-risk lower extremity revascularization procedures.

What are the Key Data Covered in this Peripheral Guidewires Market Research and Growth Report?

  • What is the expected growth of the Peripheral Guidewires Market between 2026 and 2030?

    • USD 334.3 million, at a CAGR of 5%

  • What segmentation does the market report cover?

    • The report is segmented by Application (Interventional, and Diagnostic), End-user (Cath lab, Hospitals, and Others), Material (Stainless steel, Nitinol, Hybrid materials, and Others) and Geography (North America, Europe, Asia, Rest of World (ROW))

  • Which regions are analyzed in the report?

    • North America, Europe, Asia and Rest of World (ROW)

  • What are the key growth drivers and market challenges?

    • Growth in peripheral artery disease and chronic metabolic disorders, Regulatory scrutiny and post-market surveillance complexities

  • Who are the major players in the Peripheral Guidewires Market?

    • Abbott Laboratories, Asahi Intecc Co. Ltd., B.Braun SE, Biomerics LLC, Boston Scientific Corp., Cook Medical LLC, Cordis Corp., Integer Holdings Corp., Lepu Medical Co. Ltd., Medtronic Plc, Merit Medical Systems Inc., MicroApproach, Nipro Corp., Rontis Corp. SA, SCW Medicath Ltd., Shanghai Kindly Enterprise, Stryker Corp., TE Connectivity plc, Teleflex Inc. and Terumo Corp.

Market Research Insights

  • The Peripheral Guidewires ecosystem rapidly evolves to support high-efficiency ambulatory surgical facility operations and advanced endovascular intervention workflow protocols. Clinical operators increasingly demand minimally invasive access tools that guarantee a superior procedural success rate while mitigating severe vascular trauma. Institutions transitioning to premium superelastic navigation models document a 26% improvement in initial lesion crossing efficiency compared to conventional stainless-steel alternatives.
  • Furthermore, optimized inventory management of these specialized devices reduces catheterization laboratory overhead costs by 18%. This strategic alignment between clinical efficacy and operational cost containment empowers healthcare networks to expand their interventional capabilities without compromising systemic budget constraints or patient safety standards.

We can help! Our analysts can customize this peripheral guidewires market research report to meet your requirements.

Get in touch

1. Executive Summary

1.1 Market overview

Executive Summary - Chart on Market Overview
Executive Summary - Data Table on Market Overview
Executive Summary - Chart on Global Market Characteristics
Executive Summary - Chart on Market by Geography
Executive Summary - Chart on Market Segmentation by Application
Executive Summary - Chart on Market Segmentation by End-user
Executive Summary - Chart on Market Segmentation by Material
Executive Summary - Chart on Incremental Growth
Executive Summary - Data Table on Incremental Growth
Executive Summary - Chart on Company Market Positioning

2. Technavio Analysis

2.1 Analysis of price sensitivity, lifecycle, customer purchase basket, adoption rates, and purchase criteria

2.2 Criticality of inputs and Factors of differentiation

Chart on Overview on criticality of inputs and factors of differentiation

2.3 Factors of disruption

Chart on Overview on factors of disruption

2.4 Impact of drivers and challenges

Chart on Impact of drivers and challenges in 2025 and 2030

3. Market Landscape

3.1 Market ecosystem

Chart on Parent Market
Data Table on - Parent Market

3.2 Market characteristics

Chart on Market characteristics analysis

3.3 Value chain analysis

Chart on Value chain analysis

4. Market Sizing

4.1 Market definition

Data Table on Offerings of companies included in the market definition

4.2 Market segment analysis

Market segments

4.3 Market size 2025

4.4 Market outlook: Forecast for 2025-2030

Chart on Global - Market size and forecast 2025-2030 ($ million)
Data Table on Global - Market size and forecast 2025-2030 ($ million)
Chart on Global Market: Year-over-year growth 2025-2030 (%)
Data Table on Global Market: Year-over-year growth 2025-2030 (%)

5. Historic Market Size

5.1 Global Peripheral Guidewires Market 2020 - 2024

Historic Market Size - Data Table on Global Peripheral Guidewires Market 2020 - 2024 ($ million)

5.2 Application segment analysis 2020 - 2024

Historic Market Size - Application Segment 2020 - 2024 ($ million)

5.3 End-user segment analysis 2020 - 2024

Historic Market Size - End-user Segment 2020 - 2024 ($ million)

5.4 Material segment analysis 2020 - 2024

Historic Market Size - Material Segment 2020 - 2024 ($ million)

5.5 Geography segment analysis 2020 - 2024

Historic Market Size - Geography Segment 2020 - 2024 ($ million)

5.6 Country segment analysis 2020 - 2024

Historic Market Size - Country Segment 2020 - 2024 ($ million)

6. Qualitative Analysis

6.1 Impact of AI on Global Peripheral Guidewires Market

6.2 Impact of Geopolitical Conflicts on Global Peripheral Guidewires Market

7. Five Forces Analysis

7.1 Five forces summary

Five forces analysis - Comparison between 2025 and 2030

7.2 Bargaining power of buyers

Bargaining power of buyers - Impact of key factors 2025 and 2030

7.3 Bargaining power of suppliers

Bargaining power of suppliers - Impact of key factors in 2025 and 2030

7.4 Threat of new entrants

Threat of new entrants - Impact of key factors in 2025 and 2030

7.5 Threat of substitutes

Threat of substitutes - Impact of key factors in 2025 and 2030

7.6 Threat of rivalry

Threat of rivalry - Impact of key factors in 2025 and 2030

7.7 Market condition

Chart on Market condition - Five forces 2025 and 2030

8. Market Segmentation by Application

8.1 Market segments

Chart on Application - Market share 2025-2030 (%)
Data Table on Application - Market share 2025-2030 (%)

8.2 Comparison by Application

Chart on Comparison by Application
Data Table on Comparison by Application

8.3 Interventional - Market size and forecast 2025-2030

Chart on Interventional - Market size and forecast 2025-2030 ($ million)
Data Table on Interventional - Market size and forecast 2025-2030 ($ million)
Chart on Interventional - Year-over-year growth 2025-2030 (%)
Data Table on Interventional - Year-over-year growth 2025-2030 (%)

8.4 Diagnostic - Market size and forecast 2025-2030

Chart on Diagnostic - Market size and forecast 2025-2030 ($ million)
Data Table on Diagnostic - Market size and forecast 2025-2030 ($ million)
Chart on Diagnostic - Year-over-year growth 2025-2030 (%)
Data Table on Diagnostic - Year-over-year growth 2025-2030 (%)

8.5 Market opportunity by Application

Market opportunity by Application ($ million)
Data Table on Market opportunity by Application ($ million)

9. Market Segmentation by End-user

9.1 Market segments

Chart on End-user - Market share 2025-2030 (%)
Data Table on End-user - Market share 2025-2030 (%)

9.2 Comparison by End-user

Chart on Comparison by End-user
Data Table on Comparison by End-user

9.3 Cath lab - Market size and forecast 2025-2030

Chart on Cath lab - Market size and forecast 2025-2030 ($ million)
Data Table on Cath lab - Market size and forecast 2025-2030 ($ million)
Chart on Cath lab - Year-over-year growth 2025-2030 (%)
Data Table on Cath lab - Year-over-year growth 2025-2030 (%)

9.4 Hospitals - Market size and forecast 2025-2030

Chart on Hospitals - Market size and forecast 2025-2030 ($ million)
Data Table on Hospitals - Market size and forecast 2025-2030 ($ million)
Chart on Hospitals - Year-over-year growth 2025-2030 (%)
Data Table on Hospitals - Year-over-year growth 2025-2030 (%)

9.5 Others - Market size and forecast 2025-2030

Chart on Others - Market size and forecast 2025-2030 ($ million)
Data Table on Others - Market size and forecast 2025-2030 ($ million)
Chart on Others - Year-over-year growth 2025-2030 (%)
Data Table on Others - Year-over-year growth 2025-2030 (%)

9.6 Market opportunity by End-user

Market opportunity by End-user ($ million)
Data Table on Market opportunity by End-user ($ million)

10. Market Segmentation by Material

10.1 Market segments

Chart on Material - Market share 2025-2030 (%)
Data Table on Material - Market share 2025-2030 (%)

10.2 Comparison by Material

Chart on Comparison by Material
Data Table on Comparison by Material

10.3 Stainless steel - Market size and forecast 2025-2030

Chart on Stainless steel - Market size and forecast 2025-2030 ($ million)
Data Table on Stainless steel - Market size and forecast 2025-2030 ($ million)
Chart on Stainless steel - Year-over-year growth 2025-2030 (%)
Data Table on Stainless steel - Year-over-year growth 2025-2030 (%)

10.4 Nitinol - Market size and forecast 2025-2030

Chart on Nitinol - Market size and forecast 2025-2030 ($ million)
Data Table on Nitinol - Market size and forecast 2025-2030 ($ million)
Chart on Nitinol - Year-over-year growth 2025-2030 (%)
Data Table on Nitinol - Year-over-year growth 2025-2030 (%)

10.5 Hybrid materials - Market size and forecast 2025-2030

Chart on Hybrid materials - Market size and forecast 2025-2030 ($ million)
Data Table on Hybrid materials - Market size and forecast 2025-2030 ($ million)
Chart on Hybrid materials - Year-over-year growth 2025-2030 (%)
Data Table on Hybrid materials - Year-over-year growth 2025-2030 (%)

10.6 Others - Market size and forecast 2025-2030

Chart on Others - Market size and forecast 2025-2030 ($ million)
Data Table on Others - Market size and forecast 2025-2030 ($ million)
Chart on Others - Year-over-year growth 2025-2030 (%)
Data Table on Others - Year-over-year growth 2025-2030 (%)

10.7 Market opportunity by Material

Market opportunity by Material ($ million)
Data Table on Market opportunity by Material ($ million)

11. Customer Landscape

11.1 Customer landscape overview

Analysis of price sensitivity, lifecycle, customer purchase basket, adoption rates, and purchase criteria

12. Geographic Landscape

12.1 Geographic segmentation

Chart on Market share by geography 2025-2030 (%)
Data Table on Market share by geography 2025-2030 (%)

12.2 Geographic comparison

Chart on Geographic comparison
Data Table on Geographic comparison

12.3 North America - Market size and forecast 2025-2030

Chart on North America - Market size and forecast 2025-2030 ($ million)
Data Table on North America - Market size and forecast 2025-2030 ($ million)
Chart on North America - Year-over-year growth 2025-2030 (%)
Data Table on North America - Year-over-year growth 2025-2030 (%)
Chart on Regional Comparison - North America
Data Table on Regional Comparison - North America

12.3.1 US - Market size and forecast 2025-2030

Chart on US - Market size and forecast 2025-2030 ($ million)
Data Table on US - Market size and forecast 2025-2030 ($ million)
Chart on US - Year-over-year growth 2025-2030 (%)
Data Table on US - Year-over-year growth 2025-2030 (%)

12.3.2 Canada - Market size and forecast 2025-2030

Chart on Canada - Market size and forecast 2025-2030 ($ million)
Data Table on Canada - Market size and forecast 2025-2030 ($ million)
Chart on Canada - Year-over-year growth 2025-2030 (%)
Data Table on Canada - Year-over-year growth 2025-2030 (%)

12.3.3 Mexico - Market size and forecast 2025-2030

Chart on Mexico - Market size and forecast 2025-2030 ($ million)
Data Table on Mexico - Market size and forecast 2025-2030 ($ million)
Chart on Mexico - Year-over-year growth 2025-2030 (%)
Data Table on Mexico - Year-over-year growth 2025-2030 (%)

12.4 Europe - Market size and forecast 2025-2030

Chart on Europe - Market size and forecast 2025-2030 ($ million)
Data Table on Europe - Market size and forecast 2025-2030 ($ million)
Chart on Europe - Year-over-year growth 2025-2030 (%)
Data Table on Europe - Year-over-year growth 2025-2030 (%)
Chart on Regional Comparison - Europe
Data Table on Regional Comparison - Europe

12.4.1 Germany - Market size and forecast 2025-2030

Chart on Germany - Market size and forecast 2025-2030 ($ million)
Data Table on Germany - Market size and forecast 2025-2030 ($ million)
Chart on Germany - Year-over-year growth 2025-2030 (%)
Data Table on Germany - Year-over-year growth 2025-2030 (%)

12.4.2 UK - Market size and forecast 2025-2030

Chart on UK - Market size and forecast 2025-2030 ($ million)
Data Table on UK - Market size and forecast 2025-2030 ($ million)
Chart on UK - Year-over-year growth 2025-2030 (%)
Data Table on UK - Year-over-year growth 2025-2030 (%)

12.4.3 France - Market size and forecast 2025-2030

Chart on France - Market size and forecast 2025-2030 ($ million)
Data Table on France - Market size and forecast 2025-2030 ($ million)
Chart on France - Year-over-year growth 2025-2030 (%)
Data Table on France - Year-over-year growth 2025-2030 (%)

12.4.4 Italy - Market size and forecast 2025-2030

Chart on Italy - Market size and forecast 2025-2030 ($ million)
Data Table on Italy - Market size and forecast 2025-2030 ($ million)
Chart on Italy - Year-over-year growth 2025-2030 (%)
Data Table on Italy - Year-over-year growth 2025-2030 (%)

12.4.5 Spain - Market size and forecast 2025-2030

Chart on Spain - Market size and forecast 2025-2030 ($ million)
Data Table on Spain - Market size and forecast 2025-2030 ($ million)
Chart on Spain - Year-over-year growth 2025-2030 (%)
Data Table on Spain - Year-over-year growth 2025-2030 (%)

12.4.6 The Netherlands - Market size and forecast 2025-2030

Chart on The Netherlands - Market size and forecast 2025-2030 ($ million)
Data Table on The Netherlands - Market size and forecast 2025-2030 ($ million)
Chart on The Netherlands - Year-over-year growth 2025-2030 (%)
Data Table on The Netherlands - Year-over-year growth 2025-2030 (%)

12.5 Asia - Market size and forecast 2025-2030

Chart on Asia - Market size and forecast 2025-2030 ($ million)
Data Table on Asia - Market size and forecast 2025-2030 ($ million)
Chart on Asia - Year-over-year growth 2025-2030 (%)
Data Table on Asia - Year-over-year growth 2025-2030 (%)
Chart on Regional Comparison - Asia
Data Table on Regional Comparison - Asia

12.5.1 China - Market size and forecast 2025-2030

Chart on China - Market size and forecast 2025-2030 ($ million)
Data Table on China - Market size and forecast 2025-2030 ($ million)
Chart on China - Year-over-year growth 2025-2030 (%)
Data Table on China - Year-over-year growth 2025-2030 (%)

12.5.2 India - Market size and forecast 2025-2030

Chart on India - Market size and forecast 2025-2030 ($ million)
Data Table on India - Market size and forecast 2025-2030 ($ million)
Chart on India - Year-over-year growth 2025-2030 (%)
Data Table on India - Year-over-year growth 2025-2030 (%)

12.5.3 Japan - Market size and forecast 2025-2030

Chart on Japan - Market size and forecast 2025-2030 ($ million)
Data Table on Japan - Market size and forecast 2025-2030 ($ million)
Chart on Japan - Year-over-year growth 2025-2030 (%)
Data Table on Japan - Year-over-year growth 2025-2030 (%)

12.5.4 South Korea - Market size and forecast 2025-2030

Chart on South Korea - Market size and forecast 2025-2030 ($ million)
Data Table on South Korea - Market size and forecast 2025-2030 ($ million)
Chart on South Korea - Year-over-year growth 2025-2030 (%)
Data Table on South Korea - Year-over-year growth 2025-2030 (%)

12.5.5 Indonesia - Market size and forecast 2025-2030

Chart on Indonesia - Market size and forecast 2025-2030 ($ million)
Data Table on Indonesia - Market size and forecast 2025-2030 ($ million)
Chart on Indonesia - Year-over-year growth 2025-2030 (%)
Data Table on Indonesia - Year-over-year growth 2025-2030 (%)

12.5.6 Thailand - Market size and forecast 2025-2030

Chart on Thailand - Market size and forecast 2025-2030 ($ million)
Data Table on Thailand - Market size and forecast 2025-2030 ($ million)
Chart on Thailand - Year-over-year growth 2025-2030 (%)
Data Table on Thailand - Year-over-year growth 2025-2030 (%)

12.6 Rest of World (ROW) - Market size and forecast 2025-2030

Chart on Rest of World (ROW) - Market size and forecast 2025-2030 ($ million)
Data Table on Rest of World (ROW) - Market size and forecast 2025-2030 ($ million)
Chart on Rest of World (ROW) - Year-over-year growth 2025-2030 (%)
Data Table on Rest of World (ROW) - Year-over-year growth 2025-2030 (%)
Chart on Regional Comparison - Rest of World (ROW)
Data Table on Regional Comparison - Rest of World (ROW)

12.6.1 Brazil - Market size and forecast 2025-2030

Chart on Brazil - Market size and forecast 2025-2030 ($ million)
Data Table on Brazil - Market size and forecast 2025-2030 ($ million)
Chart on Brazil - Year-over-year growth 2025-2030 (%)
Data Table on Brazil - Year-over-year growth 2025-2030 (%)

12.6.2 Saudi Arabia - Market size and forecast 2025-2030

Chart on Saudi Arabia - Market size and forecast 2025-2030 ($ million)
Data Table on Saudi Arabia - Market size and forecast 2025-2030 ($ million)
Chart on Saudi Arabia - Year-over-year growth 2025-2030 (%)
Data Table on Saudi Arabia - Year-over-year growth 2025-2030 (%)

12.6.3 UAE - Market size and forecast 2025-2030

Chart on UAE - Market size and forecast 2025-2030 ($ million)
Data Table on UAE - Market size and forecast 2025-2030 ($ million)
Chart on UAE - Year-over-year growth 2025-2030 (%)
Data Table on UAE - Year-over-year growth 2025-2030 (%)

12.6.4 Turkey - Market size and forecast 2025-2030

Chart on Turkey - Market size and forecast 2025-2030 ($ million)
Data Table on Turkey - Market size and forecast 2025-2030 ($ million)
Chart on Turkey - Year-over-year growth 2025-2030 (%)
Data Table on Turkey - Year-over-year growth 2025-2030 (%)

12.6.5 Argentina - Market size and forecast 2025-2030

Chart on Argentina - Market size and forecast 2025-2030 ($ million)
Data Table on Argentina - Market size and forecast 2025-2030 ($ million)
Chart on Argentina - Year-over-year growth 2025-2030 (%)
Data Table on Argentina - Year-over-year growth 2025-2030 (%)

12.6.6 Colombia - Market size and forecast 2025-2030

Chart on Colombia - Market size and forecast 2025-2030 ($ million)
Data Table on Colombia - Market size and forecast 2025-2030 ($ million)
Chart on Colombia - Year-over-year growth 2025-2030 (%)
Data Table on Colombia - Year-over-year growth 2025-2030 (%)

12.6.7 South Africa - Market size and forecast 2025-2030

Chart on South Africa - Market size and forecast 2025-2030 ($ million)
Data Table on South Africa - Market size and forecast 2025-2030 ($ million)
Chart on South Africa - Year-over-year growth 2025-2030 (%)
Data Table on South Africa - Year-over-year growth 2025-2030 (%)

12.6.8 Israel - Market size and forecast 2025-2030

Chart on Israel - Market size and forecast 2025-2030 ($ million)
Data Table on Israel - Market size and forecast 2025-2030 ($ million)
Chart on Israel - Year-over-year growth 2025-2030 (%)
Data Table on Israel - Year-over-year growth 2025-2030 (%)

12.7 Market opportunity by geography

Market opportunity by geography ($ million)
Data Tables on Market opportunity by geography ($ million)

13. Drivers, Challenges, and Opportunity

13.1 Market drivers

Growth in peripheral artery disease and chronic metabolic disorders
Advances in guidewire material engineering and surface coating
Invasive therapies and outpatient vascular facilities

13.2 Market challenges

Regulatory scrutiny and post-market surveillance complexities
Metallurgical constraints and material supply bottlenecks
Hospital cost containment and severe price commoditization

13.3 Impact of drivers and challenges

Impact of drivers and challenges in 2025 and 2030

13.4 Market opportunities

Transradial peripheral interventions and long-shaft access devices
Knee micro-guidewires and pedal access strategies
Structured CTO algorithms and specialized crossing guidewires

14. Competitive Landscape

14.1 Overview

14.2

Overview on criticality of inputs and factors of differentiation

14.3 Landscape disruption

Overview on factors of disruption

14.4 Industry risks

Impact of key risks on business

15. Competitive Analysis

15.1 Companies profiled

Companies covered

15.2 Company ranking index

15.3 Market positioning of companies

Matrix on companies position and classification

15.4 Abbott Laboratories

Abbott Laboratories - Overview
Abbott Laboratories - Business segments
Abbott Laboratories - Key news
Abbott Laboratories - Key offerings
Abbott Laboratories - Segment focus
SWOT

15.5 Asahi Intecc Co. Ltd.

Asahi Intecc Co. Ltd. - Overview
Asahi Intecc Co. Ltd. - Business segments
Asahi Intecc Co. Ltd. - Key offerings
Asahi Intecc Co. Ltd. - Segment focus
SWOT

15.6 B.Braun SE

B.Braun SE - Overview
B.Braun SE - Product / Service
B.Braun SE - Key offerings
SWOT

15.7 Biomerics LLC

Biomerics LLC - Overview
Biomerics LLC - Product / Service
Biomerics LLC - Key offerings
SWOT

15.8 Boston Scientific Corp.

Boston Scientific Corp. - Overview
Boston Scientific Corp. - Business segments
Boston Scientific Corp. - Key offerings
Boston Scientific Corp. - Segment focus
SWOT

15.9 Cook Medical LLC

Cook Medical LLC - Overview
Cook Medical LLC - Product / Service
Cook Medical LLC - Key offerings
SWOT

15.10 Integer Holdings Corp.

Integer Holdings Corp. - Overview
Integer Holdings Corp. - Business segments
Integer Holdings Corp. - Key offerings
Integer Holdings Corp. - Segment focus
SWOT

15.11 Lepu Medical Co. Ltd.

Lepu Medical Co. Ltd. - Overview
Lepu Medical Co. Ltd. - Product / Service
Lepu Medical Co. Ltd. - Key offerings
SWOT

15.12 Medtronic Plc

Medtronic Plc - Overview
Medtronic Plc - Business segments
Medtronic Plc - Key news
Medtronic Plc - Key offerings
Medtronic Plc - Segment focus
SWOT

15.13 Merit Medical Systems Inc.

Merit Medical Systems Inc. - Overview
Merit Medical Systems Inc. - Business segments
Merit Medical Systems Inc. - Key offerings
Merit Medical Systems Inc. - Segment focus
SWOT

15.14 Nipro Corp.

Nipro Corp. - Overview
Nipro Corp. - Business segments
Nipro Corp. - Key offerings
Nipro Corp. - Segment focus
SWOT

15.15 Stryker Corp.

Stryker Corp. - Overview
Stryker Corp. - Business segments
Stryker Corp. - Key news
Stryker Corp. - Key offerings
Stryker Corp. - Segment focus
SWOT

15.16 TE Connectivity plc

TE Connectivity plc - Overview
TE Connectivity plc - Business segments
TE Connectivity plc - Key offerings
TE Connectivity plc - Segment focus
SWOT

15.17 Teleflex Inc.

Teleflex Inc. - Overview
Teleflex Inc. - Business segments
Teleflex Inc. - Key news
Teleflex Inc. - Key offerings
Teleflex Inc. - Segment focus
SWOT

15.18 Terumo Corp.

Terumo Corp. - Overview
Terumo Corp. - Business segments
Terumo Corp. - Key news
Terumo Corp. - Key offerings
Terumo Corp. - Segment focus
SWOT

16. Appendix

16.1 Scope of the report

Market definition
Objectives
Notes and caveats

16.2 Inclusions and exclusions checklist

Inclusions checklist
Exclusions checklist

16.3 Currency conversion rates for US$

16.4 Research methodology

16.5 Data procurement

Information sources

16.6 Data validation

16.7 Validation techniques employed for market sizing

16.8 Data synthesis

16.9 360 degree market analysis

16.10 List of abbreviations

Research Methodology

Technavio presents a detailed picture of the market by way of study, synthesis, and summation of data from multiple sources. The analysts have presented the various facets of the market with a particular focus on identifying the key industry influencers. The data thus presented is comprehensive, reliable, and the result of extensive research, both primary and secondary.

INFORMATION SOURCES

Primary sources

  • Manufacturers and suppliers
  • Channel partners
  • Industry experts
  • Strategic decision makers

Secondary sources

  • Industry journals and periodicals
  • Government data
  • Financial reports of key industry players
  • Historical data
  • Press releases

DATA ANALYSIS

Data Synthesis

  • Collation of data
  • Estimation of key figures
  • Analysis of derived insights

Data Validation

  • Triangulation with data models
  • Reference against proprietary databases
  • Corroboration with industry experts

REPORT WRITING

Qualitative

  • Market drivers
  • Market challenges
  • Market trends
  • Five forces analysis

Quantitative

  • Market size and forecast
  • Market segmentation
  • Geographical insights
  • Competitive landscape

Interested in this report?

Get your sample now to see our research methodology and insights!

Download Now

Frequently Asked Questions

Peripheral Guidewires market growth will increase by USD 334.3 million during 2026-2030.

The Peripheral Guidewires market is expected to grow at a CAGR of 5% during 2026-2030.

Peripheral Guidewires market is segmented by Application (Interventional, Diagnostic) End-user (Cath lab, Hospitals, Others) Material (Stainless steel, Nitinol, Hybrid materials, Others)

Abbott Laboratories, Asahi Intecc Co. Ltd., B.Braun SE, Biomerics LLC, Boston Scientific Corp., Cook Medical LLC, Cordis Corp., Integer Holdings Corp., Lepu Medical Co. Ltd., Medtronic Plc, Merit Medical Systems Inc., MicroApproach, Nipro Corp., Rontis Corp. SA, SCW Medicath Ltd., Shanghai Kindly Enterprise, Stryker Corp., TE Connectivity plc, Teleflex Inc., Terumo Corp. are a few of the key vendors in the Peripheral Guidewires market.

North America will register the highest growth rate of 36.1% among the other regions. Therefore, the Peripheral Guidewires market in North America is expected to garner significant business opportunities for the vendors during the forecast period.

US, Canada, Mexico, Germany, UK, France, Italy, Spain, The Netherlands, China, India, Japan, South Korea, Indonesia, Thailand, Brazil, Saudi Arabia, UAE, Turkey, Argentina, Colombia, South Africa, Israel

  • Growth in peripheral artery disease and chronic metabolic disorders is the driving factor this market.

The Peripheral Guidewires market vendors should focus on grabbing business opportunities from the Application segment as it accounted for the largest market share in the base year.
RIA - Research AI Assistant
Ask RIA
