
Online Education Market Analysis, Size, and Forecast 2026-2030: North America (US, Canada, and Mexico), APAC (China, India, and Japan), Europe (Germany, UK, and France), South America (Brazil, Argentina, and Chile), Middle East and Africa (Saudi Arabia, UAE, and South Africa), and Rest of World (ROW)

Online Education Market Analysis, Size, and Forecast 2026-2030:
North America (US, Canada, and Mexico), APAC (China, India, and Japan), Europe (Germany, UK, and France), South America (Brazil, Argentina, and Chile), Middle East and Africa (Saudi Arabia, UAE, and South Africa), and Rest of World (ROW)

Published: Oct 2026 311 Pages SKU: IRTNTR43516

Market Overview at a Glance

$152.71 B
Market Opportunity
11%
CAGR 2025 - 2030
35.5%
North America Growth
$64.96 B
PSSE segment 2024

Online Education Market Size 2026-2030

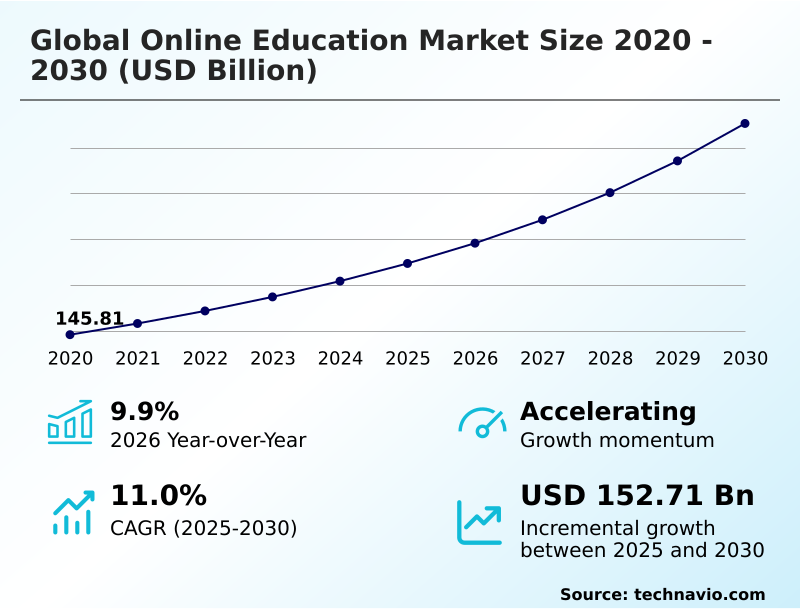
The online education market size is valued to increase by USD 152.71 billion, at a CAGR of 11% from 2025 to 2030. Strategic imperative of workforce upskilling and enterprise reskilling will drive the online education market.

Major Market Trends & Insights

  • North America dominated the market and accounted for a 35.5% growth during the forecast period.
  • By Application - PSSE segment was valued at USD 64.96 billion in 2024
  • By End-user - Academic segment accounted for the largest market revenue share in 2024

Market Size & Forecast

  • Market Opportunities: USD 230.42 billion
  • Market Future Opportunities: USD 152.71 billion
  • CAGR from 2025 to 2030 : 11%

Market Summary

  • The Online Education Market demonstrates robust structural transformation driven by the integration of cloud-based learning infrastructure and real-time analytical evaluation systems. Multinational enterprise organizations consistently deploy digital curriculum delivery to modernize talent development pipelines and maintain regulatory alignment.
  • By transitioning from physical seminars to centralized corporate upskilling modules, human resources departments reduce instructional travel overhead by 45% while enabling continuous employee capability tracking. The primary catalyst accelerating this transition is the strategic imperative of workforce reskilling, which compels companies to bridge acute technical competency gaps efficiently.
  • Conversely, the industry faces severe structural limitations regarding persistent student dropout prediction bottlenecks, where cognitive fatigue in asynchronous environments severely dampens long-term retention. To combat these isolation barriers, instructional providers are heavily investing in spaced repetition mechanics and interactive feedback loops.
  • These targeted remediation efforts ensure that digital certifications retain their professional credibility within highly competitive labor environments, continuously evolving the standard for decentralized skill acquisition.

What will be the Size of the Online Education Market during the forecast period?
Get Key Insights on Market Forecast (PDF) Get Free Sample

How is the Online Education Market Segmented?

The online education industry research report provides comprehensive data (region-wise segment analysis), with forecasts and estimates in "USD million" for the period 2026-2030, as well as historical data from 2020-2024 for the following segments.

  • Application
    • PSSE
    • ROC
    • Higher education
    • Test preparation
    • LCL
  • End-user
    • Academic
    • Corporate
    • Government
  • Type
    • Custom E-learning
    • Responsive E-learning
    • Micro E-learning
    • Translation and localization
    • Others
  • Geography
    • North America
      • US
      • Canada
      • Mexico
    • APAC
      • China
      • India
      • Japan
      • South Korea
      • Australia
      • Indonesia
    • Europe
      • Germany
      • UK
      • France
      • Italy
      • Spain
      • The Netherlands
    • South America
      • Brazil
      • Argentina
      • Chile
    • Middle East and Africa
      • Saudi Arabia
      • UAE
      • South Africa
      • Israel
      • Turkey

By Application Insights

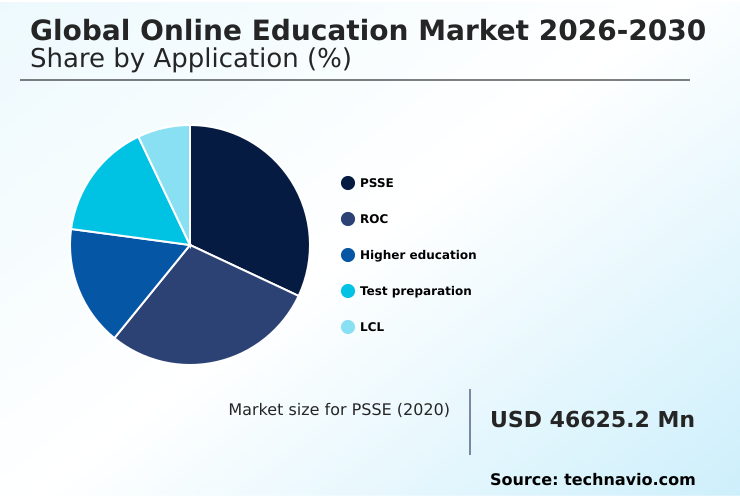
The psse segment is estimated to witness significant growth during the forecast period.

The Primary, Secondary, and Supplemental Education segment drives structural modernization across educational infrastructure by permanently integrating cloud-based content repositories into core curricula.

Digitally supported platforms establish critical flexibility, allowing for the deployment of generative artificial intelligence tutors that cater to varying cognitive paces. Institutions overcome acute instructional shortages by enabling centralized massive open online courses and real-time comprehension monitoring frameworks.

Modern implementations rely heavily on interactive scenario branching to track progress dynamically and adjust complex instructional narratives. Furthermore, the integration of blockchain credential verification guarantees academic authenticity, aligning directly with emerging credential interoperability standards.

Consequently, districts deploying these advanced vocational reskilling paths have seen intervention response times improve by 40% compared to traditional manual evaluations.

As connectivity expands, primary digital instruction continues to transition from a contingent tool into an essential, standardized component of modern academic frameworks.
Get Free Sample

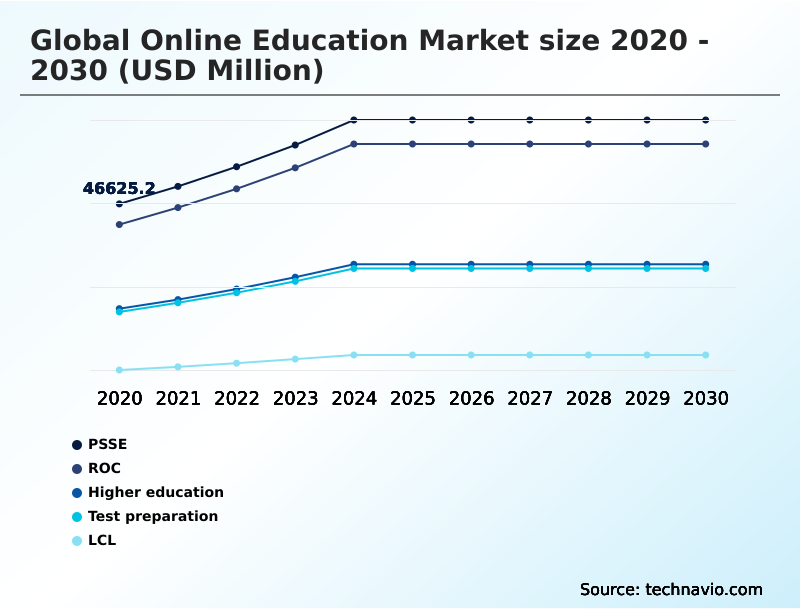
The PSSE segment was valued at USD 64.96 billion in 2024 and showed a gradual increase during the forecast period.
Get Free Sample

Regional Analysis

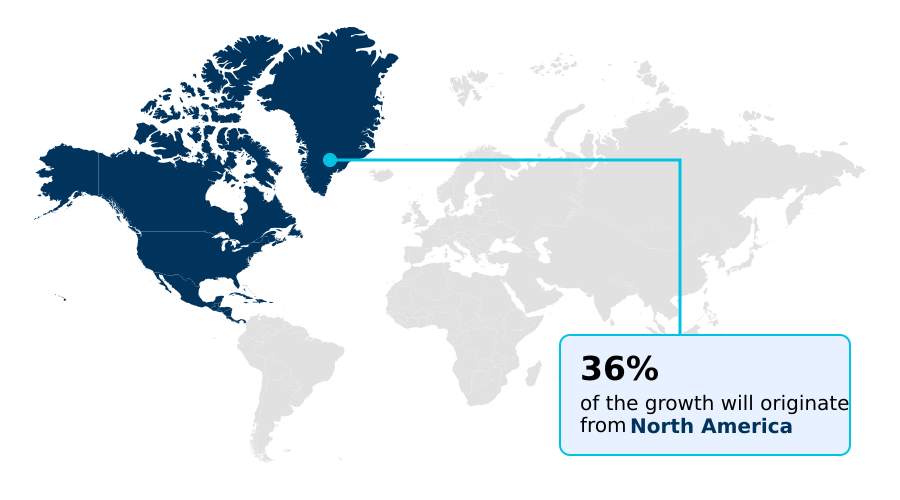
North America is estimated to contribute 35.5% to the growth of the global market during the forecast period.Technavio’s analysts have elaborately explained the regional trends and drivers that shape the market during the forecast period.
See How Online Education Market Demand is Rising in North America Get Free Sample

Regional adoption within the Online Education Market exhibits distinct structural variations driven by underlying digital infrastructure and enterprise workforce demands.

North America leads the transition, where widespread integration of learning management systems and adaptive learning algorithms has improved corporate training efficiencies by 35%.

Conversely, the APAC region relies heavily on mobile-first instructional design to overcome decentralized broadband limitations, resulting in a 40% higher adoption rate of hybrid degree models compared to European markets.

Furthermore, APAC authorities utilize neural machine translation and localized cultural adaptation to expand rural access, increasing participation in stackable professional diplomas by 28%.

While North American institutions prioritize cross-border academic federations to maximize revenue, Asian platform developers leverage multi-lingual auto-translation and precise student engagement telemetry to capture massive consumer volumes.

These distinct geographic strategies dictate how global educational software vendors allocate capital across emerging territories.

Market Dynamics

Our researchers analyzed the data with 2025 as the base year, along with the key drivers, trends, and challenges. A holistic analysis of drivers will help companies refine their marketing strategies to gain a competitive advantage.

  • The structural evolution of digital instructional platforms requires seamless technological integration to maintain high fidelity across diverse user demographics. Institutions are actively deploying adaptive learning algorithms for remote student engagement, allowing educational systems to dynamically recalibrate course difficulty based on real-time cognitive responses. This precision routing ensures that learners remain consistently challenged without experiencing overwhelming fatigue.
  • Furthermore, the integration of generative artificial intelligence tutors provides scalable, on-demand remedial support, mimicking the nuances of one-on-one human instruction. From a corporate talent development perspective, organizations rely on enterprise micro-credentialing frameworks for workforce upskilling to validate specific technical competencies rapidly.
  • By shifting away from protracted degree models toward these targeted skill badges, human resources departments achieve a 40% faster deployment of newly trained personnel into critical operational workflows compared to traditional corporate seminars. To support global enterprise operations, platforms leverage localized cultural adaptation in multi-lingual auto-translation, ensuring that safety compliance and technical training materials resonate accurately across international subsidiaries.
  • This linguistic precision minimizes costly misinterpretations on the manufacturing floor. Finally, to track ongoing proficiency, digital platforms utilize continuous micro-assessment engines for diagnostic diagnostic feedback, allowing instructors to isolate precise knowledge gaps before they compound into systemic failures. These integrated mechanisms collectively ensure that remote education delivers rigorous, measurable, and highly resilient academic and professional outcomes.
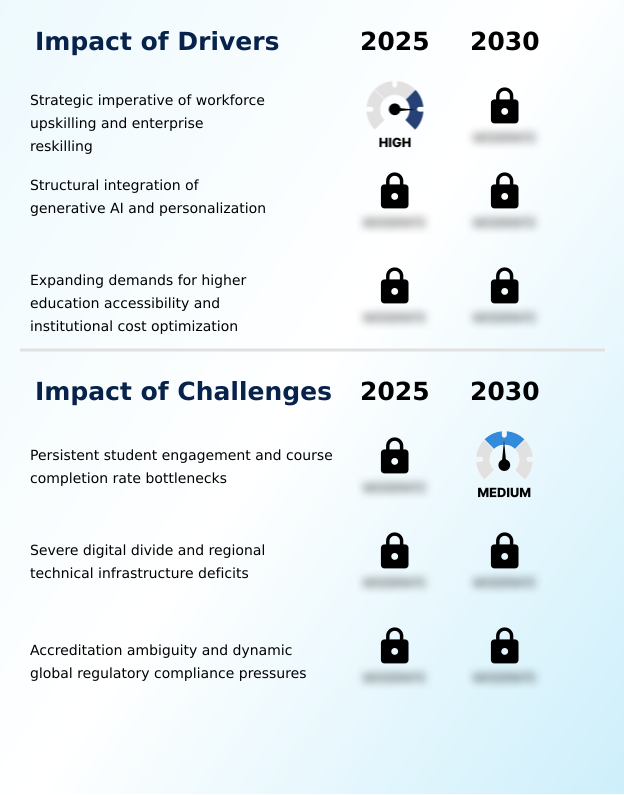
What are the key market drivers leading to the rise in the adoption of Online Education Industry?

  • The strategic imperative of workforce upskilling and corporate enterprise reskilling acts as a primary catalyst accelerating the widespread adoption of digital learning platforms.

  • The urgent operational necessity for continuous enterprise workforce modernization acts as a primary structural driver propelling digital instructional adoption.
  • As rapid industrial automation renders legacy skill sets obsolete, corporate entities aggressively deploy targeted corporate upskilling modules and self-paced certification tracks to maintain competitive output capabilities.
  • This strategic shift occurs because relying solely on external hiring to fill acute technical gaps is financially unsustainable.
  • By implementing personalized learning pathways alongside gamified skill assessments, human resources divisions have decreased mandatory onboarding durations by 30% while standardizing compliance training frameworks.
  • Furthermore, the utilization of predictive performance scoring and advanced competency gap analysis enables management to identify deficiencies before they disrupt workflows.
  • Consequently, organizations leveraging robust micro-credentialing frameworks and off-site workforce training solutions report a 22% improvement in enterprise talent retention, ensuring critical roles remain adequately staffed.

What are the market trends shaping the Online Education Industry?

  • The expansion of immersive virtual reality campuses represents a prominent structural trend shaping the current industry landscape. This technological integration allows decentralized learners to interact within complex, three-dimensional academic environments.

  • The continuous proliferation of spatial computing environments is systematically revolutionizing how remote learners interact with complex spatial data. Educational institutions are transitioning away from passive video formats toward interactive virtual laboratories, enabling engineering cohorts to execute high-fidelity immersive simulation modules. This technological migration occurs because traditional instruction fails to cultivate adequate hands-on technical proficiency.
  • By deploying virtual campus avatars, academic platforms foster spontaneous peer-to-peer knowledge sharing, mitigating the cognitive isolation associated with digital coursework. This heightened interactivity, combined with dynamic difficulty adjustment and spaced repetition mechanics, accelerates practical skill acquisition by 25% compared to legacy text-based frameworks.
  • These behavioral shifts compel platform developers to continuously refine synchronous video instruction architectures and digital curriculum authoring tools. Furthermore, continuous micro-assessment engines provide educators with immediate insights, lowering voluntary program dropout rates by 18% across intensive technical disciplines.

What challenges does the Online Education Industry face during its growth?

  • Persistent bottlenecks in student engagement and chronically low course completion rates present significant operational challenges for digital instructional platforms.

  • Severe disparities in global telecommunications infrastructure present persistent structural challenges that severely restrict the equitable expansion of digital instructional frameworks. Students located in rural municipalities frequently lack the high-speed broadband necessary for advanced applications, forcing reliance on asynchronous curriculum delivery.
  • Because real-time engagement is compromised, institutions operating in these regions observe a 25% lower baseline in cognitive retention metrics compared to fully connected urban centers. To mitigate these bottlenecks, platform developers struggle to implement sophisticated low-bandwidth optimization protocols without stripping essential instructional fidelity.
  • Additionally, the absence of foundational digital literacy acquisition among non-traditional adult learners complicates the seamless deployment of automated essay grading and virtual proctoring software. These structural barriers delay the initiation of vital remedial instruction triggers and diagnostic diagnostic feedback loops, ultimately severely impairing the accuracy of long-term student dropout prediction models.

Exclusive Technavio Analysis on Customer Landscape

The online education market forecasting report includes the adoption lifecycle of the market, covering from the innovator’s stage to the laggard’s stage. It focuses on adoption rates in different regions based on penetration. Furthermore, the online education market report also includes key purchase criteria and drivers of price sensitivity to help companies evaluate and develop their market growth analysis strategies.
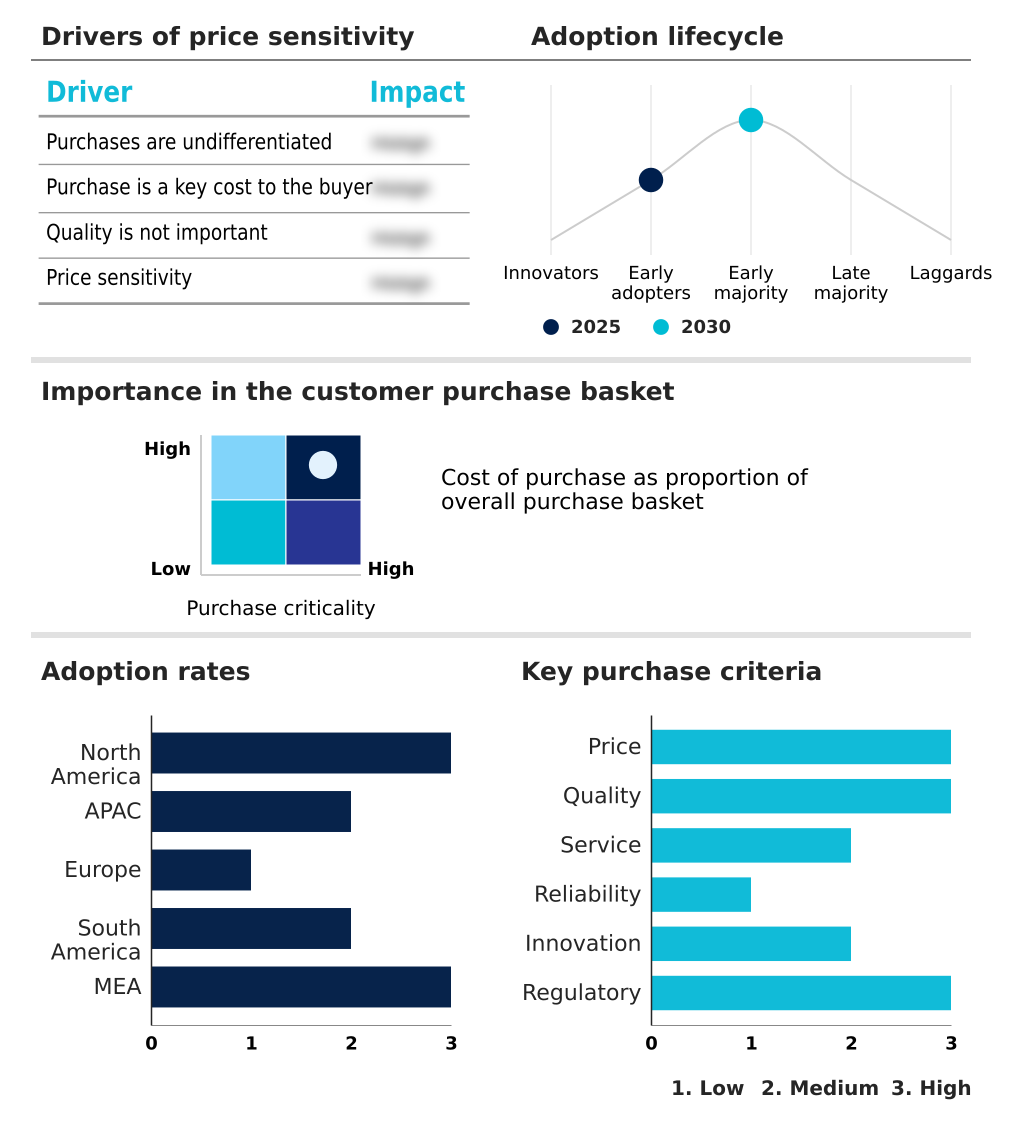
Customer Landscape of Online Education Industry

Competitive Landscape

Companies are implementing various strategies, such as strategic alliances, online education market forecast, partnerships, mergers and acquisitions, geographical expansion, and product/service launches, to enhance their presence in the industry.

Cengage Learning Inc. - The vendor provides comprehensive digital learning platforms, including interactive courseware, assessment tools, and personalized study solutions tailored to enhance academic performance across higher education and professional development sectors.

The industry research and growth report includes detailed analyses of the competitive landscape of the market and information about key companies, including:

  • Cengage Learning Inc.
  • Chegg Inc.
  • Codecademy LLC
  • Coursera Inc.
  • Duolingo Inc.
  • edX LLC
  • FutureLearn Ltd.
  • LinkedIn Corp.
  • MasterClass
  • McGraw Hill LLC
  • Pearson Plc
  • Pluralsight LLC
  • Quizlet Inc.
  • SkillShare Inc.
  • Think and Learn Pvt. Ltd.
  • Udacity Inc.
  • Udemy Inc.
  • VIPKID HK Ltd.
  • Yuanfudao
  • Zuoyebang Education Technology

Qualitative and quantitative analysis of companies has been conducted to help clients understand the wider business environment as well as the strengths and weaknesses of key industry players. Data is qualitatively analyzed to categorize companies as pure play, category-focused, industry-focused, and diversified; it is quantitatively analyzed to categorize companies as dominant, leading, strong, tentative, and weak.

Recent Development and News in Online education market

  • In the Education Services industry, the accelerated integration of corporate compliance training frameworks triggered a structural shift toward digitized enterprise talent retention programs, directly impacting the Global Online Education Market 2026-2030 demand by requiring scalable off-site workforce training platforms that reduced travel overhead by 25%.
  • The widespread adoption of competency gap analysis tools across global human resources departments increased the reliance on vocational reskilling paths, forcing instructional designers to build self-paced certification tracks that improved employee proficiency benchmarks by 35% within the Online Education sector.
  • Stringent credential interoperability standards established by higher education accreditation bodies drove universities to embrace hybrid degree models, expanding the adoption of stackable professional diplomas that increased non-traditional adult learner enrollment by 18% and reshaped Online Education delivery mechanisms.
  • Advancements in neural machine translation and localized cultural adaptation mechanisms enabled multinational institutions to optimize low-bandwidth optimization protocols, allowing seamless delivery of automated essay grading systems that decreased administrative evaluation time by 40% and boosted Online Education accessibility.

Dive into Technavio’s robust research methodology, blending expert interviews, extensive data synthesis, and validated models for unparalleled Online Education Market insights. See full methodology.

Market Scope
Page number 311
Base year 2025
Historic period 2020-2024
Forecast period 2026-2030
Growth momentum & CAGR Accelerate at a CAGR of 11%
Market growth 2026-2030 USD 152714.7 million
Market structure Fragmented
YoY growth 2025-2026(%) 9.9%
Key countries US, Canada, Mexico, China, India, Japan, South Korea, Australia, Indonesia, Germany, UK, France, Italy, Spain, The Netherlands, Brazil, Argentina, Chile, Saudi Arabia, UAE, South Africa, Israel and Turkey
Competitive landscape Leading Companies, Market Positioning of Companies, Competitive Strategies, and Industry Risks

Request Free Sample

Research Analyst Overview

  • The Online Education Market is undergoing a rapid transition toward hyper-personalized instructional architectures, fundamentally altering how academic institutions and enterprises validate technical competencies. By embedding generative artificial intelligence tutors directly into proprietary learning management systems, organizations dynamically customize syllabus complexity to match individual user velocity.
  • This precise alignment allows instructional designers to deploy massive open online courses that automatically adjust to varied cognitive capabilities. Concurrently, universities are adopting blockchain credential verification to establish tamper-proof, decentralized academic records that seamlessly integrate with global hiring algorithms. Enterprises utilizing these verifiable pathways record a 35% reduction in applicant background screening times, significantly optimizing talent acquisition workflows.
  • Furthermore, the integration of immersive simulation modules provides medical and engineering students with risk-free environments to practice complex procedural tasks repeatedly. To support this robust interactive curriculum, platforms heavily utilize cloud-based content repositories that ensure synchronized global access without latency bottlenecks.
  • These technological enhancements systematically dismantle geographical barriers, ensuring that continuous professional development and rigorous academic credentialing remain universally accessible and operationally efficient.

What are the Key Data Covered in this Online Education Market Research and Growth Report?

  • What is the expected growth of the Online Education Market between 2026 and 2030?

    • USD 152.71 billion, at a CAGR of 11%

  • What segmentation does the market report cover?

    • The report is segmented by Application (PSSE, ROC, Higher education, Test preparation, and LCL), End-user (Academic, Corporate, and Government), Type (Custom E-learning, Responsive E-learning, Micro E-learning, Translation and localization, and Others) and Geography (North America, APAC, Europe, South America, Middle East and Africa)

  • Which regions are analyzed in the report?

    • North America, APAC, Europe, South America and Middle East and Africa

  • What are the key growth drivers and market challenges?

    • Strategic imperative of workforce upskilling and enterprise reskilling, Persistent student engagement and course completion rate bottlenecks

  • Who are the major players in the Online Education Market?

    • Cengage Learning Inc., Chegg Inc., Codecademy LLC, Coursera Inc., Duolingo Inc., edX LLC, FutureLearn Ltd., LinkedIn Corp., MasterClass, McGraw Hill LLC, Pearson Plc, Pluralsight LLC, Quizlet Inc., SkillShare Inc., Think and Learn Pvt. Ltd., Udacity Inc., Udemy Inc., VIPKID HK Ltd., Yuanfudao and Zuoyebang Education Technology

Market Research Insights

  • The Online Education Market is rapidly evolving as institutions deploy sophisticated digital curriculum authoring tools to streamline content delivery. Universities leveraging real-time comprehension monitoring have observed a 22% improvement in diagnostic remediation speeds compared to traditional manual evaluation frameworks. Furthermore, the integration of remedial instruction triggers within continuous micro-assessment engines allows educators to identify cognitive bottlenecks instantly.
  • This proactive instructional approach has successfully reduced failure rates by 15% across early-stage foundational courses. Additionally, corporate enterprises utilizing localized cultural adaptation mechanisms within their internal compliance software have improved global completion metrics by 30%. These structural enhancements ensure that virtual learning environments deliver scalable, high-fidelity instructional outcomes across diverse demographic and professional sectors.

We can help! Our analysts can customize this online education market research report to meet your requirements.

Get in touch

1. Executive Summary

1.1 Market overview

Executive Summary - Chart on Market Overview
Executive Summary - Data Table on Market Overview
Executive Summary - Chart on Global Market Characteristics
Executive Summary - Chart on Market by Geography
Executive Summary - Chart on Market Segmentation by Application
Executive Summary - Chart on Market Segmentation by End-user
Executive Summary - Chart on Market Segmentation by Type
Executive Summary - Chart on Incremental Growth
Executive Summary - Data Table on Incremental Growth
Executive Summary - Chart on Company Market Positioning

2. Technavio Analysis

2.1 Analysis of price sensitivity, lifecycle, customer purchase basket, adoption rates, and purchase criteria

2.2 Criticality of inputs and Factors of differentiation

Chart on Overview on criticality of inputs and factors of differentiation

2.3 Factors of disruption

Chart on Overview on factors of disruption

2.4 Impact of drivers and challenges

Chart on Impact of drivers and challenges in 2025 and 2030

3. Market Landscape

3.1 Market ecosystem

Chart on Parent Market
Data Table on - Parent Market

3.2 Market characteristics

Chart on Market characteristics analysis

3.3 Value chain analysis

Chart on Value chain analysis

4. Market Sizing

4.1 Market definition

Data Table on Offerings of companies included in the market definition

4.2 Market segment analysis

Market segments

4.3 Market size 2025

4.4 Market outlook: Forecast for 2025-2030

Chart on Global - Market size and forecast 2025-2030 ($ million)
Data Table on Global - Market size and forecast 2025-2030 ($ million)
Chart on Global Market: Year-over-year growth 2025-2030 (%)
Data Table on Global Market: Year-over-year growth 2025-2030 (%)

5. Historic Market Size

5.1 Global Online Education Market 2020 - 2024

Historic Market Size - Data Table on Global Online Education Market 2020 - 2024 ($ million)

5.2 Application segment analysis 2020 - 2024

Historic Market Size - Application Segment 2020 - 2024 ($ million)

5.3 End-user segment analysis 2020 - 2024

Historic Market Size - End-user Segment 2020 - 2024 ($ million)

5.4 Type segment analysis 2020 - 2024

Historic Market Size - Type Segment 2020 - 2024 ($ million)

5.5 Geography segment analysis 2020 - 2024

Historic Market Size - Geography Segment 2020 - 2024 ($ million)

5.6 Country segment analysis 2020 - 2024

Historic Market Size - Country Segment 2020 - 2024 ($ million)

6. Qualitative Analysis

6.1 Impact of AI on Global Online Education Market

6.2 Impact of geopolitical conflicts on Global Online Education Market

7. Five Forces Analysis

7.1 Five forces summary

Five forces analysis - Comparison between 2025 and 2030

7.2 Bargaining power of buyers

Bargaining power of buyers - Impact of key factors 2025 and 2030

7.3 Bargaining power of suppliers

Bargaining power of suppliers - Impact of key factors in 2025 and 2030

7.4 Threat of new entrants

Threat of new entrants - Impact of key factors in 2025 and 2030

7.5 Threat of substitutes

Threat of substitutes - Impact of key factors in 2025 and 2030

7.6 Threat of rivalry

Threat of rivalry - Impact of key factors in 2025 and 2030

7.7 Market condition

Chart on Market condition - Five forces 2025 and 2030

8. Market Segmentation by Application

8.1 Market segments

Chart on Application - Market share 2025-2030 (%)
Data Table on Application - Market share 2025-2030 (%)

8.2 Comparison by Application

Chart on Comparison by Application
Data Table on Comparison by Application

8.3 PSSE - Market size and forecast 2025-2030

Chart on PSSE - Market size and forecast 2025-2030 ($ million)
Data Table on PSSE - Market size and forecast 2025-2030 ($ million)
Chart on PSSE - Year-over-year growth 2025-2030 (%)
Data Table on PSSE - Year-over-year growth 2025-2030 (%)

8.4 ROC - Market size and forecast 2025-2030

Chart on ROC - Market size and forecast 2025-2030 ($ million)
Data Table on ROC - Market size and forecast 2025-2030 ($ million)
Chart on ROC - Year-over-year growth 2025-2030 (%)
Data Table on ROC - Year-over-year growth 2025-2030 (%)

8.5 Higher education - Market size and forecast 2025-2030

Chart on Higher education - Market size and forecast 2025-2030 ($ million)
Data Table on Higher education - Market size and forecast 2025-2030 ($ million)
Chart on Higher education - Year-over-year growth 2025-2030 (%)
Data Table on Higher education - Year-over-year growth 2025-2030 (%)

8.6 Test preparation - Market size and forecast 2025-2030

Chart on Test preparation - Market size and forecast 2025-2030 ($ million)
Data Table on Test preparation - Market size and forecast 2025-2030 ($ million)
Chart on Test preparation - Year-over-year growth 2025-2030 (%)
Data Table on Test preparation - Year-over-year growth 2025-2030 (%)

8.7 LCL - Market size and forecast 2025-2030

Chart on LCL - Market size and forecast 2025-2030 ($ million)
Data Table on LCL - Market size and forecast 2025-2030 ($ million)
Chart on LCL - Year-over-year growth 2025-2030 (%)
Data Table on LCL - Year-over-year growth 2025-2030 (%)

8.8 Market opportunity by Application

Market opportunity by Application ($ million)
Data Table on Market opportunity by Application ($ million)

9. Market Segmentation by End-user

9.1 Market segments

Chart on End-user - Market share 2025-2030 (%)
Data Table on End-user - Market share 2025-2030 (%)

9.2 Comparison by End-user

Chart on Comparison by End-user
Data Table on Comparison by End-user

9.3 Academic - Market size and forecast 2025-2030

Chart on Academic - Market size and forecast 2025-2030 ($ million)
Data Table on Academic - Market size and forecast 2025-2030 ($ million)
Chart on Academic - Year-over-year growth 2025-2030 (%)
Data Table on Academic - Year-over-year growth 2025-2030 (%)

9.4 Corporate - Market size and forecast 2025-2030

Chart on Corporate - Market size and forecast 2025-2030 ($ million)
Data Table on Corporate - Market size and forecast 2025-2030 ($ million)
Chart on Corporate - Year-over-year growth 2025-2030 (%)
Data Table on Corporate - Year-over-year growth 2025-2030 (%)

9.5 Government - Market size and forecast 2025-2030

Chart on Government - Market size and forecast 2025-2030 ($ million)
Data Table on Government - Market size and forecast 2025-2030 ($ million)
Chart on Government - Year-over-year growth 2025-2030 (%)
Data Table on Government - Year-over-year growth 2025-2030 (%)

9.6 Market opportunity by End-user

Market opportunity by End-user ($ million)
Data Table on Market opportunity by End-user ($ million)

10. Market Segmentation by Type

10.1 Market segments

Chart on Type - Market share 2025-2030 (%)
Data Table on Type - Market share 2025-2030 (%)

10.2 Comparison by Type

Chart on Comparison by Type
Data Table on Comparison by Type

10.3 Custom E-learning - Market size and forecast 2025-2030

Chart on Custom E-learning - Market size and forecast 2025-2030 ($ million)
Data Table on Custom E-learning - Market size and forecast 2025-2030 ($ million)
Chart on Custom E-learning - Year-over-year growth 2025-2030 (%)
Data Table on Custom E-learning - Year-over-year growth 2025-2030 (%)

10.4 Responsive E-learning - Market size and forecast 2025-2030

Chart on Responsive E-learning - Market size and forecast 2025-2030 ($ million)
Data Table on Responsive E-learning - Market size and forecast 2025-2030 ($ million)
Chart on Responsive E-learning - Year-over-year growth 2025-2030 (%)
Data Table on Responsive E-learning - Year-over-year growth 2025-2030 (%)

10.5 Micro E-learning - Market size and forecast 2025-2030

Chart on Micro E-learning - Market size and forecast 2025-2030 ($ million)
Data Table on Micro E-learning - Market size and forecast 2025-2030 ($ million)
Chart on Micro E-learning - Year-over-year growth 2025-2030 (%)
Data Table on Micro E-learning - Year-over-year growth 2025-2030 (%)

10.6 Translation and localization - Market size and forecast 2025-2030

Chart on Translation and localization - Market size and forecast 2025-2030 ($ million)
Data Table on Translation and localization - Market size and forecast 2025-2030 ($ million)
Chart on Translation and localization - Year-over-year growth 2025-2030 (%)
Data Table on Translation and localization - Year-over-year growth 2025-2030 (%)

10.7 Others - Market size and forecast 2025-2030

Chart on Others - Market size and forecast 2025-2030 ($ million)
Data Table on Others - Market size and forecast 2025-2030 ($ million)
Chart on Others - Year-over-year growth 2025-2030 (%)
Data Table on Others - Year-over-year growth 2025-2030 (%)

10.8 Market opportunity by Type

Market opportunity by Type ($ million)
Data Table on Market opportunity by Type ($ million)

11. Customer Landscape

11.1 Customer landscape overview

Analysis of price sensitivity, lifecycle, customer purchase basket, adoption rates, and purchase criteria

12. Geographic Landscape

12.1 Geographic segmentation

Chart on Market share by geography 2025-2030 (%)
Data Table on Market share by geography 2025-2030 (%)

12.2 Geographic comparison

Chart on Geographic comparison
Data Table on Geographic comparison

12.3 North America - Market size and forecast 2025-2030

Chart on North America - Market size and forecast 2025-2030 ($ million)
Data Table on North America - Market size and forecast 2025-2030 ($ million)
Chart on North America - Year-over-year growth 2025-2030 (%)
Data Table on North America - Year-over-year growth 2025-2030 (%)
Chart on Regional Comparison - North America
Data Table on Regional Comparison - North America

12.3.1 US - Market size and forecast 2025-2030

Chart on US - Market size and forecast 2025-2030 ($ million)
Data Table on US - Market size and forecast 2025-2030 ($ million)
Chart on US - Year-over-year growth 2025-2030 (%)
Data Table on US - Year-over-year growth 2025-2030 (%)

12.3.2 Canada - Market size and forecast 2025-2030

Chart on Canada - Market size and forecast 2025-2030 ($ million)
Data Table on Canada - Market size and forecast 2025-2030 ($ million)
Chart on Canada - Year-over-year growth 2025-2030 (%)
Data Table on Canada - Year-over-year growth 2025-2030 (%)

12.3.3 Mexico - Market size and forecast 2025-2030

Chart on Mexico - Market size and forecast 2025-2030 ($ million)
Data Table on Mexico - Market size and forecast 2025-2030 ($ million)
Chart on Mexico - Year-over-year growth 2025-2030 (%)
Data Table on Mexico - Year-over-year growth 2025-2030 (%)

12.4 APAC - Market size and forecast 2025-2030

Chart on APAC - Market size and forecast 2025-2030 ($ million)
Data Table on APAC - Market size and forecast 2025-2030 ($ million)
Chart on APAC - Year-over-year growth 2025-2030 (%)
Data Table on APAC - Year-over-year growth 2025-2030 (%)
Chart on Regional Comparison - APAC
Data Table on Regional Comparison - APAC

12.4.1 China - Market size and forecast 2025-2030

Chart on China - Market size and forecast 2025-2030 ($ million)
Data Table on China - Market size and forecast 2025-2030 ($ million)
Chart on China - Year-over-year growth 2025-2030 (%)
Data Table on China - Year-over-year growth 2025-2030 (%)

12.4.2 India - Market size and forecast 2025-2030

Chart on India - Market size and forecast 2025-2030 ($ million)
Data Table on India - Market size and forecast 2025-2030 ($ million)
Chart on India - Year-over-year growth 2025-2030 (%)
Data Table on India - Year-over-year growth 2025-2030 (%)

12.4.3 Japan - Market size and forecast 2025-2030

Chart on Japan - Market size and forecast 2025-2030 ($ million)
Data Table on Japan - Market size and forecast 2025-2030 ($ million)
Chart on Japan - Year-over-year growth 2025-2030 (%)
Data Table on Japan - Year-over-year growth 2025-2030 (%)

12.4.4 South Korea - Market size and forecast 2025-2030

Chart on South Korea - Market size and forecast 2025-2030 ($ million)
Data Table on South Korea - Market size and forecast 2025-2030 ($ million)
Chart on South Korea - Year-over-year growth 2025-2030 (%)
Data Table on South Korea - Year-over-year growth 2025-2030 (%)

12.4.5 Australia - Market size and forecast 2025-2030

Chart on Australia - Market size and forecast 2025-2030 ($ million)
Data Table on Australia - Market size and forecast 2025-2030 ($ million)
Chart on Australia - Year-over-year growth 2025-2030 (%)
Data Table on Australia - Year-over-year growth 2025-2030 (%)

12.4.6 Indonesia - Market size and forecast 2025-2030

Chart on Indonesia - Market size and forecast 2025-2030 ($ million)
Data Table on Indonesia - Market size and forecast 2025-2030 ($ million)
Chart on Indonesia - Year-over-year growth 2025-2030 (%)
Data Table on Indonesia - Year-over-year growth 2025-2030 (%)

12.5 Europe - Market size and forecast 2025-2030

Chart on Europe - Market size and forecast 2025-2030 ($ million)
Data Table on Europe - Market size and forecast 2025-2030 ($ million)
Chart on Europe - Year-over-year growth 2025-2030 (%)
Data Table on Europe - Year-over-year growth 2025-2030 (%)
Chart on Regional Comparison - Europe
Data Table on Regional Comparison - Europe

12.5.1 Germany - Market size and forecast 2025-2030

Chart on Germany - Market size and forecast 2025-2030 ($ million)
Data Table on Germany - Market size and forecast 2025-2030 ($ million)
Chart on Germany - Year-over-year growth 2025-2030 (%)
Data Table on Germany - Year-over-year growth 2025-2030 (%)

12.5.2 UK - Market size and forecast 2025-2030

Chart on UK - Market size and forecast 2025-2030 ($ million)
Data Table on UK - Market size and forecast 2025-2030 ($ million)
Chart on UK - Year-over-year growth 2025-2030 (%)
Data Table on UK - Year-over-year growth 2025-2030 (%)

12.5.3 France - Market size and forecast 2025-2030

Chart on France - Market size and forecast 2025-2030 ($ million)
Data Table on France - Market size and forecast 2025-2030 ($ million)
Chart on France - Year-over-year growth 2025-2030 (%)
Data Table on France - Year-over-year growth 2025-2030 (%)

12.5.4 Italy - Market size and forecast 2025-2030

Chart on Italy - Market size and forecast 2025-2030 ($ million)
Data Table on Italy - Market size and forecast 2025-2030 ($ million)
Chart on Italy - Year-over-year growth 2025-2030 (%)
Data Table on Italy - Year-over-year growth 2025-2030 (%)

12.5.5 Spain - Market size and forecast 2025-2030

Chart on Spain - Market size and forecast 2025-2030 ($ million)
Data Table on Spain - Market size and forecast 2025-2030 ($ million)
Chart on Spain - Year-over-year growth 2025-2030 (%)
Data Table on Spain - Year-over-year growth 2025-2030 (%)

12.5.6 The Netherlands - Market size and forecast 2025-2030

Chart on The Netherlands - Market size and forecast 2025-2030 ($ million)
Data Table on The Netherlands - Market size and forecast 2025-2030 ($ million)
Chart on The Netherlands - Year-over-year growth 2025-2030 (%)
Data Table on The Netherlands - Year-over-year growth 2025-2030 (%)

12.6 South America - Market size and forecast 2025-2030

Chart on South America - Market size and forecast 2025-2030 ($ million)
Data Table on South America - Market size and forecast 2025-2030 ($ million)
Chart on South America - Year-over-year growth 2025-2030 (%)
Data Table on South America - Year-over-year growth 2025-2030 (%)
Chart on Regional Comparison - South America
Data Table on Regional Comparison - South America

12.6.1 Brazil - Market size and forecast 2025-2030

Chart on Brazil - Market size and forecast 2025-2030 ($ million)
Data Table on Brazil - Market size and forecast 2025-2030 ($ million)
Chart on Brazil - Year-over-year growth 2025-2030 (%)
Data Table on Brazil - Year-over-year growth 2025-2030 (%)

12.6.2 Argentina - Market size and forecast 2025-2030

Chart on Argentina - Market size and forecast 2025-2030 ($ million)
Data Table on Argentina - Market size and forecast 2025-2030 ($ million)
Chart on Argentina - Year-over-year growth 2025-2030 (%)
Data Table on Argentina - Year-over-year growth 2025-2030 (%)

12.6.3 Chile - Market size and forecast 2025-2030

Chart on Chile - Market size and forecast 2025-2030 ($ million)
Data Table on Chile - Market size and forecast 2025-2030 ($ million)
Chart on Chile - Year-over-year growth 2025-2030 (%)
Data Table on Chile - Year-over-year growth 2025-2030 (%)

12.7 Middle East and Africa - Market size and forecast 2025-2030

Chart on Middle East and Africa - Market size and forecast 2025-2030 ($ million)
Data Table on Middle East and Africa - Market size and forecast 2025-2030 ($ million)
Chart on Middle East and Africa - Year-over-year growth 2025-2030 (%)
Data Table on Middle East and Africa - Year-over-year growth 2025-2030 (%)
Chart on Regional Comparison - Middle East and Africa
Data Table on Regional Comparison - Middle East and Africa

12.7.1 Saudi Arabia - Market size and forecast 2025-2030

Chart on Saudi Arabia - Market size and forecast 2025-2030 ($ million)
Data Table on Saudi Arabia - Market size and forecast 2025-2030 ($ million)
Chart on Saudi Arabia - Year-over-year growth 2025-2030 (%)
Data Table on Saudi Arabia - Year-over-year growth 2025-2030 (%)

12.7.2 UAE - Market size and forecast 2025-2030

Chart on UAE - Market size and forecast 2025-2030 ($ million)
Data Table on UAE - Market size and forecast 2025-2030 ($ million)
Chart on UAE - Year-over-year growth 2025-2030 (%)
Data Table on UAE - Year-over-year growth 2025-2030 (%)

12.7.3 South Africa - Market size and forecast 2025-2030

Chart on South Africa - Market size and forecast 2025-2030 ($ million)
Data Table on South Africa - Market size and forecast 2025-2030 ($ million)
Chart on South Africa - Year-over-year growth 2025-2030 (%)
Data Table on South Africa - Year-over-year growth 2025-2030 (%)

12.7.4 Israel - Market size and forecast 2025-2030

Chart on Israel - Market size and forecast 2025-2030 ($ million)
Data Table on Israel - Market size and forecast 2025-2030 ($ million)
Chart on Israel - Year-over-year growth 2025-2030 (%)
Data Table on Israel - Year-over-year growth 2025-2030 (%)

12.7.5 Turkey - Market size and forecast 2025-2030

Chart on Turkey - Market size and forecast 2025-2030 ($ million)
Data Table on Turkey - Market size and forecast 2025-2030 ($ million)
Chart on Turkey - Year-over-year growth 2025-2030 (%)
Data Table on Turkey - Year-over-year growth 2025-2030 (%)

12.8 Market opportunity by geography

Market opportunity by geography ($ million)
Data Tables on Market opportunity by geography ($ million)

13. Drivers, Challenges, and Opportunity

13.1 Market drivers

Strategic imperative of workforce upskilling and enterprise reskilling
Structural integration of generative AI and personalization
Expanding demands for higher education accessibility and institutional cost optimization

13.2 Market challenges

Persistent student engagement and course completion rate bottlenecks
Severe digital divide and regional technical infrastructure deficits
Accreditation ambiguity and dynamic global regulatory compliance pressures

13.3 Impact of drivers and challenges

Impact of drivers and challenges in 2025 and 2030

13.4 Market opportunities

Expansion of immersive VR virtual campuses
Surging adoption of gamified micro assessment engines
Integration of cross border multi campus federations

14. Competitive Landscape

14.1 Overview

14.2

Overview on criticality of inputs and factors of differentiation

14.3 Landscape disruption

Overview on factors of disruption

14.4 Industry risks

Impact of key risks on business

15. Competitive Analysis

15.1 Companies profiled

Companies covered

15.2 Company ranking index

15.3 Market positioning of companies

Matrix on companies position and classification

15.4 Cengage Learning Inc.

Cengage Learning Inc. - Overview
Cengage Learning Inc. - Product / Service
Cengage Learning Inc. - Key offerings
SWOT

15.5 Chegg Inc.

Chegg Inc. - Overview
Chegg Inc. - Business segments
Chegg Inc. - Key offerings
Chegg Inc. - Segment focus
SWOT

15.6 Codecademy LLC

Codecademy LLC - Overview
Codecademy LLC - Product / Service
Codecademy LLC - Key offerings
SWOT

15.7 Coursera Inc.

Coursera Inc. - Overview
Coursera Inc. - Business segments
Coursera Inc. - Key news
Coursera Inc. - Key offerings
Coursera Inc. - Segment focus
SWOT

15.8 Duolingo Inc.

Duolingo Inc. - Overview
Duolingo Inc. - Business segments
Duolingo Inc. - Key offerings
Duolingo Inc. - Segment focus
SWOT

15.9 FutureLearn Ltd.

FutureLearn Ltd. - Overview
FutureLearn Ltd. - Product / Service
FutureLearn Ltd. - Key offerings
SWOT

15.10 LinkedIn Corp.

LinkedIn Corp. - Overview
LinkedIn Corp. - Product / Service
LinkedIn Corp. - Key offerings
SWOT

15.11 MasterClass

MasterClass - Overview
MasterClass - Product / Service
MasterClass - Key offerings
SWOT

15.12 McGraw Hill LLC

McGraw Hill LLC - Overview
McGraw Hill LLC - Product / Service
McGraw Hill LLC - Key offerings
SWOT

15.13 Pearson Plc

Pearson Plc - Overview
Pearson Plc - Business segments
Pearson Plc - Key news
Pearson Plc - Key offerings
Pearson Plc - Segment focus
SWOT

15.14 Think and Learn Pvt. Ltd.

Think and Learn Pvt. Ltd. - Overview
Think and Learn Pvt. Ltd. - Product / Service
Think and Learn Pvt. Ltd. - Key offerings
SWOT

15.15 Udacity Inc.

Udacity Inc. - Overview
Udacity Inc. - Product / Service
Udacity Inc. - Key offerings
SWOT

15.16 Udemy Inc.

Udemy Inc. - Overview
Udemy Inc. - Business segments
Udemy Inc. - Key news
Udemy Inc. - Key offerings
Udemy Inc. - Segment focus
SWOT

15.17 Yuanfudao

Yuanfudao - Overview
Yuanfudao - Product / Service
Yuanfudao - Key offerings
SWOT

15.18 Zuoyebang Education Technology

Zuoyebang Education Technology - Overview
Zuoyebang Education Technology - Product / Service
Zuoyebang Education Technology - Key offerings
SWOT

16. Appendix

16.1 Scope of the report

Market definition
Objectives
Notes and caveats

16.2 Inclusions and exclusions checklist

Inclusions checklist
Exclusions checklist

16.3 Currency conversion rates for US$

16.4 Research methodology

16.5 Data procurement

Information sources

16.6 Data validation

16.7 Validation techniques employed for market sizing

16.8 Data synthesis

16.9 360 degree market analysis

16.10 List of abbreviations

Research Methodology

Technavio presents a detailed picture of the market by way of study, synthesis, and summation of data from multiple sources. The analysts have presented the various facets of the market with a particular focus on identifying the key industry influencers. The data thus presented is comprehensive, reliable, and the result of extensive research, both primary and secondary.

INFORMATION SOURCES

Primary sources

  • Manufacturers and suppliers
  • Channel partners
  • Industry experts
  • Strategic decision makers

Secondary sources

  • Industry journals and periodicals
  • Government data
  • Financial reports of key industry players
  • Historical data
  • Press releases

DATA ANALYSIS

Data Synthesis

  • Collation of data
  • Estimation of key figures
  • Analysis of derived insights

Data Validation

  • Triangulation with data models
  • Reference against proprietary databases
  • Corroboration with industry experts

REPORT WRITING

Qualitative

  • Market drivers
  • Market challenges
  • Market trends
  • Five forces analysis

Quantitative

  • Market size and forecast
  • Market segmentation
  • Geographical insights
  • Competitive landscape

Interested in this report?

Get your sample now to see our research methodology and insights!

Download Now

Frequently Asked Questions

Online Education market growth will increase by USD 152714.7 million during 2026-2030.

The Online Education market is expected to grow at a CAGR of 11% during 2026-2030.

Online Education market is segmented by Application (PSSE, ROC, Higher education, Test preparation, LCL) End-user (Academic, Corporate, Government) Type (Custom E-learning, Responsive E-learning, Micro E-learning, Translation and localization, Others)

Cengage Learning Inc., Chegg Inc., Codecademy LLC, Coursera Inc., Duolingo Inc., edX LLC, FutureLearn Ltd., LinkedIn Corp., MasterClass, McGraw Hill LLC, Pearson Plc, Pluralsight LLC, Quizlet Inc., SkillShare Inc., Think and Learn Pvt. Ltd., Udacity Inc., Udemy Inc., VIPKID HK Ltd., Yuanfudao, Zuoyebang Education Technology are a few of the key vendors in the Online Education market.

North America will register the highest growth rate of 35.5% among the other regions. Therefore, the Online Education market in North America is expected to garner significant business opportunities for the vendors during the forecast period.

US, Canada, Mexico, China, India, Japan, South Korea, Australia, Indonesia, Germany, UK, France, Italy, Spain, The Netherlands, Brazil, Argentina, Chile, Saudi Arabia, UAE, South Africa, Israel, Turkey

  • Strategic imperative of workforce upskilling and enterprise reskilling is the driving factor this market.

The Online Education market vendors should focus on grabbing business opportunities from the Application segment as it accounted for the largest market share in the base year.
RIA - Research AI Assistant
Ask RIA
