Hydrogen Sulfide (H2S) Scavenger Market Analysis, Size, and Forecast 2026-2030: North America (US, Canada, and Mexico), APAC (China, Japan, and India), Europe (Germany, UK, and France), Middle East and Africa (Saudi Arabia, UAE, and South Africa), South America (Brazil, Argentina, and Colombia), and Rest of World (ROW)

Hydrogen Sulfide (H2S) Scavenger Market Analysis, Size, and Forecast 2026-2030:
North America (US, Canada, and Mexico), APAC (China, Japan, and India), Europe (Germany, UK, and France), Middle East and Africa (Saudi Arabia, UAE, and South Africa), South America (Brazil, Argentina, and Colombia), and Rest of World (ROW)

Published: Apr 2026 300 Pages SKU: IRTNTR44047

Market Overview at a Glance

$273.4 Mn
Market Opportunity
3.3%
CAGR 2025 - 2030
37.7%
North America Growth
$977.8 Mn
Oil and gas segment 2024

Hydrogen Sulfide (H2S) Scavenger Market Size 2026-2030

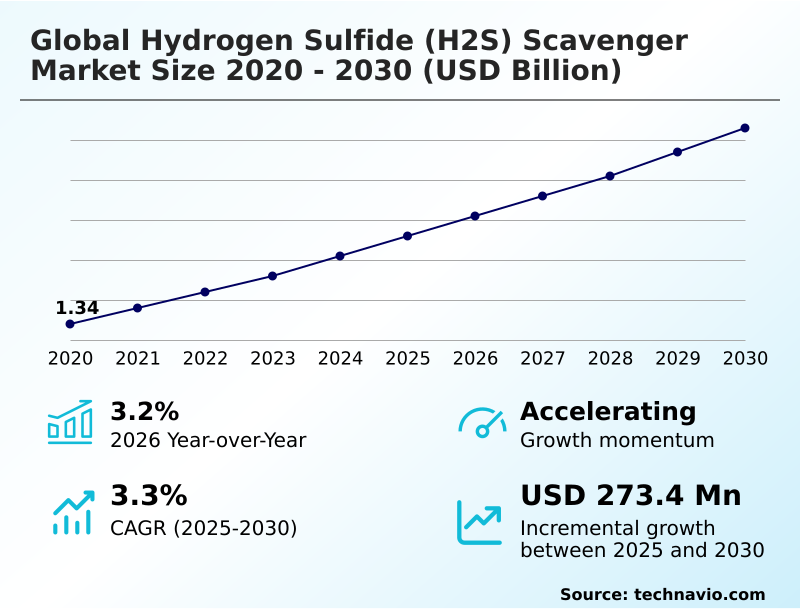
The hydrogen sulfide (h2s) scavenger market size is valued to increase by USD 273.4 million, at a CAGR of 3.3% from 2025 to 2030. Rising production of sour crude and natural gas in mature and unconventional reservoirs will drive the hydrogen sulfide (h2s) scavenger market.

Major Market Trends & Insights

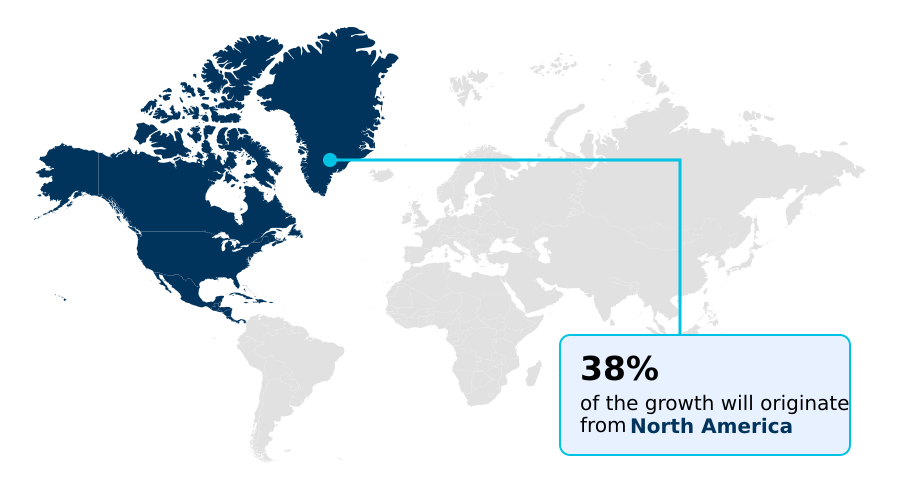
  • North America dominated the market and accounted for a 37.7% growth during the forecast period.
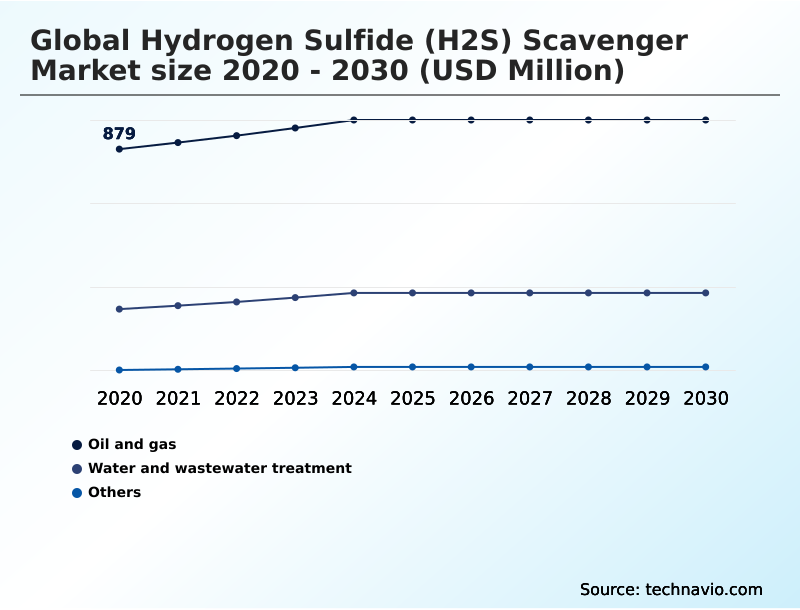
  • By End-user - Oil and gas segment was valued at USD 977.8 million in 2024
  • By Type - Non-regenerative segment accounted for the largest market revenue share in 2024

Market Size & Forecast

  • Market Opportunities: USD 485.8 million
  • Market Future Opportunities: USD 273.4 million
  • CAGR from 2025 to 2030 : 3.3%

Market Summary

  • The Hydrogen Sulfide (H2S) Scavenger Market is undergoing a significant transformation, driven by the dual pressures of exploiting more challenging hydrocarbon reserves and adhering to stricter environmental regulations. As easily accessible sweet crude and gas sources diminish, operators globally are increasingly reliant on chemical solutions to manage the corrosive and toxic effects of H2S.
  • This necessity fuels innovation in both regenerative and non-regenerative scavenger technologies. Key trends include the integration of digital monitoring and automated dosing systems, which optimize chemical usage and reduce operational costs.
  • For instance, a midstream operator can leverage real-time sensor data to precisely inject scavengers, preventing pipeline blockages from solid byproducts and ensuring compliance with safety standards, thereby enhancing asset integrity. The market is also expanding beyond its traditional oil and gas stronghold into emerging sectors like biogas upgrading and wastewater treatment, where odor and corrosion control are paramount.
  • However, challenges related to the disposal of spent chemical byproducts and the technical limitations of certain formulations in extreme conditions persist, pushing the industry toward developing more sustainable and efficient solutions.

What will be the Size of the Hydrogen Sulfide (H2S) Scavenger Market during the forecast period?

Get Key Insights on Market Forecast (PDF) Request Free Sample

How is the Hydrogen Sulfide (H2S) Scavenger Market Segmented?

The hydrogen sulfide (h2s) scavenger industry research report provides comprehensive data (region-wise segment analysis), with forecasts and estimates in "USD million" for the period 2026-2030, as well as historical data from 2020-2024 for the following segments.

  • End-user
    • Oil and gas
    • Water and wastewater treatment
    • Others
  • Type
    • Non-regenerative
    • Regenerative
  • Application
    • Onshore
    • Offshore
  • Geography
    • North America
      • US
      • Canada
      • Mexico
    • APAC
      • China
      • Japan
      • India
    • Europe
      • Germany
      • UK
      • France
    • Middle East and Africa
      • Saudi Arabia
      • UAE
      • South Africa
    • South America
      • Brazil
      • Argentina
      • Colombia
    • Rest of World (ROW)

By End-user Insights

The oil and gas segment is estimated to witness significant growth during the forecast period.

The oil and gas sector is the principal end-user, with demand driven by the need to exploit sour reserves. Effective pipeline integrity management relies on sophisticated corrosion mitigation chemicals to counter the effects of hydrogen sulfide.

In unconventional shale plays, operators are implementing automated dosing systems and non-regenerative scavengers to manage fluctuating sulfide levels.

A key development is the use of AI-powered platforms with virtual flow meters to reduce chemical over-treatment by nearly 20%, enhancing production chemical optimization.

This digital approach to sour gas treatment prevents equipment damage and ensures operational continuity, particularly in high-pressure high-temperature applications, and aids in the overall total cost of ownership reduction.

Request Free Sample

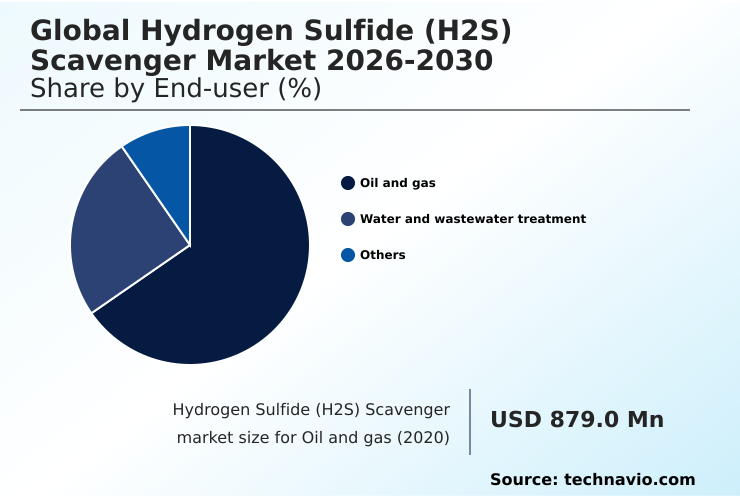
The Oil and gas segment was valued at USD 977.8 million in 2024 and showed a gradual increase during the forecast period.

Request Free Sample

Regional Analysis

North America is estimated to contribute 37.7% to the growth of the global market during the forecast period.Technavio’s analysts have elaborately explained the regional trends and drivers that shape the market during the forecast period.

See How Hydrogen Sulfide (H2S) Scavenger Market Demand is Rising in North America Request Free Sample

The geographic landscape is characterized by distinct regional dynamics. North America accounts for the largest market share, approximately 37.75% of the incremental growth, driven by its vast unconventional shale resources that require robust biogas upgrading and wastewater treatment chemicals.

The APAC region is the fastest-growing, contributing 32.52%, fueled by massive investments in natural gas infrastructure and municipal projects demanding effective odor control chemicals. The Middle East and Africa remain critical due to large-scale sour gas treatment operations.

In Europe, the focus is on green chemistry principles and sustainability, leading the adoption of advanced solutions for renewable natural gas (rng) treatment and adherence to strict regulations, reflecting a global need for specialized geothermal steam treatment technologies.

Market Dynamics

Our researchers analyzed the data with 2025 as the base year, along with the key drivers, trends, and challenges. A holistic analysis of drivers will help companies refine their marketing strategies to gain a competitive advantage.

  • Strategic decision-making in the Hydrogen Sulfide (H2S) Scavenger Market is increasingly nuanced, focusing on specialized applications and total lifecycle costs. The selection of an h2s scavenger for shale gas operations, for instance, differs significantly from choosing a non-triazine scavenger for offshore platforms, where subsea integrity is paramount.
  • A key consideration is the cost of spent scavenger disposal, which can be substantial and influences the choice between regenerative vs non-regenerative scavengers. Companies are now automating h2s chemical injection systems to mitigate these expenses and avoid performance issues.
  • The growing market for h2s removal in biogas upgrading is driving demand for chemistries that are effective even in high-CO2 gas streams. Success hinges on preventing dithiazine solids formation and developing eco-friendly h2s scavenger formulations. New frontiers include h2s treatment in geothermal plants and advanced odor control in wastewater networks.
  • Ultimately, the choice of specialty chemicals for sour gas must balance immediate efficacy with long-term operational impacts, such as improving scavenger reaction kinetics while reducing scavenger over-injection risks.
  • Optimized scavenger selection for sour crude is no longer just a chemical decision but a strategic one that directly impacts operational budgets, where advanced systems can lower total treatment costs by over 15% compared to traditional, unmonitored approaches.
  • This is crucial for h2s management in lng facilities and ensuring corrosion prevention in refining units, while meeting regulatory compliance for h2s scavengers and managing the impact of h2s on pipeline infrastructure.

What are the key market drivers leading to the rise in the adoption of Hydrogen Sulfide (H2S) Scavenger Industry?

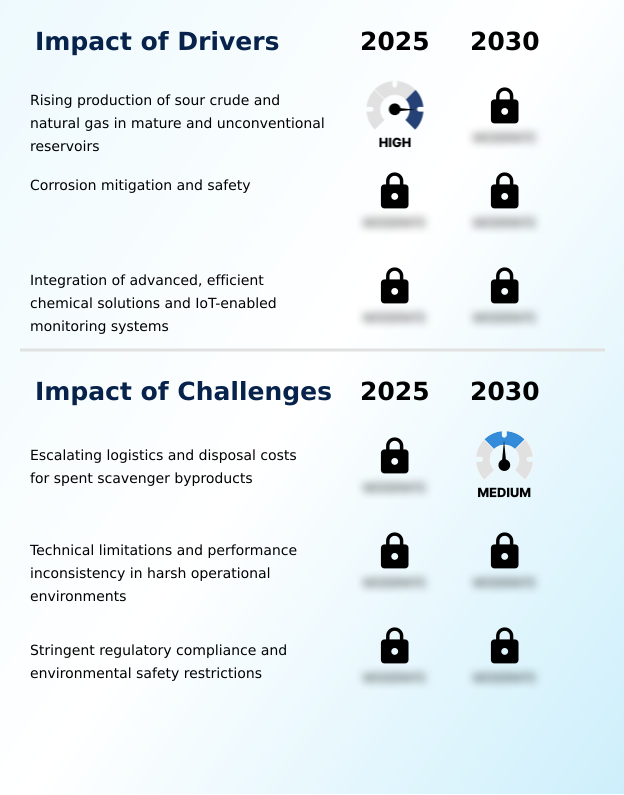
  • The market is primarily driven by the rising production of sour crude and natural gas, which necessitates advanced chemical solutions for corrosion mitigation and safety compliance.

  • The increasing exploitation of sour gas reserves is a primary driver, compelling operators to adopt advanced solutions for infrastructure preservation and workforce protection standards.
  • The need for effective industrial gas purification is critical in preventing sulfide stress cracking and ensuring the safety of cryogenic heat exchangers in liquefied natural gas (lng) purification.
  • Implementing proactive corrosion mitigation chemicals has been shown to reduce unscheduled maintenance shutdowns by up to 25%.
  • Furthermore, technological convergence is enabling the use of cloud-based analytics to optimize industrial sulfur management across vast networks, with some operators seeing a 30% reduction in performance loss in harsh environments by using regenerative systems and adhering to updated occupational hygiene guidelines.

What are the market trends shaping the Hydrogen Sulfide (H2S) Scavenger Industry?

  • The market is witnessing a significant shift toward the integration of AI-driven digital chemical management. This includes the adoption of automated dosing systems to optimize operational precision.

  • A prominent market trend is the move toward digital chemical management, where real-time h2s monitoring informs sophisticated chemical injection systems. This transition helps mitigate issues tied to triazine-based scavengers, such as the formation of unwanted solids. Advanced liquid redox catalysts are gaining traction in the rapidly expanding renewable natural gas (rng) treatment sector, aligning with circular economy objectives.
  • For instance, some hybrid systems achieve the ultra-low sulfur levels needed for gas-to-grid injection, a process where efficiency has improved by over 15%. This focus on high-performance non-triazine formulations and low-toxicity formulations reflects a broader industry push for greater sustainability and asset integrity management.

What challenges does the Hydrogen Sulfide (H2S) Scavenger Industry face during its growth?

  • A key market challenge stems from the escalating logistics and disposal costs associated with spent scavenger byproducts, which are increasingly classified as hazardous waste.

  • A significant challenge is the rising cost of spent scavenger disposal, as byproducts are re-classified as hazardous waste, with disposal fees increasing substantially. Logistical complexities are compounded by the technical limitations of conventional non-regenerative scavengers in high-pressure high-temperature applications, where field audits show performance losses of around 30%.
  • The risk of over-dosing can lead to the formation of dithiazine solids, compromising subsea flowline integrity. Stricter environmental safety standards and the need for downstream processing compatibility are forcing a shift towards biodegradable scavengers and advanced chemistries, even though compliance costs can account for nearly 25% of the total challenge profile for some firms.

Exclusive Technavio Analysis on Customer Landscape

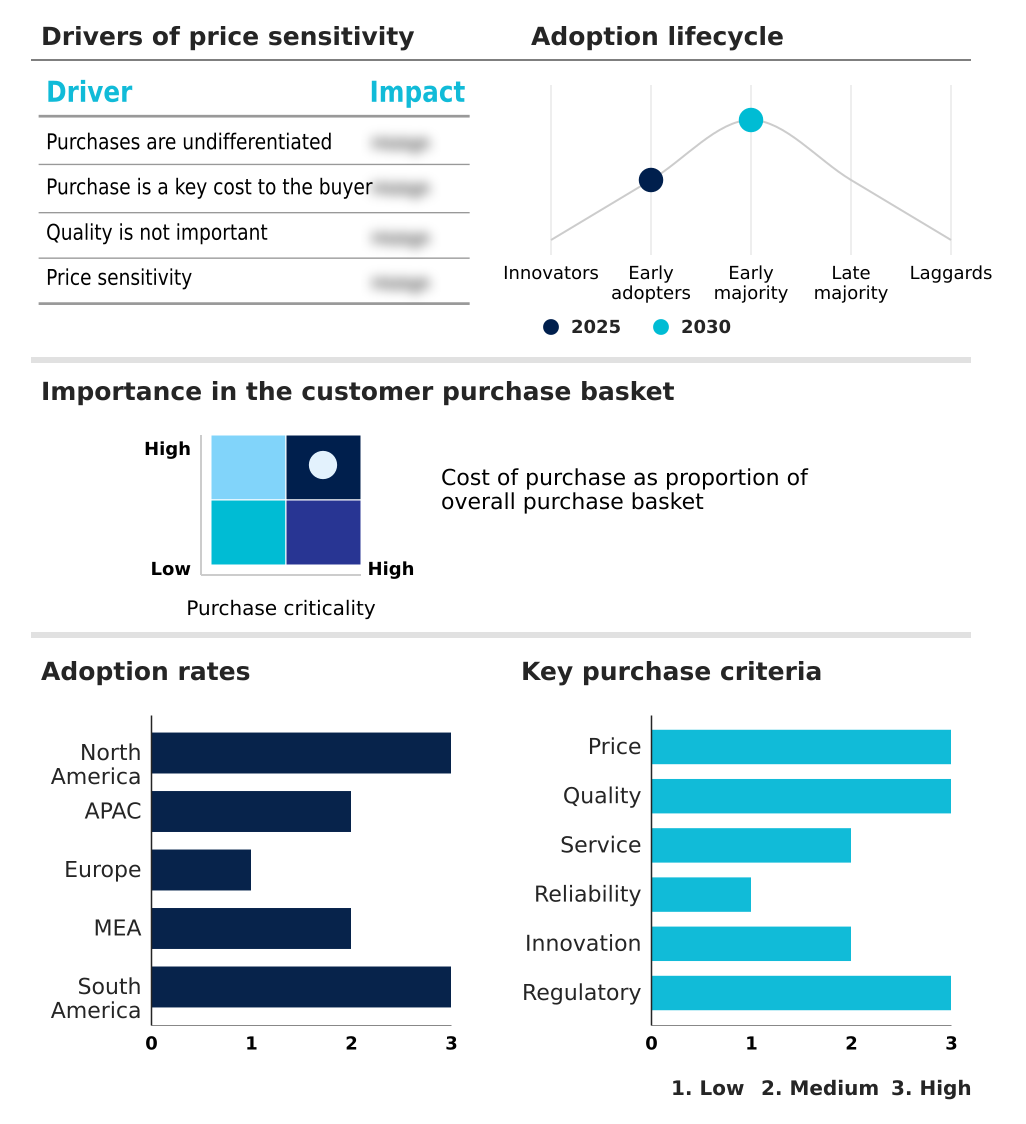
The hydrogen sulfide (h2s) scavenger market forecasting report includes the adoption lifecycle of the market, covering from the innovator’s stage to the laggard’s stage. It focuses on adoption rates in different regions based on penetration. Furthermore, the hydrogen sulfide (h2s) scavenger market report also includes key purchase criteria and drivers of price sensitivity to help companies evaluate and develop their market growth analysis strategies.

Customer Landscape of Hydrogen Sulfide (H2S) Scavenger Industry

Competitive Landscape

Companies are implementing various strategies, such as strategic alliances, hydrogen sulfide (h2s) scavenger market forecast, partnerships, mergers and acquisitions, geographical expansion, and product/service launches, to enhance their presence in the industry.

Arkema Group - Offers specialized hydrogen sulfide (H2S) scavenger chemistries, including triazine-based solutions, designed for natural gas processing and refinery desulfurization applications.

The industry research and growth report includes detailed analyses of the competitive landscape of the market and information about key companies, including:

  • Arkema Group
  • Baker Hughes Co.
  • BASF SE
  • Cestoil Chemical Inc.
  • Chevron Phillips Chemical Co.
  • Clariant International Ltd.
  • Dow Chemical Co.
  • Ecolab Inc.
  • Halliburton Co.
  • Hexion Inc.
  • Imperial Chemicals Pvt. Ltd.
  • Kemira Oyj
  • Merichem Co.
  • Newpoint Gas LLC
  • Nouryon Chemicals Holding B.V.
  • Schlumberger Ltd.
  • SNF Group
  • Solvay SA
  • The Lubrizol Corp.
  • Thermax Ltd.
  • Venus Ethoxyethers Pvt. Ltd.
  • Vink Chemicals GmbH and Co. KG

Qualitative and quantitative analysis of companies has been conducted to help clients understand the wider business environment as well as the strengths and weaknesses of key industry players. Data is qualitatively analyzed to categorize companies as pure play, category-focused, industry-focused, and diversified; it is quantitatively analyzed to categorize companies as dominant, leading, strong, tentative, and weak.

Recent Development and News in Hydrogen sulfide (h2s) scavenger market

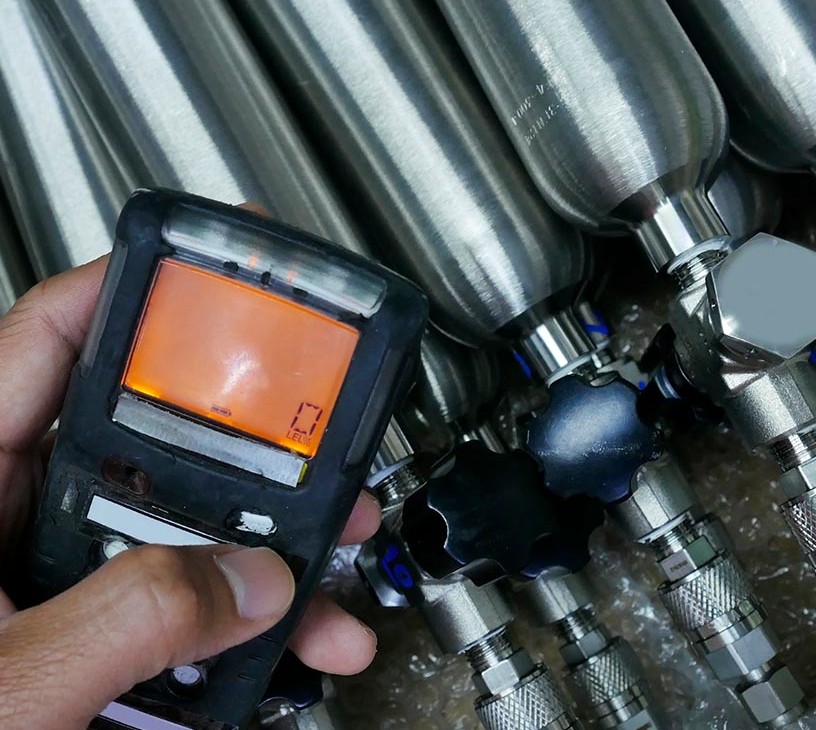
  • In June 2025, Baker Hughes Co. advanced the market by introducing AI-powered features into its Leucipa automated field production platform, enabling autonomous, real-time dosing of H2S scavengers.
  • In March 2025, operators in North Africa commenced operations at the Chadar field, emphasizing the global trend of managing elevated sulfur levels at the point of extraction to prevent corrosion.
  • In January 2026, ADNOC Sour Gas implemented enhanced real-time H2S safety and detection systems across its facilities, which handle over one billion cubic feet of sour gas daily, highlighting a move toward integrated safety and chemical scavenging.
  • In January 2026, the Namami Gange Mission Phase II in India marked a milestone with the commissioning of major sewerage infrastructure projects, driving demand for H2S scavengers for odor control and asset protection.

Dive into Technavio’s robust research methodology, blending expert interviews, extensive data synthesis, and validated models for unparalleled Hydrogen Sulfide (H2S) Scavenger Market insights. See full methodology.

Market Scope
Page number 300
Base year 2025
Historic period 2020-2024
Forecast period 2026-2030
Growth momentum & CAGR Accelerate at a CAGR of 3.3%
Market growth 2026-2030 USD 273.4 million
Market structure Fragmented
YoY growth 2025-2026(%) 3.2%
Key countries US, Canada, Mexico, China, Japan, India, South Korea, Australia, Indonesia, Germany, UK, France, Italy, Spain, The Netherlands, Saudi Arabia, UAE, South Africa, Nigeria, Egypt, Brazil, Argentina and Colombia
Competitive landscape Leading Companies, Market Positioning of Companies, Competitive Strategies, and Industry Risks

Request Free Sample

Research Analyst Overview

  • The Hydrogen Sulfide (H2S) Scavenger Market is defined by a technological pivot towards precision and sustainability, driven by operational necessities in upstream and midstream sectors. The industry is moving beyond conventional triazine-based scavengers to adopt advanced non-triazine formulations and regenerative systems, especially for large-scale sour gas treatment and crude oil desulfurization.
  • This shift addresses the persistent issue of dithiazine solids formation, which compromises infrastructure. A critical development is the deployment of automated dosing systems integrated with real-time h2s monitoring, a strategy proven to reduce chemical over-treatment by nearly 20%. This directly impacts boardroom decisions on operational expenditure and asset lifecycle management.
  • Demand is also expanding into new verticals like biogas upgrading, geothermal steam treatment, and wastewater treatment chemicals, which require specialized odor control chemicals. Formulators are focused on complying with stringent environmental safety standards, leading to innovation in solid-bed media and liquid redox catalysts.
  • This evolution ensures effective pipeline integrity management, hydrogen-induced cracking prevention, and efficient industrial gas purification, all while managing the complexities of spent scavenger disposal and the need for effective chemical injection systems in high-pressure high-temperature applications.

What are the Key Data Covered in this Hydrogen Sulfide (H2S) Scavenger Market Research and Growth Report?

  • What is the expected growth of the Hydrogen Sulfide (H2S) Scavenger Market between 2026 and 2030?

    • USD 273.4 million, at a CAGR of 3.3%

  • What segmentation does the market report cover?

    • The report is segmented by End-user (Oil and gas, Water and wastewater treatment, and Others), Type (Non-regenerative, and Regenerative), Application (Onshore, and Offshore) and Geography (North America, APAC, Europe, Middle East and Africa, South America)

  • Which regions are analyzed in the report?

    • North America, APAC, Europe, Middle East and Africa and South America

  • What are the key growth drivers and market challenges?

    • Rising production of sour crude and natural gas in mature and unconventional reservoirs, Escalating logistics and disposal costs for spent scavenger byproducts

  • Who are the major players in the Hydrogen Sulfide (H2S) Scavenger Market?

    • Arkema Group, Baker Hughes Co., BASF SE, Cestoil Chemical Inc., Chevron Phillips Chemical Co., Clariant International Ltd., Dow Chemical Co., Ecolab Inc., Halliburton Co., Hexion Inc., Imperial Chemicals Pvt. Ltd., Kemira Oyj, Merichem Co., Newpoint Gas LLC, Nouryon Chemicals Holding B.V., Schlumberger Ltd., SNF Group, Solvay SA, The Lubrizol Corp., Thermax Ltd., Venus Ethoxyethers Pvt. Ltd. and Vink Chemicals GmbH and Co. KG

Market Research Insights

  • The market's dynamics are shaped by a strategic pivot toward efficiency and sustainability, driven by the need for enhanced asset integrity management. The integration of digital chemical management platforms has led to significant operational gains, with some pilot programs demonstrating a reduction in chemical overtreatment by nearly 20%.
  • Concurrently, tightening regulations for refinery emission control are accelerating the adoption of low-toxicity formulations and biodegradable scavengers. While green chemistry principles guide new product development, performance inconsistencies remain a hurdle, as field audits reveal that approximately 30% of conventional scavenging programs experience performance loss in extreme conditions.
  • This creates a complex landscape where companies must balance cost, compliance, and reliability to achieve total cost of ownership reduction.

We can help! Our analysts can customize this hydrogen sulfide (h2s) scavenger market research report to meet your requirements.

Get in touch

1. Executive Summary

1.1 Market overview

Executive Summary - Chart on Market Overview
Executive Summary - Data Table on Market Overview
Executive Summary - Chart on Global Market Characteristics
Executive Summary - Chart on Market by Geography
Executive Summary - Chart on Market Segmentation by End-user
Executive Summary - Chart on Market Segmentation by Type
Executive Summary - Chart on Market Segmentation by Application
Executive Summary - Chart on Incremental Growth
Executive Summary - Data Table on Incremental Growth
Executive Summary - Chart on Company Market Positioning

2. Technavio Analysis

2.1 Analysis of price sensitivity, lifecycle, customer purchase basket, adoption rates, and purchase criteria

2.2 Criticality of inputs and Factors of differentiation

Chart on Overview on criticality of inputs and factors of differentiation

2.3 Factors of disruption

Chart on Overview on factors of disruption

2.4 Impact of drivers and challenges

Chart on Impact of drivers and challenges in 2025 and 2030

3. Market Landscape

3.1 Market ecosystem

Chart on Parent Market
Data Table on - Parent Market

3.2 Market characteristics

Chart on Market characteristics analysis

3.3 Value chain analysis

Chart on Value chain analysis

4. Market Sizing

4.1 Market definition

Data Table on Offerings of companies included in the market definition

4.2 Market segment analysis

Market segments

4.3 Market size 2025

4.4 Market outlook: Forecast for 2025-2030

Chart on Global - Market size and forecast 2025-2030 ($ million)
Data Table on Global - Market size and forecast 2025-2030 ($ million)
Chart on Global Market: Year-over-year growth 2025-2030 (%)
Data Table on Global Market: Year-over-year growth 2025-2030 (%)

5. Historic Market Size

5.1 Global Hydrogen Sulfide (H2S) Scavenger Market 2020 - 2024

Historic Market Size - Data Table on Global Hydrogen Sulfide (H2S) Scavenger Market 2020 - 2024 ($ million)

5.2 End-user segment analysis 2020 - 2024

Historic Market Size - End-user Segment 2020 - 2024 ($ million)

5.3 Type segment analysis 2020 - 2024

Historic Market Size - Type Segment 2020 - 2024 ($ million)

5.4 Application segment analysis 2020 - 2024

Historic Market Size - Application Segment 2020 - 2024 ($ million)

5.5 Geography segment analysis 2020 - 2024

Historic Market Size - Geography Segment 2020 - 2024 ($ million)

5.6 Country segment analysis 2020 - 2024

Historic Market Size - Country Segment 2020 - 2024 ($ million)

6. Qualitative Analysis

6.1 Impact of AI on Global Hydrogen Sulfide (H2S) Scavenger Market

6.2 Impact of Geopolitical Conflict on Global Hydrogen Sulfide (H2S) Scavengers Market

7. Five Forces Analysis

7.1 Five forces summary

Five forces analysis - Comparison between 2025 and 2030

7.2 Bargaining power of buyers

Bargaining power of buyers - Impact of key factors 2025 and 2030

7.3 Bargaining power of suppliers

Bargaining power of suppliers - Impact of key factors in 2025 and 2030

7.4 Threat of new entrants

Threat of new entrants - Impact of key factors in 2025 and 2030

7.5 Threat of substitutes

Threat of substitutes - Impact of key factors in 2025 and 2030

7.6 Threat of rivalry

Threat of rivalry - Impact of key factors in 2025 and 2030

7.7 Market condition

Chart on Market condition - Five forces 2025 and 2030

8. Market Segmentation by End-user

8.1 Market segments

Chart on End-user - Market share 2025-2030 (%)
Data Table on End-user - Market share 2025-2030 (%)

8.2 Comparison by End-user

Chart on Comparison by End-user
Data Table on Comparison by End-user

8.3 Oil and gas - Market size and forecast 2025-2030

Chart on Oil and gas - Market size and forecast 2025-2030 ($ million)
Data Table on Oil and gas - Market size and forecast 2025-2030 ($ million)
Chart on Oil and gas - Year-over-year growth 2025-2030 (%)
Data Table on Oil and gas - Year-over-year growth 2025-2030 (%)

8.4 Water and wastewater treatment - Market size and forecast 2025-2030

Chart on Water and wastewater treatment - Market size and forecast 2025-2030 ($ million)
Data Table on Water and wastewater treatment - Market size and forecast 2025-2030 ($ million)
Chart on Water and wastewater treatment - Year-over-year growth 2025-2030 (%)
Data Table on Water and wastewater treatment - Year-over-year growth 2025-2030 (%)

8.5 Others - Market size and forecast 2025-2030

Chart on Others - Market size and forecast 2025-2030 ($ million)
Data Table on Others - Market size and forecast 2025-2030 ($ million)
Chart on Others - Year-over-year growth 2025-2030 (%)
Data Table on Others - Year-over-year growth 2025-2030 (%)

8.6 Market opportunity by End-user

Market opportunity by End-user ($ million)
Data Table on Market opportunity by End-user ($ million)

9. Market Segmentation by Type

9.1 Market segments

Chart on Type - Market share 2025-2030 (%)
Data Table on Type - Market share 2025-2030 (%)

9.2 Comparison by Type

Chart on Comparison by Type
Data Table on Comparison by Type

9.3 Non-regenerative - Market size and forecast 2025-2030

Chart on Non-regenerative - Market size and forecast 2025-2030 ($ million)
Data Table on Non-regenerative - Market size and forecast 2025-2030 ($ million)
Chart on Non-regenerative - Year-over-year growth 2025-2030 (%)
Data Table on Non-regenerative - Year-over-year growth 2025-2030 (%)

9.4 Regenerative - Market size and forecast 2025-2030

Chart on Regenerative - Market size and forecast 2025-2030 ($ million)
Data Table on Regenerative - Market size and forecast 2025-2030 ($ million)
Chart on Regenerative - Year-over-year growth 2025-2030 (%)
Data Table on Regenerative - Year-over-year growth 2025-2030 (%)

9.5 Market opportunity by Type

Market opportunity by Type ($ million)
Data Table on Market opportunity by Type ($ million)

10. Market Segmentation by Application

10.1 Market segments

Chart on Application - Market share 2025-2030 (%)
Data Table on Application - Market share 2025-2030 (%)

10.2 Comparison by Application

Chart on Comparison by Application
Data Table on Comparison by Application

10.3 Onshore - Market size and forecast 2025-2030

Chart on Onshore - Market size and forecast 2025-2030 ($ million)
Data Table on Onshore - Market size and forecast 2025-2030 ($ million)
Chart on Onshore - Year-over-year growth 2025-2030 (%)
Data Table on Onshore - Year-over-year growth 2025-2030 (%)

10.4 Offshore - Market size and forecast 2025-2030

Chart on Offshore - Market size and forecast 2025-2030 ($ million)
Data Table on Offshore - Market size and forecast 2025-2030 ($ million)
Chart on Offshore - Year-over-year growth 2025-2030 (%)
Data Table on Offshore - Year-over-year growth 2025-2030 (%)

10.5 Market opportunity by Application

Market opportunity by Application ($ million)
Data Table on Market opportunity by Application ($ million)

11. Customer Landscape

11.1 Customer landscape overview

Analysis of price sensitivity, lifecycle, customer purchase basket, adoption rates, and purchase criteria

12. Geographic Landscape

12.1 Geographic segmentation

Chart on Market share by geography 2025-2030 (%)
Data Table on Market share by geography 2025-2030 (%)

12.2 Geographic comparison

Chart on Geographic comparison
Data Table on Geographic comparison

12.3 North America - Market size and forecast 2025-2030

Chart on North America - Market size and forecast 2025-2030 ($ million)
Data Table on North America - Market size and forecast 2025-2030 ($ million)
Chart on North America - Year-over-year growth 2025-2030 (%)
Data Table on North America - Year-over-year growth 2025-2030 (%)
Chart on Regional Comparison - North America
Data Table on Regional Comparison - North America

12.3.1 US - Market size and forecast 2025-2030

Chart on US - Market size and forecast 2025-2030 ($ million)
Data Table on US - Market size and forecast 2025-2030 ($ million)
Chart on US - Year-over-year growth 2025-2030 (%)
Data Table on US - Year-over-year growth 2025-2030 (%)

12.3.2 Canada - Market size and forecast 2025-2030

Chart on Canada - Market size and forecast 2025-2030 ($ million)
Data Table on Canada - Market size and forecast 2025-2030 ($ million)
Chart on Canada - Year-over-year growth 2025-2030 (%)
Data Table on Canada - Year-over-year growth 2025-2030 (%)

12.3.3 Mexico - Market size and forecast 2025-2030

Chart on Mexico - Market size and forecast 2025-2030 ($ million)
Data Table on Mexico - Market size and forecast 2025-2030 ($ million)
Chart on Mexico - Year-over-year growth 2025-2030 (%)
Data Table on Mexico - Year-over-year growth 2025-2030 (%)

12.4 APAC - Market size and forecast 2025-2030

Chart on APAC - Market size and forecast 2025-2030 ($ million)
Data Table on APAC - Market size and forecast 2025-2030 ($ million)
Chart on APAC - Year-over-year growth 2025-2030 (%)
Data Table on APAC - Year-over-year growth 2025-2030 (%)
Chart on Regional Comparison - APAC
Data Table on Regional Comparison - APAC

12.4.1 China - Market size and forecast 2025-2030

Chart on China - Market size and forecast 2025-2030 ($ million)
Data Table on China - Market size and forecast 2025-2030 ($ million)
Chart on China - Year-over-year growth 2025-2030 (%)
Data Table on China - Year-over-year growth 2025-2030 (%)

12.4.2 Japan - Market size and forecast 2025-2030

Chart on Japan - Market size and forecast 2025-2030 ($ million)
Data Table on Japan - Market size and forecast 2025-2030 ($ million)
Chart on Japan - Year-over-year growth 2025-2030 (%)
Data Table on Japan - Year-over-year growth 2025-2030 (%)

12.4.3 India - Market size and forecast 2025-2030

Chart on India - Market size and forecast 2025-2030 ($ million)
Data Table on India - Market size and forecast 2025-2030 ($ million)
Chart on India - Year-over-year growth 2025-2030 (%)
Data Table on India - Year-over-year growth 2025-2030 (%)

12.4.4 South Korea - Market size and forecast 2025-2030

Chart on South Korea - Market size and forecast 2025-2030 ($ million)
Data Table on South Korea - Market size and forecast 2025-2030 ($ million)
Chart on South Korea - Year-over-year growth 2025-2030 (%)
Data Table on South Korea - Year-over-year growth 2025-2030 (%)

12.4.5 Australia - Market size and forecast 2025-2030

Chart on Australia - Market size and forecast 2025-2030 ($ million)
Data Table on Australia - Market size and forecast 2025-2030 ($ million)
Chart on Australia - Year-over-year growth 2025-2030 (%)
Data Table on Australia - Year-over-year growth 2025-2030 (%)

12.4.6 Indonesia - Market size and forecast 2025-2030

Chart on Indonesia - Market size and forecast 2025-2030 ($ million)
Data Table on Indonesia - Market size and forecast 2025-2030 ($ million)
Chart on Indonesia - Year-over-year growth 2025-2030 (%)
Data Table on Indonesia - Year-over-year growth 2025-2030 (%)

12.5 Europe - Market size and forecast 2025-2030

Chart on Europe - Market size and forecast 2025-2030 ($ million)
Data Table on Europe - Market size and forecast 2025-2030 ($ million)
Chart on Europe - Year-over-year growth 2025-2030 (%)
Data Table on Europe - Year-over-year growth 2025-2030 (%)
Chart on Regional Comparison - Europe
Data Table on Regional Comparison - Europe

12.5.1 Germany - Market size and forecast 2025-2030

Chart on Germany - Market size and forecast 2025-2030 ($ million)
Data Table on Germany - Market size and forecast 2025-2030 ($ million)
Chart on Germany - Year-over-year growth 2025-2030 (%)
Data Table on Germany - Year-over-year growth 2025-2030 (%)

12.5.2 UK - Market size and forecast 2025-2030

Chart on UK - Market size and forecast 2025-2030 ($ million)
Data Table on UK - Market size and forecast 2025-2030 ($ million)
Chart on UK - Year-over-year growth 2025-2030 (%)
Data Table on UK - Year-over-year growth 2025-2030 (%)

12.5.3 France - Market size and forecast 2025-2030

Chart on France - Market size and forecast 2025-2030 ($ million)
Data Table on France - Market size and forecast 2025-2030 ($ million)
Chart on France - Year-over-year growth 2025-2030 (%)
Data Table on France - Year-over-year growth 2025-2030 (%)

12.5.4 Italy - Market size and forecast 2025-2030

Chart on Italy - Market size and forecast 2025-2030 ($ million)
Data Table on Italy - Market size and forecast 2025-2030 ($ million)
Chart on Italy - Year-over-year growth 2025-2030 (%)
Data Table on Italy - Year-over-year growth 2025-2030 (%)

12.5.5 Spain - Market size and forecast 2025-2030

Chart on Spain - Market size and forecast 2025-2030 ($ million)
Data Table on Spain - Market size and forecast 2025-2030 ($ million)
Chart on Spain - Year-over-year growth 2025-2030 (%)
Data Table on Spain - Year-over-year growth 2025-2030 (%)

12.5.6 The Netherlands - Market size and forecast 2025-2030

Chart on The Netherlands - Market size and forecast 2025-2030 ($ million)
Data Table on The Netherlands - Market size and forecast 2025-2030 ($ million)
Chart on The Netherlands - Year-over-year growth 2025-2030 (%)
Data Table on The Netherlands - Year-over-year growth 2025-2030 (%)

12.6 Middle East and Africa - Market size and forecast 2025-2030

Chart on Middle East and Africa - Market size and forecast 2025-2030 ($ million)
Data Table on Middle East and Africa - Market size and forecast 2025-2030 ($ million)
Chart on Middle East and Africa - Year-over-year growth 2025-2030 (%)
Data Table on Middle East and Africa - Year-over-year growth 2025-2030 (%)
Chart on Regional Comparison - Middle East and Africa
Data Table on Regional Comparison - Middle East and Africa

12.6.1 Saudi Arabia - Market size and forecast 2025-2030

Chart on Saudi Arabia - Market size and forecast 2025-2030 ($ million)
Data Table on Saudi Arabia - Market size and forecast 2025-2030 ($ million)
Chart on Saudi Arabia - Year-over-year growth 2025-2030 (%)
Data Table on Saudi Arabia - Year-over-year growth 2025-2030 (%)

12.6.2 UAE - Market size and forecast 2025-2030

Chart on UAE - Market size and forecast 2025-2030 ($ million)
Data Table on UAE - Market size and forecast 2025-2030 ($ million)
Chart on UAE - Year-over-year growth 2025-2030 (%)
Data Table on UAE - Year-over-year growth 2025-2030 (%)

12.6.3 South Africa - Market size and forecast 2025-2030

Chart on South Africa - Market size and forecast 2025-2030 ($ million)
Data Table on South Africa - Market size and forecast 2025-2030 ($ million)
Chart on South Africa - Year-over-year growth 2025-2030 (%)
Data Table on South Africa - Year-over-year growth 2025-2030 (%)

12.6.4 Nigeria - Market size and forecast 2025-2030

Chart on Nigeria - Market size and forecast 2025-2030 ($ million)
Data Table on Nigeria - Market size and forecast 2025-2030 ($ million)
Chart on Nigeria - Year-over-year growth 2025-2030 (%)
Data Table on Nigeria - Year-over-year growth 2025-2030 (%)

12.6.5 Egypt - Market size and forecast 2025-2030

Chart on Egypt - Market size and forecast 2025-2030 ($ million)
Data Table on Egypt - Market size and forecast 2025-2030 ($ million)
Chart on Egypt - Year-over-year growth 2025-2030 (%)
Data Table on Egypt - Year-over-year growth 2025-2030 (%)

12.7 South America - Market size and forecast 2025-2030

Chart on South America - Market size and forecast 2025-2030 ($ million)
Data Table on South America - Market size and forecast 2025-2030 ($ million)
Chart on South America - Year-over-year growth 2025-2030 (%)
Data Table on South America - Year-over-year growth 2025-2030 (%)
Chart on Regional Comparison - South America
Data Table on Regional Comparison - South America

12.7.1 Brazil - Market size and forecast 2025-2030

Chart on Brazil - Market size and forecast 2025-2030 ($ million)
Data Table on Brazil - Market size and forecast 2025-2030 ($ million)
Chart on Brazil - Year-over-year growth 2025-2030 (%)
Data Table on Brazil - Year-over-year growth 2025-2030 (%)

12.7.2 Argentina - Market size and forecast 2025-2030

Chart on Argentina - Market size and forecast 2025-2030 ($ million)
Data Table on Argentina - Market size and forecast 2025-2030 ($ million)
Chart on Argentina - Year-over-year growth 2025-2030 (%)
Data Table on Argentina - Year-over-year growth 2025-2030 (%)

12.7.3 Colombia - Market size and forecast 2025-2030

Chart on Colombia - Market size and forecast 2025-2030 ($ million)
Data Table on Colombia - Market size and forecast 2025-2030 ($ million)
Chart on Colombia - Year-over-year growth 2025-2030 (%)
Data Table on Colombia - Year-over-year growth 2025-2030 (%)

12.8 Market opportunity by geography

Market opportunity by geography ($ million)
Data Tables on Market opportunity by geography ($ million)

13. Drivers, Challenges, and Opportunity

13.1 Market drivers

Rising production of sour crude and natural gas in mature and unconventional reservoirs
Corrosion mitigation and safety
Integration of advanced, efficient chemical solutions and IoT-enabled monitoring systems

13.2 Market challenges

Escalating logistics and disposal costs for spent scavenger byproducts
Technical limitations and performance inconsistency in harsh operational environments
Stringent regulatory compliance and environmental safety restrictions

13.3 Impact of drivers and challenges

Impact of drivers and challenges in 2025 and 2030

13.4 Market opportunities

Integration of AI-driven digital chemical management and automated dosing
Shift toward high-performance non-triazine and eco-friendly formulations
Expansion of tailored scavenging solutions for renewable natural gas and biogas infrastructure

14. Competitive Landscape

14.1 Overview

14.2

Overview on criticality of inputs and factors of differentiation

14.3 Landscape disruption

Overview on factors of disruption

14.4 Industry risks

Impact of key risks on business

15. Competitive Analysis

15.1 Companies profiled

Companies covered

15.2 Company ranking index

15.3 Market positioning of companies

Matrix on companies position and classification

15.4 Arkema Group

Arkema Group - Overview
Arkema Group - Business segments
Arkema Group - Key offerings
Arkema Group - Segment focus
SWOT

15.5 Baker Hughes Co.

Baker Hughes Co. - Overview
Baker Hughes Co. - Business segments
Baker Hughes Co. - Key offerings
Baker Hughes Co. - Segment focus
SWOT

15.6 BASF SE

BASF SE - Overview
BASF SE - Business segments
BASF SE - Key news
BASF SE - Key offerings
BASF SE - Segment focus
SWOT

15.7 Cestoil Chemical Inc.

Cestoil Chemical Inc. - Overview
Cestoil Chemical Inc. - Product / Service
Cestoil Chemical Inc. - Key offerings
SWOT

15.8 Clariant International Ltd.

Clariant International Ltd. - Overview
Clariant International Ltd. - Business segments
Clariant International Ltd. - Key offerings
Clariant International Ltd. - Segment focus
SWOT

15.9 Dow Chemical Co.

Dow Chemical Co. - Overview
Dow Chemical Co. - Business segments
Dow Chemical Co. - Key offerings
Dow Chemical Co. - Segment focus
SWOT

15.10 Ecolab Inc.

Ecolab Inc. - Overview
Ecolab Inc. - Business segments
Ecolab Inc. - Key offerings
Ecolab Inc. - Segment focus
SWOT

15.11 Halliburton Co.

Halliburton Co. - Overview
Halliburton Co. - Business segments
Halliburton Co. - Key news
Halliburton Co. - Key offerings
Halliburton Co. - Segment focus
SWOT

15.12 Hexion Inc.

Hexion Inc. - Overview
Hexion Inc. - Product / Service
Hexion Inc. - Key offerings
SWOT

15.13 Kemira Oyj

Kemira Oyj - Overview
Kemira Oyj - Business segments
Kemira Oyj - Key offerings
Kemira Oyj - Segment focus
SWOT

15.14 Merichem Co.

Merichem Co. - Overview
Merichem Co. - Product / Service
Merichem Co. - Key offerings
SWOT

15.15 Schlumberger Ltd.

Schlumberger Ltd. - Overview
Schlumberger Ltd. - Business segments
Schlumberger Ltd. - Key news
Schlumberger Ltd. - Key offerings
Schlumberger Ltd. - Segment focus
SWOT

15.16 SNF Group

SNF Group - Overview
SNF Group - Product / Service
SNF Group - Key offerings
SWOT

15.17 Solvay SA

Solvay SA - Overview
Solvay SA - Business segments
Solvay SA - Key offerings
Solvay SA - Segment focus
SWOT

15.18 Thermax Ltd.

Thermax Ltd. - Overview
Thermax Ltd. - Business segments
Thermax Ltd. - Key offerings
Thermax Ltd. - Segment focus
SWOT

16. Appendix

16.1 Scope of the report

Market definition
Objectives
Notes and caveats

16.2 Inclusions and exclusions checklist

Inclusions checklist
Exclusions checklist

16.3 Currency conversion rates for US$

16.4 Research methodology

16.5 Data procurement

Information sources

16.6 Data validation

16.7 Validation techniques employed for market sizing

16.8 Data synthesis

16.9 360 degree market analysis

16.10 List of abbreviations

Research Methodology

Technavio presents a detailed picture of the market by way of study, synthesis, and summation of data from multiple sources. The analysts have presented the various facets of the market with a particular focus on identifying the key industry influencers. The data thus presented is comprehensive, reliable, and the result of extensive research, both primary and secondary.

INFORMATION SOURCES

Primary sources

  • Manufacturers and suppliers
  • Channel partners
  • Industry experts
  • Strategic decision makers

Secondary sources

  • Industry journals and periodicals
  • Government data
  • Financial reports of key industry players
  • Historical data
  • Press releases

DATA ANALYSIS

Data Synthesis

  • Collation of data
  • Estimation of key figures
  • Analysis of derived insights

Data Validation

  • Triangulation with data models
  • Reference against proprietary databases
  • Corroboration with industry experts

REPORT WRITING

Qualitative

  • Market drivers
  • Market challenges
  • Market trends
  • Five forces analysis

Quantitative

  • Market size and forecast
  • Market segmentation
  • Geographical insights
  • Competitive landscape

Interested in this report?

Get your sample now to see our research methodology and insights!

Download Now

Frequently Asked Questions

Hydrogen Sulfide (H2S) Scavenger market growth will increase by USD 273.4 million during 2026-2030.

The Hydrogen Sulfide (H2S) Scavenger market is expected to grow at a CAGR of 3.3% during 2026-2030.

Hydrogen Sulfide (H2S) Scavenger market is segmented by End-user (Oil and gas, Water and wastewater treatment, Others) Type (Non-regenerative, Regenerative) Application (Onshore, Offshore)

Arkema Group, Baker Hughes Co., BASF SE, Cestoil Chemical Inc., Chevron Phillips Chemical Co., Clariant International Ltd., Dow Chemical Co., Ecolab Inc., Halliburton Co., Hexion Inc., Imperial Chemicals Pvt. Ltd., Kemira Oyj, Merichem Co., Newpoint Gas LLC, Nouryon Chemicals Holding B.V., Schlumberger Ltd., SNF Group, Solvay SA, The Lubrizol Corp., Thermax Ltd., Venus Ethoxyethers Pvt. Ltd., Vink Chemicals GmbH and Co. KG are a few of the key vendors in the Hydrogen Sulfide (H2S) Scavenger market.

North America will register the highest growth rate of 37.7% among the other regions. Therefore, the Hydrogen Sulfide (H2S) Scavenger market in North America is expected to garner significant business opportunities for the vendors during the forecast period.

US, Canada, Mexico, China, Japan, India, South Korea, Australia, Indonesia, Germany, UK, France, Italy, Spain, The Netherlands, Saudi Arabia, UAE, South Africa, Nigeria, Egypt, Brazil, Argentina, Colombia

  • Rising production of sour crude and natural gas in mature and unconventional reservoirs is the driving factor this market.

The Hydrogen Sulfide (H2S) Scavenger market vendors should focus on grabbing business opportunities from the End-user segment as it accounted for the largest market share in the base year.
RIA - Research AI Assistant
Ask RIA