Germination Kits And Trays Market Analysis, Size, and Forecast 2026-2030: North America (US, Canada, and Mexico), Europe (Germany, UK, and France), APAC (China, India, and Japan), South America (Brazil and Argentina), Middle East and Africa (Saudi Arabia, UAE, and South Africa), and Rest of World (ROW)

Germination Kits And Trays Market Analysis, Size, and Forecast 2026-2030:
North America (US, Canada, and Mexico), Europe (Germany, UK, and France), APAC (China, India, and Japan), South America (Brazil and Argentina), Middle East and Africa (Saudi Arabia, UAE, and South Africa), and Rest of World (ROW)

Published: Apr 2026 293 Pages SKU: IRTNTR71284

Market Overview at a Glance

$241.4 Mn
Market Opportunity
5.8%
CAGR 2025 - 2030
46.1%
North America Growth
$286.6 Mn
Home gardening segment 2024

Germination Kits And Trays Market Size 2026-2030

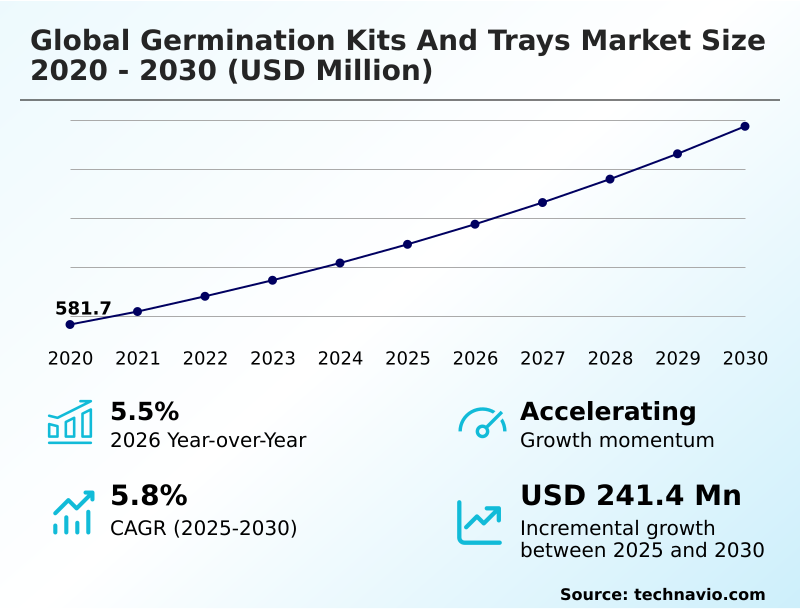
The germination kits and trays market size is valued to increase by USD 241.4 million, at a CAGR of 5.8% from 2025 to 2030. Expansion of controlled environment agriculture and urban farming will drive the germination kits and trays market.

Major Market Trends & Insights

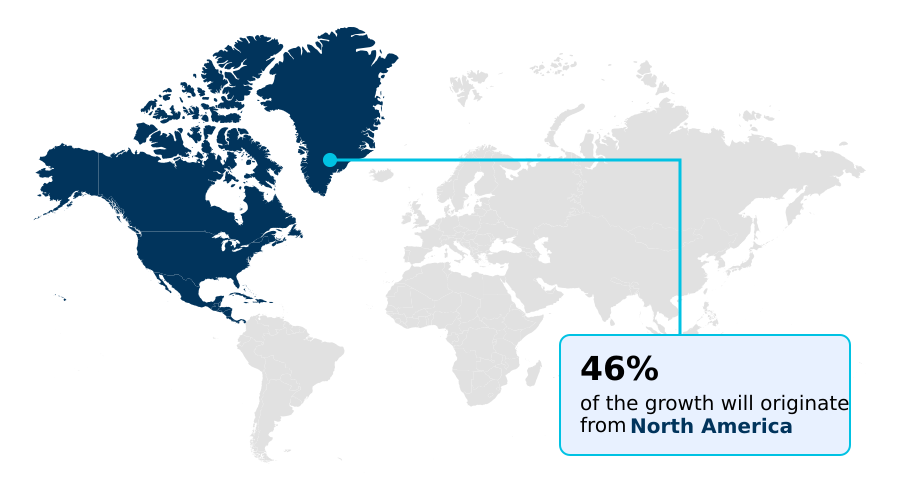
  • North America dominated the market and accounted for a 46.1% growth during the forecast period.
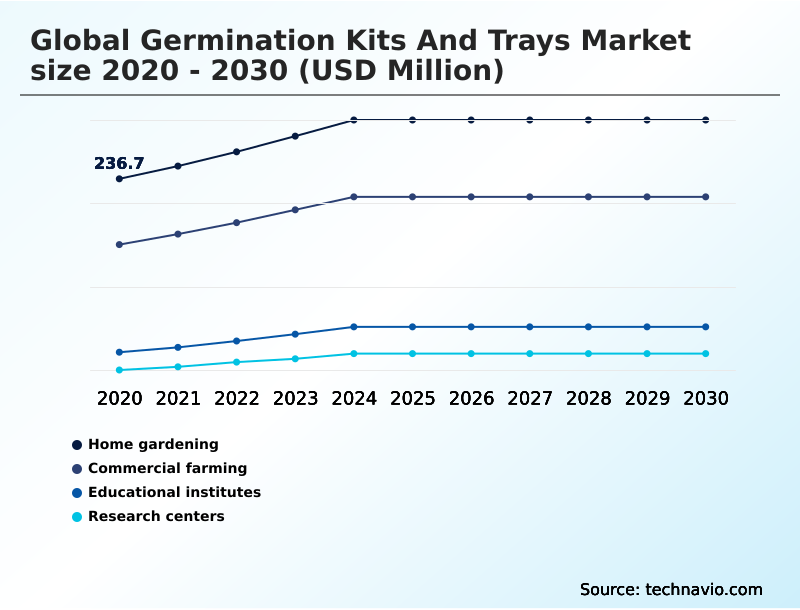
  • By Application - Home gardening segment was valued at USD 286.6 million in 2024
  • By Type - Disposable biodegradable trays segment accounted for the largest market revenue share in 2024

Market Size & Forecast

  • Market Opportunities: USD 405.4 million
  • Market Future Opportunities: USD 241.4 million
  • CAGR from 2025 to 2030 : 5.8%

Market Summary

  • The germination kits and trays market is undergoing a significant transformation, driven by the dual forces of technological innovation and a global push toward sustainable agriculture. A key trend is the integration of digital intelligence into propagation hardware, evolving passive containers into smart systems equipped with sensors for real-time monitoring of moisture and temperature.
  • This shift toward data-driven horticulture allows for granular control, optimizing germination rates. Concurrently, the market is propelled by the expansion of controlled environment agriculture, where high-density, automated systems are essential for meeting food security demands. However, the industry grapples with challenges related to environmental compliance, particularly the management of plastic waste from single-use trays.
  • For instance, a commercial nursery aiming for operational efficiency must balance the high initial cost of durable, reusable trays made from advanced polymers against the lower upfront cost but long-term environmental liability of disposable alternatives, a decision that directly impacts capital expenditure and brand positioning.

What will be the Size of the Germination Kits And Trays Market during the forecast period?

Get Key Insights on Market Forecast (PDF) Request Free Sample

How is the Germination Kits And Trays Market Segmented?

The germination kits and trays industry research report provides comprehensive data (region-wise segment analysis), with forecasts and estimates in "USD million" for the period 2026-2030, as well as historical data from 2020-2024 for the following segments.

  • Application
    • Home gardening
    • Commercial farming
    • Educational institutes
    • Research centers
  • Type
    • Disposable biodegradable trays
    • Reusable trays
  • Distribution channel
    • Online retail
    • Specialty stores
    • Supermarkets
    • Hardware stores
  • Geography
    • North America
      • US
      • Canada
      • Mexico
    • Europe
      • Germany
      • UK
      • France
    • APAC
      • China
      • India
      • Japan
    • South America
      • Brazil
      • Argentina
    • Middle East and Africa
      • Saudi Arabia
      • UAE
      • South Africa
    • Rest of World (ROW)

By Application Insights

The home gardening segment is estimated to witness significant growth during the forecast period.

The home gardening segment reflects a significant cultural shift toward self-sufficiency, driving demand for advanced germination kits and trays. Consumers increasingly seek user-friendly features like self-watering reservoirs and modular stackable tray systems that simplify the complexities of seed starting.

This application is fueled by a desire for organic produce and the growing popularity of urban farming setups. Manufacturers are responding by offering comprehensive bundles with sterilized growth media and precision-engineered cells, which lowers the entry barrier for novice gardeners.

These kits often incorporate eco-friendly gardening solutions and compostable bioplastics, aligning with residential gardening culture.

Integrating data collection nodes into these systems has improved seedling success rates by over 15%, making home cultivation more reliable and appealing to a broader demographic.

Request Free Sample

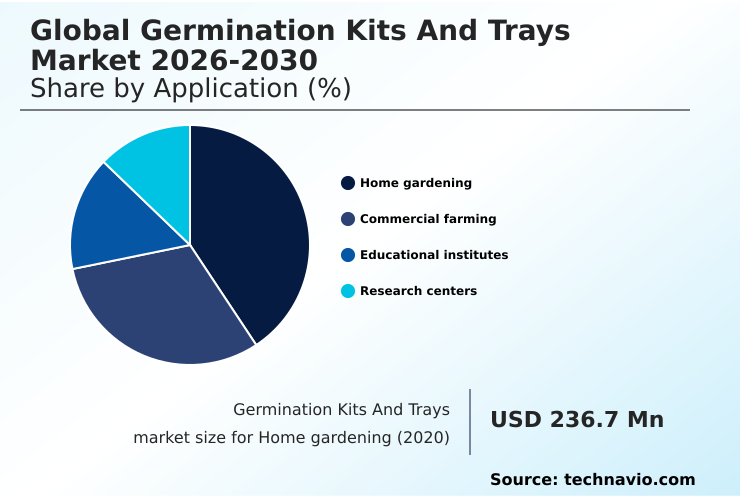
The Home gardening segment was valued at USD 286.6 million in 2024 and showed a gradual increase during the forecast period.

Request Free Sample

Regional Analysis

North America is estimated to contribute 46.1% to the growth of the global market during the forecast period.Technavio’s analysts have elaborately explained the regional trends and drivers that shape the market during the forecast period.

See How Germination Kits And Trays Market Demand is Rising in North America Request Free Sample

The geographic landscape of the market is diverse, with North America leading incremental growth, accounting for 46.1% of the expansion due to its robust residential gardening culture and advanced commercial greenhouse propagation.

This region sees high adoption of heavy-duty propagation systems and controlled environment agriculture equipment. In contrast, Europe's market is heavily influenced by sustainable horticulture practices and peatland ecosystem protection, driving demand for peat-free wood pulp and specialized deep-cell trays.

APAC is a high-growth engine, driven by agricultural modernization programs and food self-sufficiency initiatives.

The use of high-density propagation trays in arid regions of the Middle East, coupled with precision watering, has led to a 25% reduction in water consumption for seedling production.
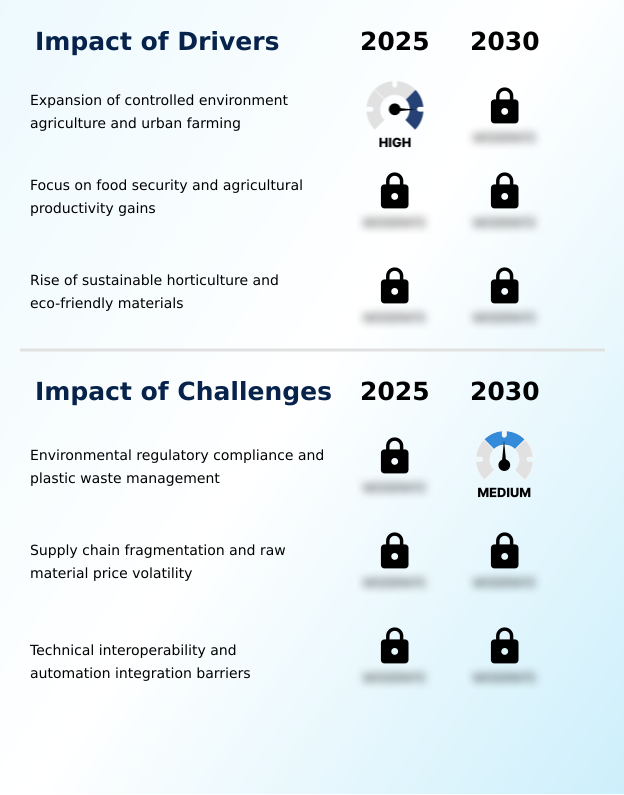
Market Dynamics

Our researchers analyzed the data with 2025 as the base year, along with the key drivers, trends, and challenges. A holistic analysis of drivers will help companies refine their marketing strategies to gain a competitive advantage.

  • The germination kits and trays market is witnessing a significant evolution as growers, from large-scale commercial operations to home gardeners, seek more efficient and sustainable propagation methods. The choice between reusable seedling germination trays for indoor use and single-use options is a key consideration. Innovations like the jiffy-7 pellet greenhouse kit performance highlight the move towards integrated, user-friendly solutions.
  • For commercial farming propagation tray standards, durability and compatibility with automation are paramount, leading to the adoption of heavy-duty propagation trays for nursery automation. The development of hydroponic germination trays for controlled environments caters to the burgeoning vertical farming sector, which demands precise control over the growing process.
  • Meanwhile, consumers are increasingly drawn to the best seed starter tray kits with humidity dome and self-watering seed starter tray systems, which simplify home gardening. There's a growing debate around diy germination kits vs commercial kits, with many opting for the reliability of professionally designed systems.
  • A key driver for innovation is the need for biodegradable trays to eliminate transplant shock, a method that demonstrates a seedling survival rate nearly double that of traditional transplanting methods that disturb root systems. This has spurred the development of eco-friendly alternatives to single-use plastic trays and peat-free substrates for organic gardening.
  • Smart germination kits with temperature monitoring are also gaining traction, offering granular control for optimizing root architecture with air-pruning trays, which is critical when choosing germination kits for high-value crops and seed starting trays for vertical farming.

What are the key market drivers leading to the rise in the adoption of Germination Kits And Trays Industry?

  • The expansion of controlled environment agriculture and urban farming serves as a key driver for the growth of the germination kits and trays market.

  • The market is propelled by the rapid institutionalization of controlled environment agriculture, including vertical farms and high-tech greenhouses. This shift toward hyper-localized, urban indoor farming solutions addresses the declining availability of arable land and enhances food security.
  • Precision propagation techniques are critical in these settings, with specialized germination systems improving plant uniformity by over 30%.
  • Government-led agricultural modernization programs are encouraging the adoption of high-performance germination hardware, which can increase seedling survival rates by 20% compared to traditional direct-seeding methods.
  • This emphasis on resource optimization and higher caloric output per square meter ensures that professional-grade controlled environment agriculture equipment, including high-clearance propagators, remains a foundational element of the global agricultural value chain.

What are the market trends shaping the Germination Kits And Trays Industry?

  • The integration of artificial intelligence with smart monitoring technology is emerging as a significant market trend. This development is poised to influence product innovation and redefine operational standards within the industry.

  • A defining trend is the integration of digital intelligence into propagation hardware, transforming germination kits into data-driven tools. Modern systems are evolving from passive containers into active data collection nodes equipped with sensors for real-time monitoring. This supports hyper-localized food production models by enabling granular control over the growing environment.
  • The use of radio-frequency identification tags on injection-molded seed trays allows for precise tracking, improving inventory management by 25%. This convergence of information technology and horticulture is creating a new category of smart propagation solutions, where data analysis optimizes germination success. Furthermore, this trend reduces reliance on manual assessments by up to 40%, enhancing operational efficiency in commercial settings.

What challenges does the Germination Kits And Trays Industry face during its growth?

  • Adherence to environmental regulatory compliance and the effective management of plastic waste present a key challenge affecting the industry's growth trajectory.

  • A significant challenge is navigating stringent environmental regulations concerning single-use plastics, which have historically dominated the market. The industry's reliance on materials that are difficult to recycle has led to regulatory pressure for a transition to sustainable alternatives.
  • This forces heavy investment in R&D for materials like food-grade polymers and peat-free substrates, which can increase production costs by up to 15%. Another major hurdle is supply chain fragmentation and raw material price volatility, with fluctuations in petrochemical prices directly impacting the cost of UV-stabilized polymers.
  • These factors create an unpredictable cost environment, making long-term pricing strategies for products like reusable silicone kits difficult to maintain and potentially eroding profit margins by 5-10% during periods of instability.

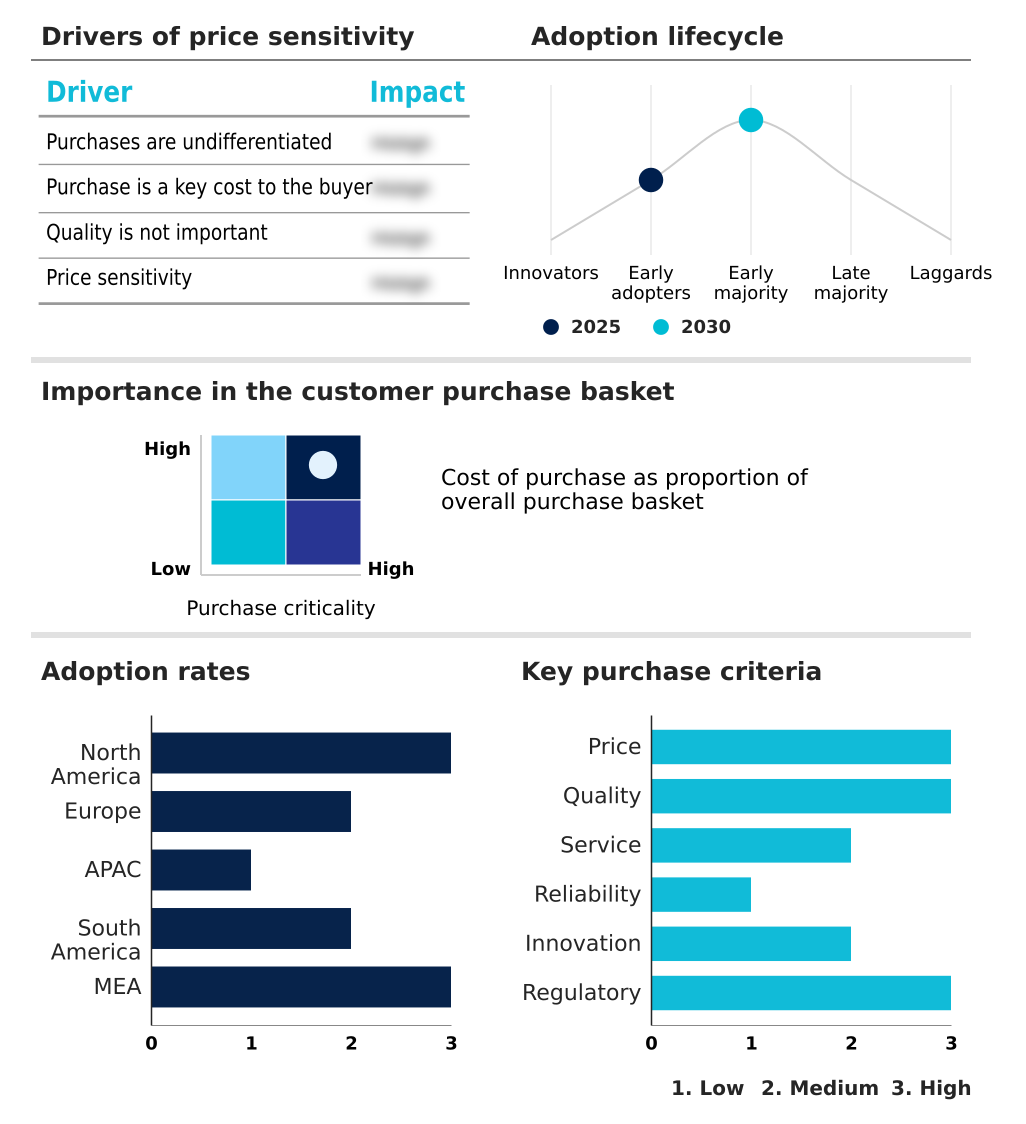
Exclusive Technavio Analysis on Customer Landscape

The germination kits and trays market forecasting report includes the adoption lifecycle of the market, covering from the innovator’s stage to the laggard’s stage. It focuses on adoption rates in different regions based on penetration. Furthermore, the germination kits and trays market report also includes key purchase criteria and drivers of price sensitivity to help companies evaluate and develop their market growth analysis strategies.

Customer Landscape of Germination Kits And Trays Industry

Competitive Landscape

Companies are implementing various strategies, such as strategic alliances, germination kits and trays market forecast, partnerships, mergers and acquisitions, geographical expansion, and product/service launches, to enhance their presence in the industry.

Back to the Roots Inc. - Providers of indoor and outdoor gardening products, offering integrated greenhouse germination seed starter kits and refill systems designed for simplified plant propagation.

The industry research and growth report includes detailed analyses of the competitive landscape of the market and information about key companies, including:

  • Back to the Roots Inc.
  • Gardzen
  • Garland Products Ltd.
  • Hydrofarm LLC
  • Japeto Ltd
  • Jiffy Group
  • Johnnys Selected Seeds
  • Malton Plastics UK Ltd.
  • Namdeo Umaji Agritech I Pvt. Ltd
  • Ningbo Seninger Plastics Co. Ltd.
  • Plants Guru
  • S.V. Agri Tech
  • The Affordable Organic Store
  • The Scotts Miracle Gro Co.
  • W. Atlee Burpee and Co.

Qualitative and quantitative analysis of companies has been conducted to help clients understand the wider business environment as well as the strengths and weaknesses of key industry players. Data is qualitatively analyzed to categorize companies as pure play, category-focused, industry-focused, and diversified; it is quantitatively analyzed to categorize companies as dominant, leading, strong, tentative, and weak.

Recent Development and News in Germination kits and trays market

  • In March 2025, Back to the Roots Inc. announced the expansion of its organic gardening line, supported by a new custom national logistics network designed for direct-to-consumer delivery of gardening components within two days.
  • In January 2025, Garland Products Ltd. introduced thirty new horticultural products, including specialized propagation trays and high-clearance propagators, as part of its anniversary expansion into larger warehouse facilities to improve stock availability.
  • In November 2024, Jiffy Group's Jiffy Gel, a gel-based substrate for high-tech indoor systems, received a Product Innovation Award for its ability to optimize water-to-air ratios and reduce labor in media preparation.
  • In May 2025, The Scotts Miracle Gro Co., in collaboration with Bonnie Plants and Gardenuity, launched the Inspired to Gro Patio Garden Collection, an integrated system combining germination hardware with a guided digital platform for new gardeners.

Dive into Technavio’s robust research methodology, blending expert interviews, extensive data synthesis, and validated models for unparalleled Germination Kits And Trays Market insights. See full methodology.

Market Scope
Page number 293
Base year 2025
Historic period 2020-2024
Forecast period 2026-2030
Growth momentum & CAGR Accelerate at a CAGR of 5.8%
Market growth 2026-2030 USD 241.4 million
Market structure Fragmented
YoY growth 2025-2026(%) 5.5%
Key countries US, Canada, Mexico, Germany, UK, France, Italy, Spain, The Netherlands, China, India, Japan, South Korea, Australia, Indonesia, Brazil, Argentina, Chile, Saudi Arabia, UAE, South Africa, Israel and Turkey
Competitive landscape Leading Companies, Market Positioning of Companies, Competitive Strategies, and Industry Risks

Request Free Sample

Research Analyst Overview

  • The market is at a strategic inflection point, where operational efficiency and sustainability are shaping boardroom decisions on capital expenditure. The adoption of high-density propagation trays and automated seeding lines is critical for large-scale operations to remain competitive, with investments in such technologies improving throughput by over 40%.
  • Concurrently, regulatory pressures are forcing a shift away from traditional plastics toward biodegradable trays and compostable bioplastics. This creates a dichotomy for manufacturers: invest in R&D for innovative peat-free substrates and food-grade polymers, or optimize the production of durable UV-stabilized polymers for heavy-duty propagation systems and reusable silicone kits.
  • The choice impacts not only production costs but also brand positioning and compliance with circular economy principles. This dynamic is further complicated by the need for systems that support root architecture optimization and transplant shock elimination, using components like precision-engineered cells, injection-molded seed trays, and specialized deep-cell trays, all central to the value proposition in controlled environment agriculture equipment.

What are the Key Data Covered in this Germination Kits And Trays Market Research and Growth Report?

  • What is the expected growth of the Germination Kits And Trays Market between 2026 and 2030?

    • USD 241.4 million, at a CAGR of 5.8%

  • What segmentation does the market report cover?

    • The report is segmented by Application (Home gardening, Commercial farming, Educational institutes, and Research centers), Type (Disposable biodegradable trays, and Reusable trays), Distribution Channel (Online retail, Specialty stores, Supermarkets, and Hardware stores) and Geography (North America, Europe, APAC, South America, Middle East and Africa)

  • Which regions are analyzed in the report?

    • North America, Europe, APAC, South America and Middle East and Africa

  • What are the key growth drivers and market challenges?

    • Expansion of controlled environment agriculture and urban farming, Environmental regulatory compliance and plastic waste management

  • Who are the major players in the Germination Kits And Trays Market?

    • Back to the Roots Inc., Gardzen, Garland Products Ltd., Hydrofarm LLC, Japeto Ltd, Jiffy Group, Johnnys Selected Seeds, Malton Plastics UK Ltd., Namdeo Umaji Agritech I Pvt. Ltd, Ningbo Seninger Plastics Co. Ltd., Plants Guru, S.V. Agri Tech, The Affordable Organic Store, The Scotts Miracle Gro Co. and W. Atlee Burpee and Co.

Market Research Insights

  • Market dynamics are shaped by a strategic push toward resource optimization in agriculture, with precision propagation techniques reducing seedling loss by up to 20%. The adoption of smart propagation systems with IoT capabilities allows for data-driven horticulture decisions, improving germination uniformity by 15%.
  • This drive for efficiency is balanced by the need for high-value crop protection and support for reforestation projects. As a result, closed-loop recycling programs are becoming more prevalent. While nursery-based propagation methods are central to agro-ecological transitions, companies must navigate the complexities of enabling year-round cultivation amidst supply chain and raw material volatility.
  • This environment fosters innovation in seed-starting technology, where performance gains are a critical differentiator.

We can help! Our analysts can customize this germination kits and trays market research report to meet your requirements.

Get in touch

1. Executive Summary

1.1 Market overview

Executive Summary - Chart on Market Overview
Executive Summary - Data Table on Market Overview
Executive Summary - Chart on Global Market Characteristics
Executive Summary - Chart on Market by Geography
Executive Summary - Chart on Market Segmentation by Application
Executive Summary - Chart on Market Segmentation by Type
Executive Summary - Chart on Market Segmentation by Distribution Channel
Executive Summary - Chart on Incremental Growth
Executive Summary - Data Table on Incremental Growth
Executive Summary - Chart on Company Market Positioning

2. Technavio Analysis

2.1 Analysis of price sensitivity, lifecycle, customer purchase basket, adoption rates, and purchase criteria

2.2 Criticality of inputs and Factors of differentiation

Chart on Overview on criticality of inputs and factors of differentiation

2.3 Factors of disruption

Chart on Overview on factors of disruption

2.4 Impact of drivers and challenges

Chart on Impact of drivers and challenges in 2025 and 2030

3. Market Landscape

3.1 Market ecosystem

Chart on Parent Market
Data Table on - Parent Market

3.2 Market characteristics

Chart on Market characteristics analysis

3.3 Value chain analysis

Chart on Value chain analysis

4. Market Sizing

4.1 Market definition

Data Table on Offerings of companies included in the market definition

4.2 Market segment analysis

Market segments

4.3 Market size 2025

4.4 Market outlook: Forecast for 2025-2030

Chart on Global - Market size and forecast 2025-2030 ($ million)
Data Table on Global - Market size and forecast 2025-2030 ($ million)
Chart on Global Market: Year-over-year growth 2025-2030 (%)
Data Table on Global Market: Year-over-year growth 2025-2030 (%)

5. Historic Market Size

5.1 Global Germination Kits And Trays Market 2020 - 2024

Historic Market Size - Data Table on Global Germination Kits And Trays Market 2020 - 2024 ($ million)

5.2 Application segment analysis 2020 - 2024

Historic Market Size - Application Segment 2020 - 2024 ($ million)

5.3 Type segment analysis 2020 - 2024

Historic Market Size - Type Segment 2020 - 2024 ($ million)

5.4 Distribution Channel segment analysis 2020 - 2024

Historic Market Size - Distribution Channel Segment 2020 - 2024 ($ million)

5.5 Geography segment analysis 2020 - 2024

Historic Market Size - Geography Segment 2020 - 2024 ($ million)

5.6 Country segment analysis 2020 - 2024

Historic Market Size - Country Segment 2020 - 2024 ($ million)

6. Qualitative Analysis

6.1 Impact of AI on global germination kits and trays market

6.2 Impact of geopolitical conflicts on global germination kits and trays market

7. Five Forces Analysis

7.1 Five forces summary

Five forces analysis - Comparison between 2025 and 2030

7.2 Bargaining power of buyers

Bargaining power of buyers - Impact of key factors 2025 and 2030

7.3 Bargaining power of suppliers

Bargaining power of suppliers - Impact of key factors in 2025 and 2030

7.4 Threat of new entrants

Threat of new entrants - Impact of key factors in 2025 and 2030

7.5 Threat of substitutes

Threat of substitutes - Impact of key factors in 2025 and 2030

7.6 Threat of rivalry

Threat of rivalry - Impact of key factors in 2025 and 2030

7.7 Market condition

Chart on Market condition - Five forces 2025 and 2030

8. Market Segmentation by Application

8.1 Market segments

Chart on Application - Market share 2025-2030 (%)
Data Table on Application - Market share 2025-2030 (%)

8.2 Comparison by Application

Chart on Comparison by Application
Data Table on Comparison by Application

8.3 Home gardening - Market size and forecast 2025-2030

Chart on Home gardening - Market size and forecast 2025-2030 ($ million)
Data Table on Home gardening - Market size and forecast 2025-2030 ($ million)
Chart on Home gardening - Year-over-year growth 2025-2030 (%)
Data Table on Home gardening - Year-over-year growth 2025-2030 (%)

8.4 Commercial farming - Market size and forecast 2025-2030

Chart on Commercial farming - Market size and forecast 2025-2030 ($ million)
Data Table on Commercial farming - Market size and forecast 2025-2030 ($ million)
Chart on Commercial farming - Year-over-year growth 2025-2030 (%)
Data Table on Commercial farming - Year-over-year growth 2025-2030 (%)

8.5 Educational institutes - Market size and forecast 2025-2030

Chart on Educational institutes - Market size and forecast 2025-2030 ($ million)
Data Table on Educational institutes - Market size and forecast 2025-2030 ($ million)
Chart on Educational institutes - Year-over-year growth 2025-2030 (%)
Data Table on Educational institutes - Year-over-year growth 2025-2030 (%)

8.6 Research centers - Market size and forecast 2025-2030

Chart on Research centers - Market size and forecast 2025-2030 ($ million)
Data Table on Research centers - Market size and forecast 2025-2030 ($ million)
Chart on Research centers - Year-over-year growth 2025-2030 (%)
Data Table on Research centers - Year-over-year growth 2025-2030 (%)

8.7 Market opportunity by Application

Market opportunity by Application ($ million)
Data Table on Market opportunity by Application ($ million)

9. Market Segmentation by Type

9.1 Market segments

Chart on Type - Market share 2025-2030 (%)
Data Table on Type - Market share 2025-2030 (%)

9.2 Comparison by Type

Chart on Comparison by Type
Data Table on Comparison by Type

9.3 Disposable biodegradable trays - Market size and forecast 2025-2030

Chart on Disposable biodegradable trays - Market size and forecast 2025-2030 ($ million)
Data Table on Disposable biodegradable trays - Market size and forecast 2025-2030 ($ million)
Chart on Disposable biodegradable trays - Year-over-year growth 2025-2030 (%)
Data Table on Disposable biodegradable trays - Year-over-year growth 2025-2030 (%)

9.4 Reusable trays - Market size and forecast 2025-2030

Chart on Reusable trays - Market size and forecast 2025-2030 ($ million)
Data Table on Reusable trays - Market size and forecast 2025-2030 ($ million)
Chart on Reusable trays - Year-over-year growth 2025-2030 (%)
Data Table on Reusable trays - Year-over-year growth 2025-2030 (%)

9.5 Market opportunity by Type

Market opportunity by Type ($ million)
Data Table on Market opportunity by Type ($ million)

10. Market Segmentation by Distribution Channel

10.1 Market segments

Chart on Distribution Channel - Market share 2025-2030 (%)
Data Table on Distribution Channel - Market share 2025-2030 (%)

10.2 Comparison by Distribution Channel

Chart on Comparison by Distribution Channel
Data Table on Comparison by Distribution Channel

10.3 Online retail - Market size and forecast 2025-2030

Chart on Online retail - Market size and forecast 2025-2030 ($ million)
Data Table on Online retail - Market size and forecast 2025-2030 ($ million)
Chart on Online retail - Year-over-year growth 2025-2030 (%)
Data Table on Online retail - Year-over-year growth 2025-2030 (%)

10.4 Specialty stores - Market size and forecast 2025-2030

Chart on Specialty stores - Market size and forecast 2025-2030 ($ million)
Data Table on Specialty stores - Market size and forecast 2025-2030 ($ million)
Chart on Specialty stores - Year-over-year growth 2025-2030 (%)
Data Table on Specialty stores - Year-over-year growth 2025-2030 (%)

10.5 Supermarkets - Market size and forecast 2025-2030

Chart on Supermarkets - Market size and forecast 2025-2030 ($ million)
Data Table on Supermarkets - Market size and forecast 2025-2030 ($ million)
Chart on Supermarkets - Year-over-year growth 2025-2030 (%)
Data Table on Supermarkets - Year-over-year growth 2025-2030 (%)

10.6 Hardware stores - Market size and forecast 2025-2030

Chart on Hardware stores - Market size and forecast 2025-2030 ($ million)
Data Table on Hardware stores - Market size and forecast 2025-2030 ($ million)
Chart on Hardware stores - Year-over-year growth 2025-2030 (%)
Data Table on Hardware stores - Year-over-year growth 2025-2030 (%)

10.7 Market opportunity by Distribution Channel

Market opportunity by Distribution Channel ($ million)
Data Table on Market opportunity by Distribution Channel ($ million)

11. Customer Landscape

11.1 Customer landscape overview

Analysis of price sensitivity, lifecycle, customer purchase basket, adoption rates, and purchase criteria

12. Geographic Landscape

12.1 Geographic segmentation

Chart on Market share by geography 2025-2030 (%)
Data Table on Market share by geography 2025-2030 (%)

12.2 Geographic comparison

Chart on Geographic comparison
Data Table on Geographic comparison

12.3 North America - Market size and forecast 2025-2030

Chart on North America - Market size and forecast 2025-2030 ($ million)
Data Table on North America - Market size and forecast 2025-2030 ($ million)
Chart on North America - Year-over-year growth 2025-2030 (%)
Data Table on North America - Year-over-year growth 2025-2030 (%)
Chart on Regional Comparison - North America
Data Table on Regional Comparison - North America

12.3.1 US - Market size and forecast 2025-2030

Chart on US - Market size and forecast 2025-2030 ($ million)
Data Table on US - Market size and forecast 2025-2030 ($ million)
Chart on US - Year-over-year growth 2025-2030 (%)
Data Table on US - Year-over-year growth 2025-2030 (%)

12.3.2 Canada - Market size and forecast 2025-2030

Chart on Canada - Market size and forecast 2025-2030 ($ million)
Data Table on Canada - Market size and forecast 2025-2030 ($ million)
Chart on Canada - Year-over-year growth 2025-2030 (%)
Data Table on Canada - Year-over-year growth 2025-2030 (%)

12.3.3 Mexico - Market size and forecast 2025-2030

Chart on Mexico - Market size and forecast 2025-2030 ($ million)
Data Table on Mexico - Market size and forecast 2025-2030 ($ million)
Chart on Mexico - Year-over-year growth 2025-2030 (%)
Data Table on Mexico - Year-over-year growth 2025-2030 (%)

12.4 Europe - Market size and forecast 2025-2030

Chart on Europe - Market size and forecast 2025-2030 ($ million)
Data Table on Europe - Market size and forecast 2025-2030 ($ million)
Chart on Europe - Year-over-year growth 2025-2030 (%)
Data Table on Europe - Year-over-year growth 2025-2030 (%)
Chart on Regional Comparison - Europe
Data Table on Regional Comparison - Europe

12.4.1 Germany - Market size and forecast 2025-2030

Chart on Germany - Market size and forecast 2025-2030 ($ million)
Data Table on Germany - Market size and forecast 2025-2030 ($ million)
Chart on Germany - Year-over-year growth 2025-2030 (%)
Data Table on Germany - Year-over-year growth 2025-2030 (%)

12.4.2 UK - Market size and forecast 2025-2030

Chart on UK - Market size and forecast 2025-2030 ($ million)
Data Table on UK - Market size and forecast 2025-2030 ($ million)
Chart on UK - Year-over-year growth 2025-2030 (%)
Data Table on UK - Year-over-year growth 2025-2030 (%)

12.4.3 France - Market size and forecast 2025-2030

Chart on France - Market size and forecast 2025-2030 ($ million)
Data Table on France - Market size and forecast 2025-2030 ($ million)
Chart on France - Year-over-year growth 2025-2030 (%)
Data Table on France - Year-over-year growth 2025-2030 (%)

12.4.4 Italy - Market size and forecast 2025-2030

Chart on Italy - Market size and forecast 2025-2030 ($ million)
Data Table on Italy - Market size and forecast 2025-2030 ($ million)
Chart on Italy - Year-over-year growth 2025-2030 (%)
Data Table on Italy - Year-over-year growth 2025-2030 (%)

12.4.5 Spain - Market size and forecast 2025-2030

Chart on Spain - Market size and forecast 2025-2030 ($ million)
Data Table on Spain - Market size and forecast 2025-2030 ($ million)
Chart on Spain - Year-over-year growth 2025-2030 (%)
Data Table on Spain - Year-over-year growth 2025-2030 (%)

12.4.6 The Netherlands - Market size and forecast 2025-2030

Chart on The Netherlands - Market size and forecast 2025-2030 ($ million)
Data Table on The Netherlands - Market size and forecast 2025-2030 ($ million)
Chart on The Netherlands - Year-over-year growth 2025-2030 (%)
Data Table on The Netherlands - Year-over-year growth 2025-2030 (%)

12.5 APAC - Market size and forecast 2025-2030

Chart on APAC - Market size and forecast 2025-2030 ($ million)
Data Table on APAC - Market size and forecast 2025-2030 ($ million)
Chart on APAC - Year-over-year growth 2025-2030 (%)
Data Table on APAC - Year-over-year growth 2025-2030 (%)
Chart on Regional Comparison - APAC
Data Table on Regional Comparison - APAC

12.5.1 China - Market size and forecast 2025-2030

Chart on China - Market size and forecast 2025-2030 ($ million)
Data Table on China - Market size and forecast 2025-2030 ($ million)
Chart on China - Year-over-year growth 2025-2030 (%)
Data Table on China - Year-over-year growth 2025-2030 (%)

12.5.2 India - Market size and forecast 2025-2030

Chart on India - Market size and forecast 2025-2030 ($ million)
Data Table on India - Market size and forecast 2025-2030 ($ million)
Chart on India - Year-over-year growth 2025-2030 (%)
Data Table on India - Year-over-year growth 2025-2030 (%)

12.5.3 Japan - Market size and forecast 2025-2030

Chart on Japan - Market size and forecast 2025-2030 ($ million)
Data Table on Japan - Market size and forecast 2025-2030 ($ million)
Chart on Japan - Year-over-year growth 2025-2030 (%)
Data Table on Japan - Year-over-year growth 2025-2030 (%)

12.5.4 South Korea - Market size and forecast 2025-2030

Chart on South Korea - Market size and forecast 2025-2030 ($ million)
Data Table on South Korea - Market size and forecast 2025-2030 ($ million)
Chart on South Korea - Year-over-year growth 2025-2030 (%)
Data Table on South Korea - Year-over-year growth 2025-2030 (%)

12.5.5 Australia - Market size and forecast 2025-2030

Chart on Australia - Market size and forecast 2025-2030 ($ million)
Data Table on Australia - Market size and forecast 2025-2030 ($ million)
Chart on Australia - Year-over-year growth 2025-2030 (%)
Data Table on Australia - Year-over-year growth 2025-2030 (%)

12.5.6 Indonesia - Market size and forecast 2025-2030

Chart on Indonesia - Market size and forecast 2025-2030 ($ million)
Data Table on Indonesia - Market size and forecast 2025-2030 ($ million)
Chart on Indonesia - Year-over-year growth 2025-2030 (%)
Data Table on Indonesia - Year-over-year growth 2025-2030 (%)

12.6 South America - Market size and forecast 2025-2030

Chart on South America - Market size and forecast 2025-2030 ($ million)
Data Table on South America - Market size and forecast 2025-2030 ($ million)
Chart on South America - Year-over-year growth 2025-2030 (%)
Data Table on South America - Year-over-year growth 2025-2030 (%)
Chart on Regional Comparison - South America
Data Table on Regional Comparison - South America

12.6.1 Brazil - Market size and forecast 2025-2030

Chart on Brazil - Market size and forecast 2025-2030 ($ million)
Data Table on Brazil - Market size and forecast 2025-2030 ($ million)
Chart on Brazil - Year-over-year growth 2025-2030 (%)
Data Table on Brazil - Year-over-year growth 2025-2030 (%)

12.6.2 Argentina - Market size and forecast 2025-2030

Chart on Argentina - Market size and forecast 2025-2030 ($ million)
Data Table on Argentina - Market size and forecast 2025-2030 ($ million)
Chart on Argentina - Year-over-year growth 2025-2030 (%)
Data Table on Argentina - Year-over-year growth 2025-2030 (%)

12.6.3 Chile - Market size and forecast 2025-2030

Chart on Chile - Market size and forecast 2025-2030 ($ million)
Data Table on Chile - Market size and forecast 2025-2030 ($ million)
Chart on Chile - Year-over-year growth 2025-2030 (%)
Data Table on Chile - Year-over-year growth 2025-2030 (%)

12.7 Middle East and Africa - Market size and forecast 2025-2030

Chart on Middle East and Africa - Market size and forecast 2025-2030 ($ million)
Data Table on Middle East and Africa - Market size and forecast 2025-2030 ($ million)
Chart on Middle East and Africa - Year-over-year growth 2025-2030 (%)
Data Table on Middle East and Africa - Year-over-year growth 2025-2030 (%)
Chart on Regional Comparison - Middle East and Africa
Data Table on Regional Comparison - Middle East and Africa

12.7.1 Saudi Arabia - Market size and forecast 2025-2030

Chart on Saudi Arabia - Market size and forecast 2025-2030 ($ million)
Data Table on Saudi Arabia - Market size and forecast 2025-2030 ($ million)
Chart on Saudi Arabia - Year-over-year growth 2025-2030 (%)
Data Table on Saudi Arabia - Year-over-year growth 2025-2030 (%)

12.7.2 UAE - Market size and forecast 2025-2030

Chart on UAE - Market size and forecast 2025-2030 ($ million)
Data Table on UAE - Market size and forecast 2025-2030 ($ million)
Chart on UAE - Year-over-year growth 2025-2030 (%)
Data Table on UAE - Year-over-year growth 2025-2030 (%)

12.7.3 South Africa - Market size and forecast 2025-2030

Chart on South Africa - Market size and forecast 2025-2030 ($ million)
Data Table on South Africa - Market size and forecast 2025-2030 ($ million)
Chart on South Africa - Year-over-year growth 2025-2030 (%)
Data Table on South Africa - Year-over-year growth 2025-2030 (%)

12.7.4 Israel - Market size and forecast 2025-2030

Chart on Israel - Market size and forecast 2025-2030 ($ million)
Data Table on Israel - Market size and forecast 2025-2030 ($ million)
Chart on Israel - Year-over-year growth 2025-2030 (%)
Data Table on Israel - Year-over-year growth 2025-2030 (%)

12.7.5 Turkey - Market size and forecast 2025-2030

Chart on Turkey - Market size and forecast 2025-2030 ($ million)
Data Table on Turkey - Market size and forecast 2025-2030 ($ million)
Chart on Turkey - Year-over-year growth 2025-2030 (%)
Data Table on Turkey - Year-over-year growth 2025-2030 (%)

12.8 Market opportunity by geography

Market opportunity by geography ($ million)
Data Tables on Market opportunity by geography ($ million)

13. Drivers, Challenges, and Opportunity

13.1 Market drivers

Expansion of controlled environment agriculture and urban farming
Focus on food security and agricultural productivity gains
Rise of sustainable horticulture and eco-friendly materials

13.2 Market challenges

Environmental regulatory compliance and plastic waste management
Supply chain fragmentation and raw material price volatility
Technical interoperability and automation integration barriers

13.3 Impact of drivers and challenges

Impact of drivers and challenges in 2025 and 2030

13.4 Market opportunities

Integration of artificial intelligence and smart monitoring technology
Advancements in bio-based and peat-free growing media
Shift toward circular design and long-life cycle products

14. Competitive Landscape

14.1 Overview

14.2

Overview on criticality of inputs and factors of differentiation

14.3 Landscape disruption

Overview on factors of disruption

14.4 Industry risks

Impact of key risks on business

15. Competitive Analysis

15.1 Companies profiled

Companies covered

15.2 Company ranking index

15.3 Market positioning of companies

Matrix on companies position and classification

15.4 Back to the Roots Inc.

Back to the Roots Inc. - Overview
Back to the Roots Inc. - Product / Service
Back to the Roots Inc. - Key offerings
SWOT

15.5 Gardzen

Gardzen - Overview
Gardzen - Product / Service
Gardzen - Key offerings
SWOT

15.6 Garland Products Ltd.

Garland Products Ltd. - Overview
Garland Products Ltd. - Product / Service
Garland Products Ltd. - Key offerings
SWOT

15.7 Hydrofarm LLC

Hydrofarm LLC - Overview
Hydrofarm LLC - Product / Service
Hydrofarm LLC - Key offerings
SWOT

15.8 Japeto Ltd

Japeto Ltd - Overview
Japeto Ltd - Product / Service
Japeto Ltd - Key offerings
SWOT

15.9 Jiffy Group

Jiffy Group - Overview
Jiffy Group - Product / Service
Jiffy Group - Key offerings
SWOT

15.10 Johnnys Selected Seeds

Johnnys Selected Seeds - Overview
Johnnys Selected Seeds - Product / Service
Johnnys Selected Seeds - Key offerings
SWOT

15.11 Malton Plastics UK Ltd.

Malton Plastics UK Ltd. - Overview
Malton Plastics UK Ltd. - Product / Service
Malton Plastics UK Ltd. - Key offerings
SWOT

15.12 Namdeo Umaji Agritech I Pvt. Ltd

Namdeo Umaji Agritech I Pvt. Ltd - Overview
Namdeo Umaji Agritech I Pvt. Ltd - Product / Service
Namdeo Umaji Agritech I Pvt. Ltd - Key offerings
SWOT

15.13 Ningbo Seninger Plastics Co. Ltd.

Ningbo Seninger Plastics Co. Ltd. - Overview
Ningbo Seninger Plastics Co. Ltd. - Product / Service
Ningbo Seninger Plastics Co. Ltd. - Key offerings
SWOT

15.14 Plants Guru

Plants Guru - Overview
Plants Guru - Product / Service
Plants Guru - Key offerings
SWOT

15.15 S.V. Agri Tech

S.V. Agri Tech - Overview
S.V. Agri Tech - Product / Service
S.V. Agri Tech - Key offerings
SWOT

15.16 The Affordable Organic Store

The Affordable Organic Store - Overview
The Affordable Organic Store - Product / Service
The Affordable Organic Store - Key offerings
SWOT

15.17 The Scotts Miracle Gro Co.

The Scotts Miracle Gro Co. - Overview
The Scotts Miracle Gro Co. - Business segments
The Scotts Miracle Gro Co. - Key offerings
The Scotts Miracle Gro Co. - Segment focus
SWOT

15.18 W. Atlee Burpee and Co.

W. Atlee Burpee and Co. - Overview
W. Atlee Burpee and Co. - Product / Service
W. Atlee Burpee and Co. - Key offerings
SWOT

16. Appendix

16.1 Scope of the report

Market definition
Objectives
Notes and caveats

16.2 Inclusions and exclusions checklist

Inclusions checklist
Exclusions checklist

16.3 Currency conversion rates for US$

16.4 Research methodology

16.5 Data procurement

Information sources

16.6 Data validation

16.7 Validation techniques employed for market sizing

16.8 Data synthesis

16.9 360 degree market analysis

16.10 List of abbreviations

Research Methodology

Technavio presents a detailed picture of the market by way of study, synthesis, and summation of data from multiple sources. The analysts have presented the various facets of the market with a particular focus on identifying the key industry influencers. The data thus presented is comprehensive, reliable, and the result of extensive research, both primary and secondary.

INFORMATION SOURCES

Primary sources

  • Manufacturers and suppliers
  • Channel partners
  • Industry experts
  • Strategic decision makers

Secondary sources

  • Industry journals and periodicals
  • Government data
  • Financial reports of key industry players
  • Historical data
  • Press releases

DATA ANALYSIS

Data Synthesis

  • Collation of data
  • Estimation of key figures
  • Analysis of derived insights

Data Validation

  • Triangulation with data models
  • Reference against proprietary databases
  • Corroboration with industry experts

REPORT WRITING

Qualitative

  • Market drivers
  • Market challenges
  • Market trends
  • Five forces analysis

Quantitative

  • Market size and forecast
  • Market segmentation
  • Geographical insights
  • Competitive landscape

Interested in this report?

Get your sample now to see our research methodology and insights!

Download Now

Frequently Asked Questions

Germination Kits And Trays market growth will increase by USD 241.4 million during 2026-2030.

The Germination Kits And Trays market is expected to grow at a CAGR of 5.8% during 2026-2030.

Germination Kits And Trays market is segmented by Application (Home gardening, Commercial farming, Educational institutes, Research centers) Type (Disposable biodegradable trays, Reusable trays) Distribution channel (Online retail, Specialty stores, Supermarkets, Hardware stores)

Back to the Roots Inc., Gardzen, Garland Products Ltd., Hydrofarm LLC, Japeto Ltd, Jiffy Group, Johnnys Selected Seeds, Malton Plastics UK Ltd., Namdeo Umaji Agritech I Pvt. Ltd, Ningbo Seninger Plastics Co. Ltd., Plants Guru, S.V. Agri Tech, The Affordable Organic Store, The Scotts Miracle Gro Co., W. Atlee Burpee and Co. are a few of the key vendors in the Germination Kits And Trays market.

North America will register the highest growth rate of 46.1% among the other regions. Therefore, the Germination Kits And Trays market in North America is expected to garner significant business opportunities for the vendors during the forecast period.

US, Canada, Mexico, Germany, UK, France, Italy, Spain, The Netherlands, China, India, Japan, South Korea, Australia, Indonesia, Brazil, Argentina, Chile, Saudi Arabia, UAE, South Africa, Israel, Turkey

  • Expansion of controlled environment agriculture and urban farming is the driving factor this market.

The Germination Kits And Trays market vendors should focus on grabbing business opportunities from the Application segment as it accounted for the largest market share in the base year.
RIA - Research AI Assistant
Ask RIA