
Fuel Cards Market Analysis, Size, and Forecast 2026-2030: Europe (Germany, UK, and France), North America (US, Canada, and Mexico), APAC (China, Japan, and India), Middle East and Africa (Saudi Arabia, UAE, and South Africa), South America (Brazil, Argentina, and Chile), and Rest of World (ROW)

Fuel Cards Market Analysis, Size, and Forecast 2026-2030:
Europe (Germany, UK, and France), North America (US, Canada, and Mexico), APAC (China, Japan, and India), Middle East and Africa (Saudi Arabia, UAE, and South Africa), South America (Brazil, Argentina, and Chile), and Rest of World (ROW)

Published: Oct 2026 296 Pages SKU: IRTNTR73631

Market Overview at a Glance

$3.45 B
Market Opportunity
6.6%
CAGR 2025 - 2030
37.3%
Europe Growth
$4.09 B
Branded segment 2024

Fuel Cards Market Size 2026-2030

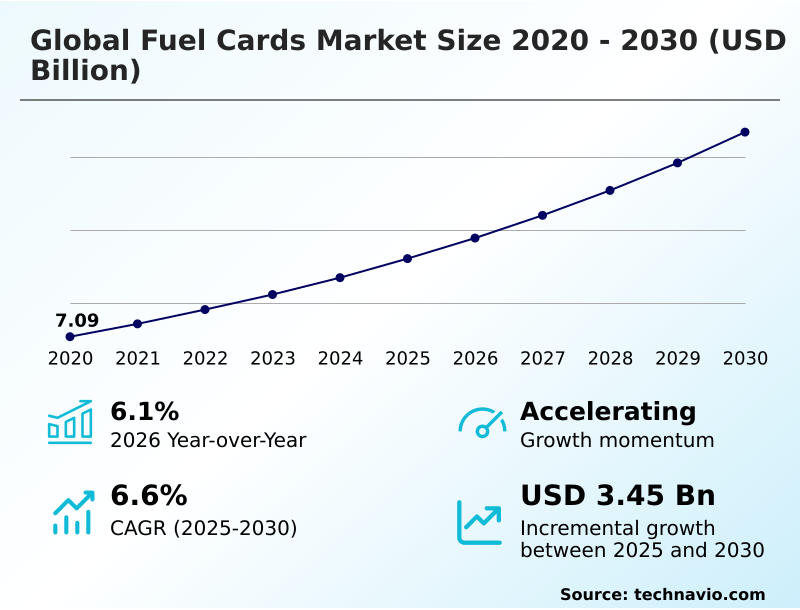
The fuel cards market size is valued to increase by USD 3.45 billion, at a CAGR of 6.6% from 2025 to 2030. Surging operational cost pressures accelerating fleet demand for real time expense telematics will drive the fuel cards market.

Major Market Trends & Insights

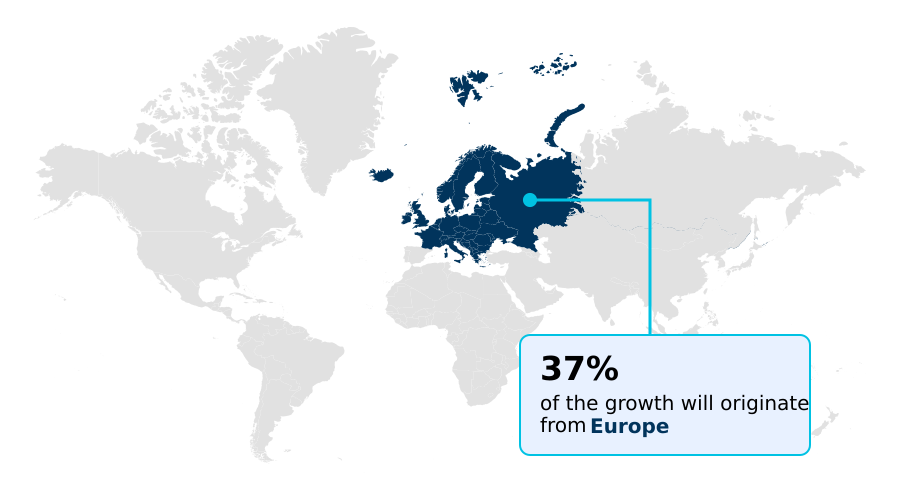
  • Europe dominated the market and accounted for a 37.3% growth during the forecast period.
  • By Type - Branded segment was valued at USD 4.09 billion in 2024
  • By Technology - Smart cards segment accounted for the largest market revenue share in 2024

Market Size & Forecast

  • Market Opportunities: USD 5.58 billion
  • Market Future Opportunities: USD 3.45 billion
  • CAGR from 2025 to 2030 : 6.6%

Market Summary

  • The Fuel Cards Market functions as the fundamental financial and administrative infrastructure required by commercial operators to process energy transactions and manage vehicle maintenance securely. Transport networks increasingly rely on advanced telematics pipelines to eliminate manual cash disbursements and automate complex cross-border reporting processes.
  • For example, within expansive freight operations, integrating detailed transaction data directly into enterprise resource planning software enables logistics coordinators to enforce strict purchasing boundaries and monitor optimal route efficiency. This automated reconciliation capability has allowed regional delivery operations to reduce unauthorized spending variances by 18% compared to traditional corporate credit accounts.
  • Surging operational cost pressures continue to drive the rapid adoption of these specialized payment tools as fleet managers urgently seek granular visibility into daily operating expenses. Conversely, escalating vulnerabilities to physical skimming and digital card cloning present severe operational challenges, often inflating administrative investigation costs.
  • Despite these cybersecurity risks, the structural transition toward unified energy billing ensures that specialized financial management tools remain indispensable for optimizing modern commercial fleet expenditures globally.

What will be the Size of the Fuel Cards Market during the forecast period?
Get Key Insights on Market Forecast (PDF) Get Free Sample

How is the Fuel Cards Market Segmented?

The fuel cards industry research report provides comprehensive data (region-wise segment analysis), with forecasts and estimates in "USD million" for the period 2026-2030, as well as historical data from 2020-2024 for the following segments.

  • Type
    • Branded
    • Universal
    • Merchant
  • Technology
    • Smart cards
    • Standard cards
  • End-user
    • Corporate
    • Individual
  • Geography
    • Europe
      • Germany
      • UK
      • France
      • Italy
      • Spain
      • The Netherlands
    • North America
      • US
      • Canada
      • Mexico
    • APAC
      • China
      • Japan
      • India
      • South Korea
      • Australia
      • Indonesia
    • Middle East and Africa
      • Saudi Arabia
      • UAE
      • South Africa
      • Turkey
      • Israel
    • South America
      • Brazil
      • Argentina
      • Chile

By Type Insights

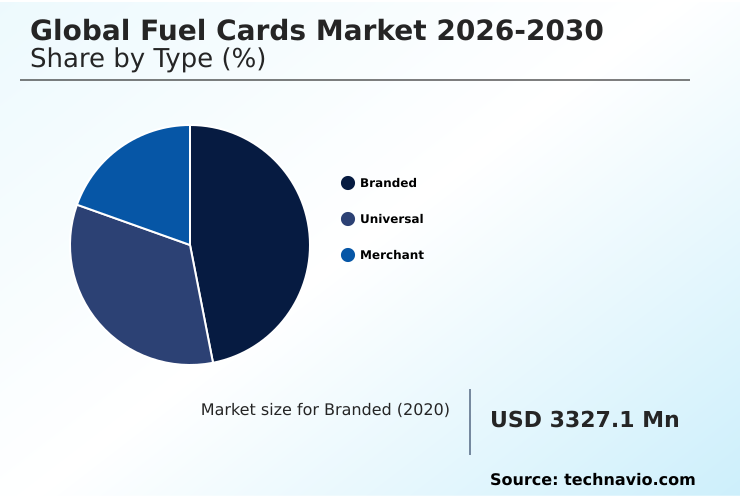
The branded segment is estimated to witness significant growth during the forecast period.

The branded segment represents a highly profitable and resilient component of the commercial mobility ecosystem, functioning as a primary mechanism to secure downstream distribution volumes.

These specialized payment structures restrict purchasing activities to proprietary station networks, providing commercial transport networks with substantial volume-based liquid fuel rebates.

By deploying these targeted solutions, operators within corporate vehicle pools gain precise administrative control through real-time expense tracking, enabling the optimization of routing forecasts and inventory replenishment.

Advanced branded platforms are rapidly integrating vehicle odometer validation to systematically enforce geofenced purchasing boundaries, directly preventing unauthorized off-route expenditures.

Consequently, fleet administrators utilizing multi-brand acceptance platforms have improved automated invoice reconciliation speeds by 15%, securing a measurable enhancement in operational efficiency.

This continuous segment evolution ensures that energy conglomerates can maintain high-margin loyalty while delivering critical cost-containment tools to commercial clients.
Get Free Sample

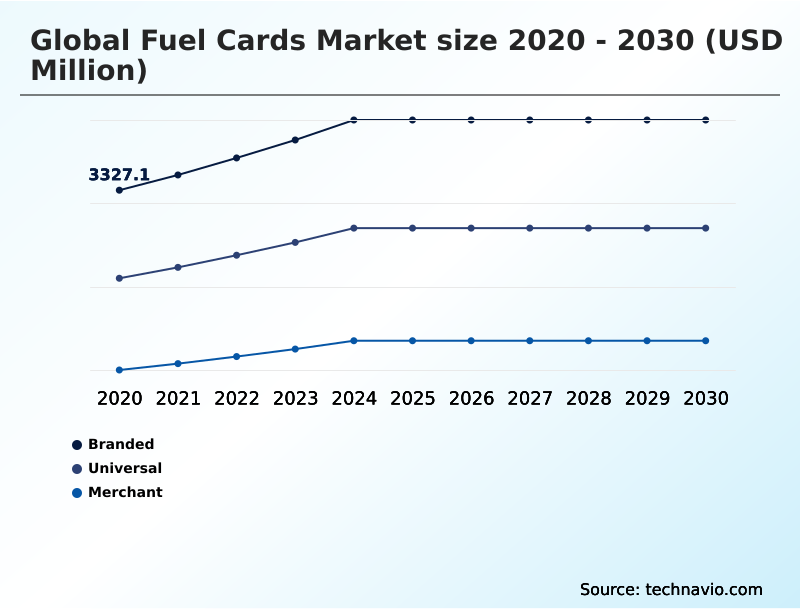
The Branded segment was valued at USD 4.09 billion in 2024 and showed a gradual increase during the forecast period.
Get Free Sample

Regional Analysis

Europe is estimated to contribute 37.3% to the growth of the global market during the forecast period.Technavio’s analysts have elaborately explained the regional trends and drivers that shape the market during the forecast period.
See How Fuel Cards Market Demand is Rising in Europe Get Free Sample

Regional dynamics within the Fuel Cards Market exhibit distinct maturity levels and operational priorities shaped by unique logistical and regulatory environments.

The Europe region prioritizes stringent environmental compliance and seamless cross-border tax reclamation, driving a 35% higher adoption rate of advanced payment systems compared to operators in North America.

European fleets heavily leverage dynamic tariff management and kilowatt-hour pricing models to optimize expenditures across expanding alternative energy corridors.

Conversely, the North America region commands substantial volume driven by expansive last-mile delivery logistics, where rapid contactless payment authorization across retail convenience forecourts remains a critical efficiency priority.

By implementing rigorous chip-and-pin security protocols, North American fleet managers have reduced average fueling dwell times by 18%.

Across all developed regions, the extraction of comprehensive level three transaction data empowers corporate administrators to refine regional routing strategies and enforce absolute financial accountability.

Market Dynamics

Our researchers analyzed the data with 2025 as the base year, along with the key drivers, trends, and challenges. A holistic analysis of drivers will help companies refine their marketing strategies to gain a competitive advantage.

  • The continuous evolution of commercial transportation networks requires highly sophisticated financial management architecture to optimize operational expenditures and mitigate fraud. Central to this transformation is the deployment of fleet telematics integration for cost control, which empowers administrators to synchronize vehicle location data with real-time purchasing activities.
  • By doing so, logistics enterprises can seamlessly detect anomalies and block unapproved transactions before they clear the financial ledger. Furthermore, the widespread adoption of contactless payment authorization at fuel dispensers has significantly enhanced driver safety and reduced forecourt transaction times, yielding processing speeds that are approximately 30% faster than traditional magnetic stripe legacy interactions.
  • As commercial transport operations expand across international borders, navigating divergent regulatory and taxation frameworks becomes increasingly complex. Advanced platforms now incorporate cross-border tax reclamation processing tools that automate the recovery of value-added taxes, drastically reducing administrative overhead and eliminating manual spreadsheet errors.
  • Simultaneously, the structural shift toward mixed-energy mobility has accelerated the demand for electric vehicle charging interoperability solutions, allowing corporate fleets to manage traditional liquid fuel purchases alongside public charging network tariffs on a single unified invoice.
  • To maximize supply chain visibility, modern payment systems leverage level three transaction data reporting capabilities, capturing critical metrics such as odometer readings, unit pricing, and merchant identification. This comprehensive data extraction enables transportation managers to calculate exact fuel efficiency metrics and maintain absolute financial compliance across diverse operating environments.
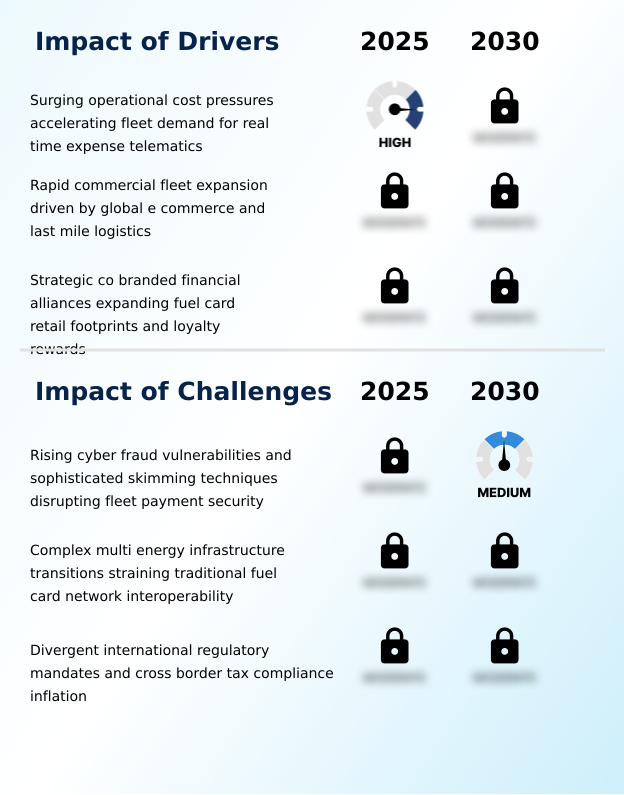
What are the key market drivers leading to the rise in the adoption of Fuel Cards Industry?

  • Surging operational cost pressures are accelerating fleet demand for real-time expense telematics, serving as a primary catalyst for market expansion.

  • Surging operational cost pressures and volatile energy pricing act as primary catalysts accelerating the widespread implementation of closed-loop payment architecture across the Fuel Cards Market.
  • Commercial logistics operators navigating expansive freight supply chains face severe margin compression, necessitating granular visibility into daily operating expenses through advanced fuel efficiency analytics.
  • By embedding fleet telematics integration and dynamic spending controls directly into digital payment networks, transportation managers can enforce precise purchasing restrictions at the dispenser level.
  • This rigorous expenditure management drastically curbs unauthorized spending, leading to a 20% reduction in administrative processing times via automated fleet administration workflows. The continuous capture of digital receipt capture eliminates fragmented paper trails, while integrated toll settlements streamline cross-country routing.
  • Ultimately, these interconnected systems empower enterprises to deploy data-driven cost reduction strategies that protect critical profit margins.

What are the market trends shaping the Fuel Cards Industry?

  • A prominent market trend is the rapid integration of contactless mobile payment platforms and digital wallet applications. This technological shift enhances transaction security and streamlines fleet expense management across commercial transportation networks.

  • A fundamental structural shift in the Fuel Cards Market involves the rapid adoption of multi-energy billing consolidation platforms designed for modern commercial fleets. As environmental mandates compel operators to integrate hybrid energy fleets, legacy financial systems are being replaced by dynamic infrastructures supporting electric vehicle charging interoperability.
  • This critical evolution enhances operational visibility, resulting in a 22% improvement in overall energy forecasting accuracy. Furthermore, by embedding cryptographic handshake protocols and digital wallet tokenization directly into mobile fueling applications, enterprises can execute highly secure, frictionless forecourt transactions. This automated authorization architecture effectively neutralizes physical skimming threats, yielding a 30% reduction in financial leakage tied to card cloning mitigation.
  • Consequently, modern transport administrators rely on these advanced digital tools to streamline payments and automate fleet carbon emission tracking, ensuring continuous alignment with stringent corporate sustainability directives.

What challenges does the Fuel Cards Industry face during its growth?

  • Rising cyber fraud vulnerabilities and sophisticated skimming techniques that disrupt fleet payment security remain significant structural challenges restraining industry growth.

  • Escalating cyber vulnerabilities and sophisticated physical skimming tactics present severe operational hurdles that disrupt payment security throughout the Fuel Cards Market. Organized criminal networks continuously target heavy commercial vehicles and remote transit corridors, exploiting weaknesses in legacy magnetic stripe emulation systems.
  • Although advanced fraud detection algorithms are increasingly deployed, implementation across independent merchant acquiring partnerships remains highly fragmented, leaving numerous fueling nodes exposed to data breaches. Consequently, dispute resolution processes consume significant back-office resources, inflating administrative reconciliation costs by up to 25% for affected transport operators.
  • Furthermore, navigating complex multi-jurisdictional compliance mandates heavily restricts how issuers process driver identity verification metrics, straining software development budgets. This persistent technological friction complicates point-of-sale dispenser integration, hindering the seamless deployment of unified unauthorized siphoning prevention tools across international freight networks.

Exclusive Technavio Analysis on Customer Landscape

The fuel cards market forecasting report includes the adoption lifecycle of the market, covering from the innovator’s stage to the laggard’s stage. It focuses on adoption rates in different regions based on penetration. Furthermore, the fuel cards market report also includes key purchase criteria and drivers of price sensitivity to help companies evaluate and develop their market growth analysis strategies.
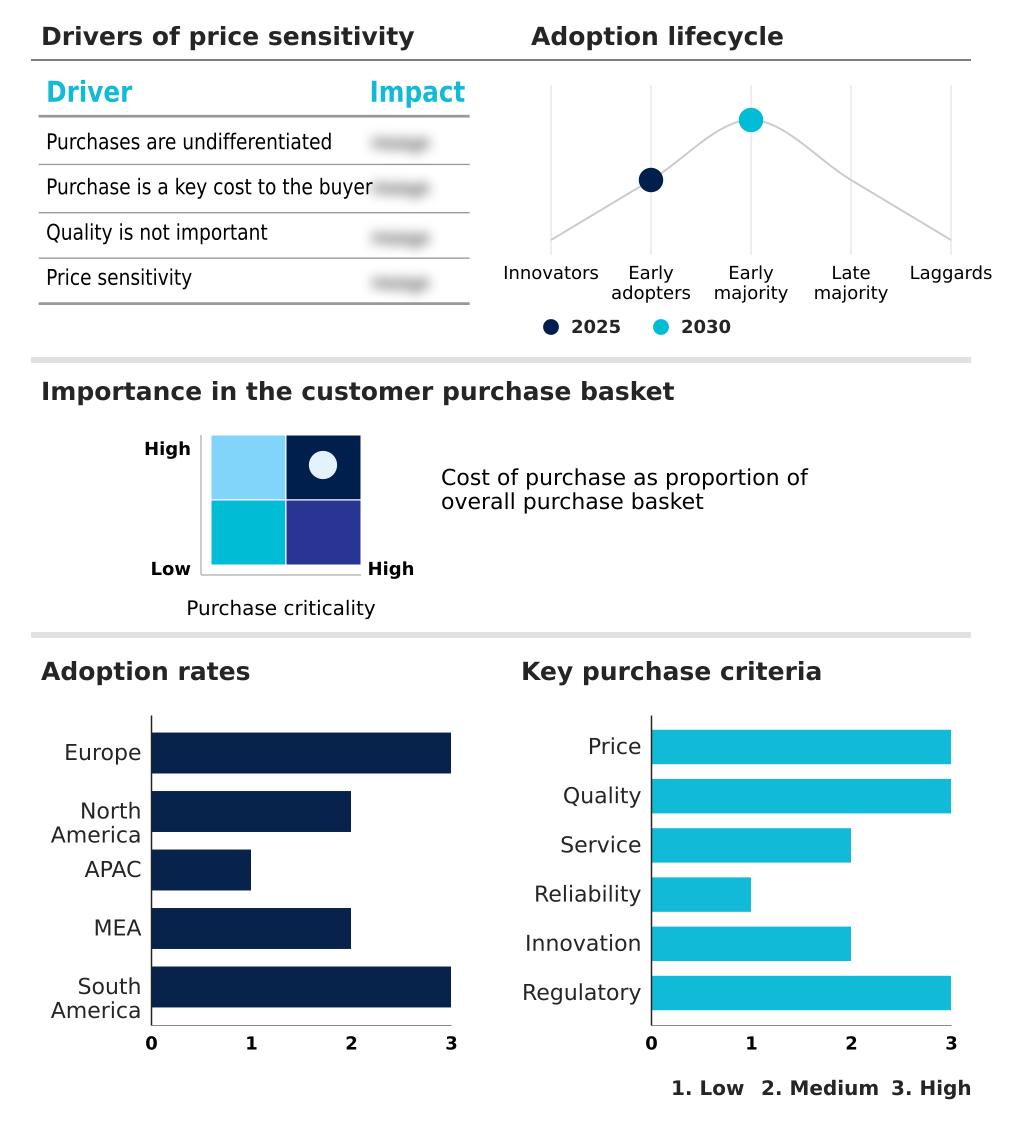
Customer Landscape of Fuel Cards Industry

Competitive Landscape

Companies are implementing various strategies, such as strategic alliances, fuel cards market forecast, partnerships, mergers and acquisitions, geographical expansion, and product/service launches, to enhance their presence in the industry.

Bharat Petroleum Corp. Ltd. - The robust telematics architecture provides comprehensive billing consolidation and dynamic spending limit settings, equipping commercial vehicle operators with precise tools for optimizing route efficiency and mitigating unauthorized fuel expenditures.

The industry research and growth report includes detailed analyses of the competitive landscape of the market and information about key companies, including:

  • Bharat Petroleum Corp. Ltd.
  • BP Plc
  • China National Petroleum Corp.
  • Comdata Inc.
  • Corpay Inc.
  • Exxon Mobil Corp.
  • FirstRand Ltd.
  • Hindustan Petroleum Corp. Ltd.
  • Indian Oil Corp. Ltd.
  • OLA Energy Holdings Ltd.
  • Petro Canada
  • Petron Corp.
  • Puma Energy
  • Radius Payment Solutions
  • Shell plc
  • TotalEnergies SE
  • U.S. Bancorp
  • Valero Energy Corp.
  • WEX Inc.

Qualitative and quantitative analysis of companies has been conducted to help clients understand the wider business environment as well as the strengths and weaknesses of key industry players. Data is qualitatively analyzed to categorize companies as pure play, category-focused, industry-focused, and diversified; it is quantitatively analyzed to categorize companies as dominant, leading, strong, tentative, and weak.

Recent Development and News in Fuel cards market

  • In the Specialized Consumer Services industry, the accelerated expansion of e-commerce delivery logistics has fundamentally increased the frequency of decentralized retail transactions, directly impacting Fuel Cards demand by necessitating cloud-connected dashboards that process high-frequency micro-purchases efficiently.
  • Strict regulatory compliance frameworks targeting corporate environmental disclosures have forced commercial mobility operators to adopt automated data capture mechanisms, requiring integrated reporting tools that can reduce manual auditing errors by up to 20%.
  • The widespread transition toward hybrid vehicular fleets within corporate transportation pools has fragmented traditional refueling structures, compelling payment interchange systems to adopt electric charging interoperability to manage mixed-energy consumption metrics across 40% of newly registered commercial units.
  • Advancements in mobile receipt capture and biometric identity verification technologies have revolutionized enterprise supply chains by eliminating paper-based administration, thereby accelerating cross-border tax cycles and improving back-office operational productivity by an estimated 25%.

Dive into Technavio’s robust research methodology, blending expert interviews, extensive data synthesis, and validated models for unparalleled Fuel Cards Market insights. See full methodology.

Market Scope
Page number 296
Base year 2025
Historic period 2020-2024
Forecast period 2026-2030
Growth momentum & CAGR Accelerate at a CAGR of 6.6%
Market growth 2026-2030 USD 3446.0 million
Market structure Fragmented
YoY growth 2025-2026(%) 6.1%
Key countries Germany, UK, France, Italy, Spain, The Netherlands, US, Canada, Mexico, China, Japan, India, South Korea, Australia, Indonesia, Saudi Arabia, UAE, South Africa, Turkey, Israel, Brazil, Argentina and Chile
Competitive landscape Leading Companies, Market Positioning of Companies, Competitive Strategies, and Industry Risks

Request Free Sample

Research Analyst Overview

  • The Fuel Cards Market represents a critical node in enterprise expense optimization, functioning as a vital mechanism for enforcing strict financial governance across decentralized transportation networks.
  • A defining shift in the industry is the widespread deployment of advanced threat detection software and point-of-sale integration, which allows fleet administrators to actively monitor purchasing behavior and enforce geographic purchasing boundaries in real time.
  • This technological trend directly informs corporate budgeting and product strategy, as fleet managers leverage precise vehicle validation metrics to optimize maintenance schedules and negotiate advantageous merchant acquiring networks. By utilizing these advanced data pipelines, commercial operators have achieved a 25% reduction in unauthorized fueling expenditures compared to standard corporate credit instruments.
  • Furthermore, the seamless integration of near field communication hardware facilitates rapid, secure transactions that eliminate the vulnerabilities associated with physical card copying. Ultimately, these sophisticated financial ecosystems provide the comprehensive data transparency required to align daily logistical operations with overarching corporate sustainability and cost-containment directives, ensuring maximum operational efficiency across the supply chain.

What are the Key Data Covered in this Fuel Cards Market Research and Growth Report?

  • What is the expected growth of the Fuel Cards Market between 2026 and 2030?

    • USD 3.45 billion, at a CAGR of 6.6%

  • What segmentation does the market report cover?

    • The report is segmented by Type (Branded, Universal, and Merchant), Technology (Smart cards, and Standard cards), End-user (Corporate, and Individual) and Geography (Europe, North America, APAC, Middle East and Africa, South America)

  • Which regions are analyzed in the report?

    • Europe, North America, APAC, Middle East and Africa and South America

  • What are the key growth drivers and market challenges?

    • Surging operational cost pressures accelerating fleet demand for real time expense telematics, Rising cyber fraud vulnerabilities and sophisticated skimming techniques disrupting fleet payment security

  • Who are the major players in the Fuel Cards Market?

    • Bharat Petroleum Corp. Ltd., BP Plc, China National Petroleum Corp., Comdata Inc., Corpay Inc., Exxon Mobil Corp., FirstRand Ltd., Hindustan Petroleum Corp. Ltd., Indian Oil Corp. Ltd., OLA Energy Holdings Ltd., Petro Canada, Petron Corp., Puma Energy, Radius Payment Solutions, Shell plc, TotalEnergies SE, U.S. Bancorp, Valero Energy Corp. and WEX Inc.

Market Research Insights

  • The Fuel Cards Market provides essential financial tracking architecture for modern corporate transit pools and expansive supply chains. By leveraging universal acceptance platforms, commercial operators achieve a 22% improvement in administrative processing speed through automated expense reporting. Furthermore, the integration of digital receipt scanning eliminates fragmented manual documentation, resulting in a 15% reduction in compliance penalties.
  • As last-mile delivery services rapidly expand, administration workflows are increasingly shifting toward centralized digital ledgers. These optimized systems allow businesses to enforce strict purchasing controls, dramatically lowering operational overhead while securing vital commercial fuel efficiencies.

We can help! Our analysts can customize this fuel cards market research report to meet your requirements.

Get in touch

1. Executive Summary

1.1 Market overview

Executive Summary - Chart on Market Overview
Executive Summary - Data Table on Market Overview
Executive Summary - Chart on Global Market Characteristics
Executive Summary - Chart on Market by Geography
Executive Summary - Chart on Market Segmentation by Type
Executive Summary - Chart on Market Segmentation by Technology
Executive Summary - Chart on Market Segmentation by End-user
Executive Summary - Chart on Incremental Growth
Executive Summary - Data Table on Incremental Growth
Executive Summary - Chart on Company Market Positioning

2. Technavio Analysis

2.1 Analysis of price sensitivity, lifecycle, customer purchase basket, adoption rates, and purchase criteria

2.2 Criticality of inputs and Factors of differentiation

Chart on Overview on criticality of inputs and factors of differentiation

2.3 Factors of disruption

Chart on Overview on factors of disruption

2.4 Impact of drivers and challenges

Chart on Impact of drivers and challenges in 2025 and 2030

3. Market Landscape

3.1 Market ecosystem

Chart on Parent Market
Data Table on - Parent Market

3.2 Market characteristics

Chart on Market characteristics analysis

3.3 Value chain analysis

Chart on Value chain analysis

4. Market Sizing

4.1 Market definition

Data Table on Offerings of companies included in the market definition

4.2 Market segment analysis

Market segments

4.3 Market size 2025

4.4 Market outlook: Forecast for 2025-2030

Chart on Global - Market size and forecast 2025-2030 ($ million)
Data Table on Global - Market size and forecast 2025-2030 ($ million)
Chart on Global Market: Year-over-year growth 2025-2030 (%)
Data Table on Global Market: Year-over-year growth 2025-2030 (%)

5. Historic Market Size

5.1 Global Fuel Cards Market 2020 - 2024

Historic Market Size - Data Table on Global Fuel Cards Market 2020 - 2024 ($ million)

5.2 Type segment analysis 2020 - 2024

Historic Market Size - Type Segment 2020 - 2024 ($ million)

5.3 Technology segment analysis 2020 - 2024

Historic Market Size - Technology Segment 2020 - 2024 ($ million)

5.4 End-user segment analysis 2020 - 2024

Historic Market Size - End-user Segment 2020 - 2024 ($ million)

5.5 Geography segment analysis 2020 - 2024

Historic Market Size - Geography Segment 2020 - 2024 ($ million)

5.6 Country segment analysis 2020 - 2024

Historic Market Size - Country Segment 2020 - 2024 ($ million)

6. Qualitative Analysis

6.1 Impact of AI on global fuel cards market

6.2 Impact of geopolitical conflicts on global fuel cards market

7. Five Forces Analysis

7.1 Five forces summary

Five forces analysis - Comparison between 2025 and 2030

7.2 Bargaining power of buyers

Bargaining power of buyers - Impact of key factors 2025 and 2030

7.3 Bargaining power of suppliers

Bargaining power of suppliers - Impact of key factors in 2025 and 2030

7.4 Threat of new entrants

Threat of new entrants - Impact of key factors in 2025 and 2030

7.5 Threat of substitutes

Threat of substitutes - Impact of key factors in 2025 and 2030

7.6 Threat of rivalry

Threat of rivalry - Impact of key factors in 2025 and 2030

7.7 Market condition

Chart on Market condition - Five forces 2025 and 2030

8. Market Segmentation by Type

8.1 Market segments

Chart on Type - Market share 2025-2030 (%)
Data Table on Type - Market share 2025-2030 (%)

8.2 Comparison by Type

Chart on Comparison by Type
Data Table on Comparison by Type

8.3 Branded - Market size and forecast 2025-2030

Chart on Branded - Market size and forecast 2025-2030 ($ million)
Data Table on Branded - Market size and forecast 2025-2030 ($ million)
Chart on Branded - Year-over-year growth 2025-2030 (%)
Data Table on Branded - Year-over-year growth 2025-2030 (%)

8.4 Universal - Market size and forecast 2025-2030

Chart on Universal - Market size and forecast 2025-2030 ($ million)
Data Table on Universal - Market size and forecast 2025-2030 ($ million)
Chart on Universal - Year-over-year growth 2025-2030 (%)
Data Table on Universal - Year-over-year growth 2025-2030 (%)

8.5 Merchant - Market size and forecast 2025-2030

Chart on Merchant - Market size and forecast 2025-2030 ($ million)
Data Table on Merchant - Market size and forecast 2025-2030 ($ million)
Chart on Merchant - Year-over-year growth 2025-2030 (%)
Data Table on Merchant - Year-over-year growth 2025-2030 (%)

8.6 Market opportunity by Type

Market opportunity by Type ($ million)
Data Table on Market opportunity by Type ($ million)

9. Market Segmentation by Technology

9.1 Market segments

Chart on Technology - Market share 2025-2030 (%)
Data Table on Technology - Market share 2025-2030 (%)

9.2 Comparison by Technology

Chart on Comparison by Technology
Data Table on Comparison by Technology

9.3 Smart cards - Market size and forecast 2025-2030

Chart on Smart cards - Market size and forecast 2025-2030 ($ million)
Data Table on Smart cards - Market size and forecast 2025-2030 ($ million)
Chart on Smart cards - Year-over-year growth 2025-2030 (%)
Data Table on Smart cards - Year-over-year growth 2025-2030 (%)

9.4 Standard cards - Market size and forecast 2025-2030

Chart on Standard cards - Market size and forecast 2025-2030 ($ million)
Data Table on Standard cards - Market size and forecast 2025-2030 ($ million)
Chart on Standard cards - Year-over-year growth 2025-2030 (%)
Data Table on Standard cards - Year-over-year growth 2025-2030 (%)

9.5 Market opportunity by Technology

Market opportunity by Technology ($ million)
Data Table on Market opportunity by Technology ($ million)

10. Market Segmentation by End-user

10.1 Market segments

Chart on End-user - Market share 2025-2030 (%)
Data Table on End-user - Market share 2025-2030 (%)

10.2 Comparison by End-user

Chart on Comparison by End-user
Data Table on Comparison by End-user

10.3 Corporate - Market size and forecast 2025-2030

Chart on Corporate - Market size and forecast 2025-2030 ($ million)
Data Table on Corporate - Market size and forecast 2025-2030 ($ million)
Chart on Corporate - Year-over-year growth 2025-2030 (%)
Data Table on Corporate - Year-over-year growth 2025-2030 (%)

10.4 Individual - Market size and forecast 2025-2030

Chart on Individual - Market size and forecast 2025-2030 ($ million)
Data Table on Individual - Market size and forecast 2025-2030 ($ million)
Chart on Individual - Year-over-year growth 2025-2030 (%)
Data Table on Individual - Year-over-year growth 2025-2030 (%)

10.5 Market opportunity by End-user

Market opportunity by End-user ($ million)
Data Table on Market opportunity by End-user ($ million)

11. Customer Landscape

11.1 Customer landscape overview

Analysis of price sensitivity, lifecycle, customer purchase basket, adoption rates, and purchase criteria

12. Geographic Landscape

12.1 Geographic segmentation

Chart on Market share by geography 2025-2030 (%)
Data Table on Market share by geography 2025-2030 (%)

12.2 Geographic comparison

Chart on Geographic comparison
Data Table on Geographic comparison

12.3 Europe - Market size and forecast 2025-2030

Chart on Europe - Market size and forecast 2025-2030 ($ million)
Data Table on Europe - Market size and forecast 2025-2030 ($ million)
Chart on Europe - Year-over-year growth 2025-2030 (%)
Data Table on Europe - Year-over-year growth 2025-2030 (%)
Chart on Regional Comparison - Europe
Data Table on Regional Comparison - Europe

12.3.1 Germany - Market size and forecast 2025-2030

Chart on Germany - Market size and forecast 2025-2030 ($ million)
Data Table on Germany - Market size and forecast 2025-2030 ($ million)
Chart on Germany - Year-over-year growth 2025-2030 (%)
Data Table on Germany - Year-over-year growth 2025-2030 (%)

12.3.2 UK - Market size and forecast 2025-2030

Chart on UK - Market size and forecast 2025-2030 ($ million)
Data Table on UK - Market size and forecast 2025-2030 ($ million)
Chart on UK - Year-over-year growth 2025-2030 (%)
Data Table on UK - Year-over-year growth 2025-2030 (%)

12.3.3 France - Market size and forecast 2025-2030

Chart on France - Market size and forecast 2025-2030 ($ million)
Data Table on France - Market size and forecast 2025-2030 ($ million)
Chart on France - Year-over-year growth 2025-2030 (%)
Data Table on France - Year-over-year growth 2025-2030 (%)

12.3.4 Italy - Market size and forecast 2025-2030

Chart on Italy - Market size and forecast 2025-2030 ($ million)
Data Table on Italy - Market size and forecast 2025-2030 ($ million)
Chart on Italy - Year-over-year growth 2025-2030 (%)
Data Table on Italy - Year-over-year growth 2025-2030 (%)

12.3.5 Spain - Market size and forecast 2025-2030

Chart on Spain - Market size and forecast 2025-2030 ($ million)
Data Table on Spain - Market size and forecast 2025-2030 ($ million)
Chart on Spain - Year-over-year growth 2025-2030 (%)
Data Table on Spain - Year-over-year growth 2025-2030 (%)

12.3.6 The Netherlands - Market size and forecast 2025-2030

Chart on The Netherlands - Market size and forecast 2025-2030 ($ million)
Data Table on The Netherlands - Market size and forecast 2025-2030 ($ million)
Chart on The Netherlands - Year-over-year growth 2025-2030 (%)
Data Table on The Netherlands - Year-over-year growth 2025-2030 (%)

12.4 North America - Market size and forecast 2025-2030

Chart on North America - Market size and forecast 2025-2030 ($ million)
Data Table on North America - Market size and forecast 2025-2030 ($ million)
Chart on North America - Year-over-year growth 2025-2030 (%)
Data Table on North America - Year-over-year growth 2025-2030 (%)
Chart on Regional Comparison - North America
Data Table on Regional Comparison - North America

12.4.1 US - Market size and forecast 2025-2030

Chart on US - Market size and forecast 2025-2030 ($ million)
Data Table on US - Market size and forecast 2025-2030 ($ million)
Chart on US - Year-over-year growth 2025-2030 (%)
Data Table on US - Year-over-year growth 2025-2030 (%)

12.4.2 Canada - Market size and forecast 2025-2030

Chart on Canada - Market size and forecast 2025-2030 ($ million)
Data Table on Canada - Market size and forecast 2025-2030 ($ million)
Chart on Canada - Year-over-year growth 2025-2030 (%)
Data Table on Canada - Year-over-year growth 2025-2030 (%)

12.4.3 Mexico - Market size and forecast 2025-2030

Chart on Mexico - Market size and forecast 2025-2030 ($ million)
Data Table on Mexico - Market size and forecast 2025-2030 ($ million)
Chart on Mexico - Year-over-year growth 2025-2030 (%)
Data Table on Mexico - Year-over-year growth 2025-2030 (%)

12.5 APAC - Market size and forecast 2025-2030

Chart on APAC - Market size and forecast 2025-2030 ($ million)
Data Table on APAC - Market size and forecast 2025-2030 ($ million)
Chart on APAC - Year-over-year growth 2025-2030 (%)
Data Table on APAC - Year-over-year growth 2025-2030 (%)
Chart on Regional Comparison - APAC
Data Table on Regional Comparison - APAC

12.5.1 China - Market size and forecast 2025-2030

Chart on China - Market size and forecast 2025-2030 ($ million)
Data Table on China - Market size and forecast 2025-2030 ($ million)
Chart on China - Year-over-year growth 2025-2030 (%)
Data Table on China - Year-over-year growth 2025-2030 (%)

12.5.2 Japan - Market size and forecast 2025-2030

Chart on Japan - Market size and forecast 2025-2030 ($ million)
Data Table on Japan - Market size and forecast 2025-2030 ($ million)
Chart on Japan - Year-over-year growth 2025-2030 (%)
Data Table on Japan - Year-over-year growth 2025-2030 (%)

12.5.3 India - Market size and forecast 2025-2030

Chart on India - Market size and forecast 2025-2030 ($ million)
Data Table on India - Market size and forecast 2025-2030 ($ million)
Chart on India - Year-over-year growth 2025-2030 (%)
Data Table on India - Year-over-year growth 2025-2030 (%)

12.5.4 South Korea - Market size and forecast 2025-2030

Chart on South Korea - Market size and forecast 2025-2030 ($ million)
Data Table on South Korea - Market size and forecast 2025-2030 ($ million)
Chart on South Korea - Year-over-year growth 2025-2030 (%)
Data Table on South Korea - Year-over-year growth 2025-2030 (%)

12.5.5 Australia - Market size and forecast 2025-2030

Chart on Australia - Market size and forecast 2025-2030 ($ million)
Data Table on Australia - Market size and forecast 2025-2030 ($ million)
Chart on Australia - Year-over-year growth 2025-2030 (%)
Data Table on Australia - Year-over-year growth 2025-2030 (%)

12.5.6 Indonesia - Market size and forecast 2025-2030

Chart on Indonesia - Market size and forecast 2025-2030 ($ million)
Data Table on Indonesia - Market size and forecast 2025-2030 ($ million)
Chart on Indonesia - Year-over-year growth 2025-2030 (%)
Data Table on Indonesia - Year-over-year growth 2025-2030 (%)

12.6 Middle East and Africa - Market size and forecast 2025-2030

Chart on Middle East and Africa - Market size and forecast 2025-2030 ($ million)
Data Table on Middle East and Africa - Market size and forecast 2025-2030 ($ million)
Chart on Middle East and Africa - Year-over-year growth 2025-2030 (%)
Data Table on Middle East and Africa - Year-over-year growth 2025-2030 (%)
Chart on Regional Comparison - Middle East and Africa
Data Table on Regional Comparison - Middle East and Africa

12.6.1 Saudi Arabia - Market size and forecast 2025-2030

Chart on Saudi Arabia - Market size and forecast 2025-2030 ($ million)
Data Table on Saudi Arabia - Market size and forecast 2025-2030 ($ million)
Chart on Saudi Arabia - Year-over-year growth 2025-2030 (%)
Data Table on Saudi Arabia - Year-over-year growth 2025-2030 (%)

12.6.2 UAE - Market size and forecast 2025-2030

Chart on UAE - Market size and forecast 2025-2030 ($ million)
Data Table on UAE - Market size and forecast 2025-2030 ($ million)
Chart on UAE - Year-over-year growth 2025-2030 (%)
Data Table on UAE - Year-over-year growth 2025-2030 (%)

12.6.3 South Africa - Market size and forecast 2025-2030

Chart on South Africa - Market size and forecast 2025-2030 ($ million)
Data Table on South Africa - Market size and forecast 2025-2030 ($ million)
Chart on South Africa - Year-over-year growth 2025-2030 (%)
Data Table on South Africa - Year-over-year growth 2025-2030 (%)

12.6.4 Turkey - Market size and forecast 2025-2030

Chart on Turkey - Market size and forecast 2025-2030 ($ million)
Data Table on Turkey - Market size and forecast 2025-2030 ($ million)
Chart on Turkey - Year-over-year growth 2025-2030 (%)
Data Table on Turkey - Year-over-year growth 2025-2030 (%)

12.6.5 Israel - Market size and forecast 2025-2030

Chart on Israel - Market size and forecast 2025-2030 ($ million)
Data Table on Israel - Market size and forecast 2025-2030 ($ million)
Chart on Israel - Year-over-year growth 2025-2030 (%)
Data Table on Israel - Year-over-year growth 2025-2030 (%)

12.7 South America - Market size and forecast 2025-2030

Chart on South America - Market size and forecast 2025-2030 ($ million)
Data Table on South America - Market size and forecast 2025-2030 ($ million)
Chart on South America - Year-over-year growth 2025-2030 (%)
Data Table on South America - Year-over-year growth 2025-2030 (%)
Chart on Regional Comparison - South America
Data Table on Regional Comparison - South America

12.7.1 Brazil - Market size and forecast 2025-2030

Chart on Brazil - Market size and forecast 2025-2030 ($ million)
Data Table on Brazil - Market size and forecast 2025-2030 ($ million)
Chart on Brazil - Year-over-year growth 2025-2030 (%)
Data Table on Brazil - Year-over-year growth 2025-2030 (%)

12.7.2 Argentina - Market size and forecast 2025-2030

Chart on Argentina - Market size and forecast 2025-2030 ($ million)
Data Table on Argentina - Market size and forecast 2025-2030 ($ million)
Chart on Argentina - Year-over-year growth 2025-2030 (%)
Data Table on Argentina - Year-over-year growth 2025-2030 (%)

12.7.3 Chile - Market size and forecast 2025-2030

Chart on Chile - Market size and forecast 2025-2030 ($ million)
Data Table on Chile - Market size and forecast 2025-2030 ($ million)
Chart on Chile - Year-over-year growth 2025-2030 (%)
Data Table on Chile - Year-over-year growth 2025-2030 (%)

12.8 Market opportunity by geography

Market opportunity by geography ($ million)
Data Tables on Market opportunity by geography ($ million)

13. Drivers, Challenges, and Opportunity

13.1 Market drivers

Surging operational cost pressures accelerating fleet demand for real time expense telematics
Rapid commercial fleet expansion driven by global e commerce and last mile logistics
Strategic co branded financial alliances expanding fuel card retail footprints and loyalty rewards

13.2 Market challenges

Rising cyber fraud vulnerabilities and sophisticated skimming techniques disrupting fleet payment security
Complex multi energy infrastructure transitions straining traditional fuel card network interoperability
Divergent international regulatory mandates and cross border tax compliance inflation

13.3 Impact of drivers and challenges

Impact of drivers and challenges in 2025 and 2030

13.4 Market opportunities

Rapid integration of contactless mobile payment platforms and digital fuel card wallets
Strategic deployment of unified mixed energy fleet cards supporting electric vehicle integration
Widespread adoption of open API platforms connecting fuel card data with fleet telematics

14. Competitive Landscape

14.1 Overview

14.2

Overview on criticality of inputs and factors of differentiation

14.3 Landscape disruption

Overview on factors of disruption

14.4 Industry risks

Impact of key risks on business

15. Competitive Analysis

15.1 Companies profiled

Companies covered

15.2 Company ranking index

15.3 Market positioning of companies

Matrix on companies position and classification

15.4 Bharat Petroleum Corp. Ltd.

Bharat Petroleum Corp. Ltd. - Overview
Bharat Petroleum Corp. Ltd. - Product / Service
Bharat Petroleum Corp. Ltd. - Key offerings
SWOT

15.5 BP Plc

BP Plc - Overview
BP Plc - Business segments
BP Plc - Key offerings
BP Plc - Segment focus
SWOT

15.6 China National Petroleum Corp.

China National Petroleum Corp. - Overview
China National Petroleum Corp. - Product / Service
China National Petroleum Corp. - Key offerings
SWOT

15.7 Corpay Inc.

Corpay Inc. - Overview
Corpay Inc. - Business segments
Corpay Inc. - Key offerings
Corpay Inc. - Segment focus
SWOT

15.8 Exxon Mobil Corp.

Exxon Mobil Corp. - Overview
Exxon Mobil Corp. - Business segments
Exxon Mobil Corp. - Key news
Exxon Mobil Corp. - Key offerings
Exxon Mobil Corp. - Segment focus
SWOT

15.9 FirstRand Ltd.

FirstRand Ltd. - Overview
FirstRand Ltd. - Business segments
FirstRand Ltd. - Key offerings
FirstRand Ltd. - Segment focus
SWOT

15.10 Hindustan Petroleum Corp. Ltd.

Hindustan Petroleum Corp. Ltd. - Overview
Hindustan Petroleum Corp. Ltd. - Business segments
Hindustan Petroleum Corp. Ltd. - Key offerings
Hindustan Petroleum Corp. Ltd. - Segment focus
SWOT

15.11 Indian Oil Corp. Ltd.

Indian Oil Corp. Ltd. - Overview
Indian Oil Corp. Ltd. - Business segments
Indian Oil Corp. Ltd. - Key offerings
Indian Oil Corp. Ltd. - Segment focus
SWOT

15.12 OLA Energy Holdings Ltd.

OLA Energy Holdings Ltd. - Overview
OLA Energy Holdings Ltd. - Product / Service
OLA Energy Holdings Ltd. - Key offerings
SWOT

15.13 Petro Canada

Petro Canada - Overview
Petro Canada - Product / Service
Petro Canada - Key offerings
SWOT

15.14 Petron Corp.

Petron Corp. - Overview
Petron Corp. - Product / Service
Petron Corp. - Key offerings
SWOT

15.15 Shell plc

Shell plc - Overview
Shell plc - Business segments
Shell plc - Key offerings
Shell plc - Segment focus
SWOT

15.16 TotalEnergies SE

TotalEnergies SE - Overview
TotalEnergies SE - Business segments
TotalEnergies SE - Key news
TotalEnergies SE - Key offerings
TotalEnergies SE - Segment focus
SWOT

15.17 U.S. Bancorp

U.S. Bancorp - Overview
U.S. Bancorp - Business segments
U.S. Bancorp - Key offerings
U.S. Bancorp - Segment focus
SWOT

15.18 Valero Energy Corp.

Valero Energy Corp. - Overview
Valero Energy Corp. - Business segments
Valero Energy Corp. - Key offerings
Valero Energy Corp. - Segment focus
SWOT

16. Appendix

16.1 Scope of the report

Market definition
Objectives
Notes and caveats

16.2 Inclusions and exclusions checklist

Inclusions checklist
Exclusions checklist

16.3 Currency conversion rates for US$

16.4 Research methodology

16.5 Data procurement

Information sources

16.6 Data validation

16.7 Validation techniques employed for market sizing

16.8 Data synthesis

16.9 360 degree market analysis

16.10 List of abbreviations

Research Methodology

Technavio presents a detailed picture of the market by way of study, synthesis, and summation of data from multiple sources. The analysts have presented the various facets of the market with a particular focus on identifying the key industry influencers. The data thus presented is comprehensive, reliable, and the result of extensive research, both primary and secondary.

INFORMATION SOURCES

Primary sources

  • Manufacturers and suppliers
  • Channel partners
  • Industry experts
  • Strategic decision makers

Secondary sources

  • Industry journals and periodicals
  • Government data
  • Financial reports of key industry players
  • Historical data
  • Press releases

DATA ANALYSIS

Data Synthesis

  • Collation of data
  • Estimation of key figures
  • Analysis of derived insights

Data Validation

  • Triangulation with data models
  • Reference against proprietary databases
  • Corroboration with industry experts

REPORT WRITING

Qualitative

  • Market drivers
  • Market challenges
  • Market trends
  • Five forces analysis

Quantitative

  • Market size and forecast
  • Market segmentation
  • Geographical insights
  • Competitive landscape

Interested in this report?

Get your sample now to see our research methodology and insights!

Download Now

Frequently Asked Questions

Fuel Cards market growth will increase by USD 3446.0 million during 2026-2030.

The Fuel Cards market is expected to grow at a CAGR of 6.6% during 2026-2030.

Fuel Cards market is segmented by Type (Branded, Universal, Merchant) Technology (Smart cards, Standard cards) End-user (Corporate, Individual)

Bharat Petroleum Corp. Ltd., BP Plc, China National Petroleum Corp., Comdata Inc., Corpay Inc., Exxon Mobil Corp., FirstRand Ltd., Hindustan Petroleum Corp. Ltd., Indian Oil Corp. Ltd., OLA Energy Holdings Ltd., Petro Canada, Petron Corp., Puma Energy, Radius Payment Solutions, Shell plc, TotalEnergies SE, U.S. Bancorp, Valero Energy Corp., WEX Inc. are a few of the key vendors in the Fuel Cards market.

Europe will register the highest growth rate of 37.3% among the other regions. Therefore, the Fuel Cards market in Europe is expected to garner significant business opportunities for the vendors during the forecast period.

Germany, UK, France, Italy, Spain, The Netherlands, US, Canada, Mexico, China, Japan, India, South Korea, Australia, Indonesia, Saudi Arabia, UAE, South Africa, Turkey, Israel, Brazil, Argentina, Chile

  • Surging operational cost pressures accelerating fleet demand for real time expense telematics is the driving factor this market.

The Fuel Cards market vendors should focus on grabbing business opportunities from the Type segment as it accounted for the largest market share in the base year.
RIA - Research AI Assistant
Ask RIA
