
Foundation Repair Service Market Analysis, Size, and Forecast 2026-2030: North America (US, Canada, and Mexico), Europe (Germany, UK, and France), APAC (China, Japan, and India), South America (Brazil, Argentina, and Chile), Middle East and Africa (Saudi Arabia, UAE, and South Africa), and Rest of World (ROW)

Foundation Repair Service Market Analysis, Size, and Forecast 2026-2030:
North America (US, Canada, and Mexico), Europe (Germany, UK, and France), APAC (China, Japan, and India), South America (Brazil, Argentina, and Chile), Middle East and Africa (Saudi Arabia, UAE, and South Africa), and Rest of World (ROW)

Published: Nov 2026 303 Pages SKU: IRTNTR77569

Market Overview at a Glance

$280.4 Mn
Market Opportunity
3.1%
CAGR 2025 - 2030
53.2%
North America Growth
$1.20 B
Residential segment 2024

Foundation Repair Service Market Size 2026-2030

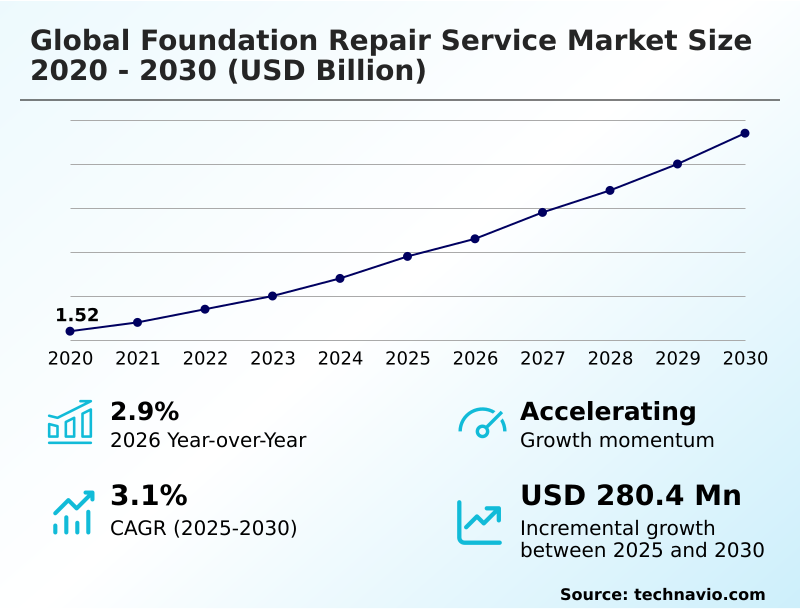
The foundation repair service market size is valued to increase by USD 280.4 million, at a CAGR of 3.1% from 2025 to 2030. Increasing residential foundation distress linked to soil movement and extreme weather conditions will drive the foundation repair service market.

Major Market Trends & Insights

  • North America dominated the market and accounted for a 53.2% growth during the forecast period.
  • By End-user - Residential segment was valued at USD 1.20 billion in 2024
  • By Type - Settlement repair segment accounted for the largest market revenue share in 2024

Market Size & Forecast

  • Market Opportunities: USD 441.8 million
  • Market Future Opportunities: USD 280.4 million
  • CAGR from 2025 to 2030 : 3.1%

Market Summary

  • The Foundation Repair Service Market is experiencing a structural shift driven by the need to preserve aging infrastructure against intensifying environmental stressors. Shifting soil moisture levels and extreme weather conditions trigger widespread foundation distress, acting as a primary catalyst for increased stabilization and structural remediation services.
  • To manage rising demand, service contractors are optimizing supply chain operations by adopting localized inventory hubs for steel piers and injection polymers, reducing project mobilization delays by 20% compared to centralized procurement models. This logistical refinement enables faster deployment during weather-induced settlement emergencies.
  • However, the sector faces a critical constraint due to skilled labor shortages and an aging workforce, which restrict operational capacity and extend project timelines. Modernizing diagnostic capabilities allows companies to deploy resources more efficiently. Automated structural assessments and data-driven moisture mapping provide precise intervention targets, minimizing unnecessary excavation.
  • The increasing focus on asset preservation forces property managers to prioritize proactive structural maintenance over reactive reconstruction, fundamentally altering service delivery frameworks.

What will be the Size of the Foundation Repair Service Market during the forecast period?
Get Key Insights on Market Forecast (PDF) Get Free Sample

How is the Foundation Repair Service Market Segmented?

The foundation repair service industry research report provides comprehensive data (region-wise segment analysis), with forecasts and estimates in "USD million" for the period 2026-2030, as well as historical data from 2020-2024 for the following segments.

  • End-user
    • Residential
    • Commercial
  • Type
    • Settlement repair
    • Wall repair
    • Chimney repair
    • Others
  • Technique
    • Underpinning
    • Piering
    • Slabjacking
    • Wall anchors
    • Others
  • Geography
    • North America
      • US
      • Canada
      • Mexico
    • Europe
      • Germany
      • UK
      • France
      • Italy
      • Spain
      • The Netherlands
    • APAC
      • China
      • Japan
      • India
      • South Korea
      • Australia
      • Indonesia
    • South America
      • Brazil
      • Argentina
      • Chile
    • Middle East and Africa
      • Saudi Arabia
      • UAE
      • South Africa
      • Turkey
      • Israel

By End-user Insights

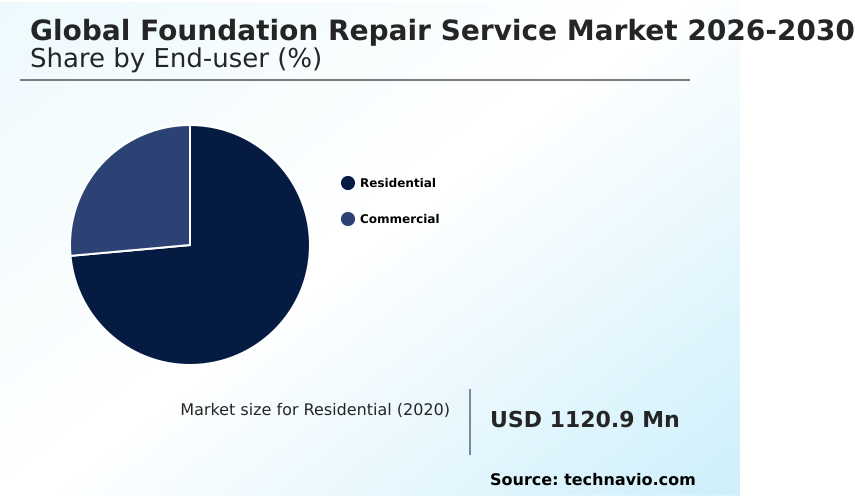
The residential segment is estimated to witness significant growth during the forecast period.

The residential segment of the global foundation repair service market 2026-2030 requires specialized intervention to counteract shifting soil profiles and weather-induced degradation. Property operators are deploying resin injection consolidation to rapidly restore asset stability without extensive excavation.

Dynamic soil compaction techniques have reduced site preparation timelines by 25% compared to traditional trenching. Advancements in geopolymer ground improvement enhance load tolerance, ensuring long-term structural integrity preservation for aging housing stocks.

Contractors increasingly utilize micro-piling techniques in constrained suburban lots where heavy machinery access remains limited. Strict foundation tilt monitoring ensures accuracy during structural load capacity testing, validating repair efficacy.

Furthermore, structural crack stitching prevents moisture ingress, reducing secondary interior damage claims by 15%. Incorporating corrosion-resistant piering alongside geotextile membrane integration improves foundation durability, lowering recurring maintenance costs and protecting the core building envelope against volatile environmental conditions.
Get Free Sample

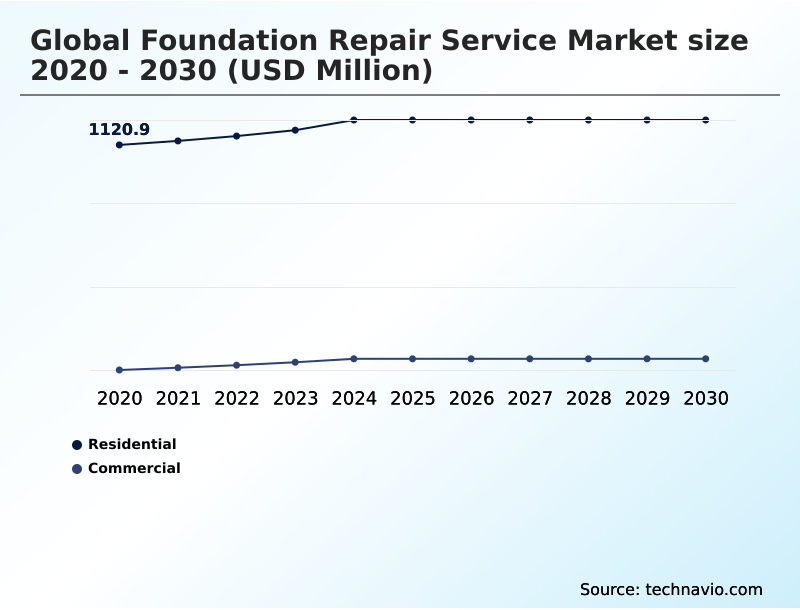
The Residential segment was valued at USD 1.20 billion in 2024 and showed a gradual increase during the forecast period.
Get Free Sample

Regional Analysis

North America is estimated to contribute 53.2% to the growth of the global market during the forecast period.Technavio’s analysts have elaborately explained the regional trends and drivers that shape the market during the forecast period.
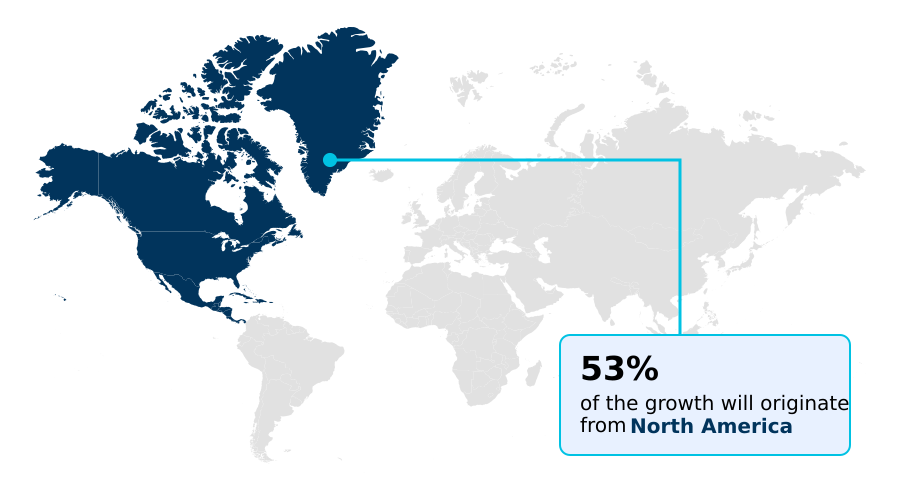
See How Foundation Repair Service Market Demand is Rising in North America Get Free Sample

The global foundation repair service market 2026-2030 demonstrates distinct operational variations between North America and Europe driven by geological factors and building stock profiles.

North America exhibits higher adoption of expansive clay remediation, experiencing a 25% higher frequency of structural failure prevention interventions compared to Europe due to extreme moisture fluctuations.

Property managers deploy subsurface drainage systems to manage hydrostatic pressure, decreasing water-induced deterioration by 18%. European operations prioritize load-bearing capacity enhancement for historical structures, utilizing strict foundation settlement monitoring protocols to preserve aging masonry.

Utilizing hydro-excavation clearance ensures safe digging around heritage utilities, while precise foundation heave correction stabilizes shifting ground. Integrating precise differential settlement correction methodologies improves structural load bearing assessment accuracy by 20% across European urban centers.

Meanwhile, North American contractors focus on sub-grade soil compaction to support modern residential developments. These geographic disparities force multinational providers to adapt their technical portfolios, balancing rapid stabilization demands with complex heritage preservation compliance requirements.

Market Dynamics

Our researchers analyzed the data with 2025 as the base year, along with the key drivers, trends, and challenges. A holistic analysis of drivers will help companies refine their marketing strategies to gain a competitive advantage.

  • Operations within the Foundation Repair Service Market depend heavily on advanced stabilization technologies to restore asset integrity and ensure compliance with municipal safety standards. As property portfolios age, facility managers increasingly rely on helical pier structural load distribution to transfer building weight onto competent soil strata, avoiding the extensive downtime associated with traditional excavation.
  • Integrating carbon fiber wall reinforcement systems into basement rehabilitation projects significantly strengthens bowing walls against lateral earth pressure. This method improves structural resilience by 30% compared to conventional steel beam bracing, accelerating supply chain material handling due to the lightweight nature of composite fabrics.
  • When addressing sunken concrete surfaces, contractors execute the polyurethane foam slabjacking injection process, which cures rapidly and reduces site disruption, enabling commercial facilities to resume normal operations faster than cementitious grouting alternatives. Addressing volatile soil conditions requires robust expansive clay soil stabilization techniques that mitigate the extreme shrinking and swelling cycles threatening foundation perimeters.
  • To protect these vulnerable structures from moisture accumulation, engineers implement comprehensive hydrostatic pressure mitigation drainage systems. Diverting groundwater away from building footings lowers the probability of moisture intrusion and subsequent material degradation. These targeted interventions allow property stakeholders to optimize long-term maintenance budgets and enhance structural reliability without replacing existing foundation assets.
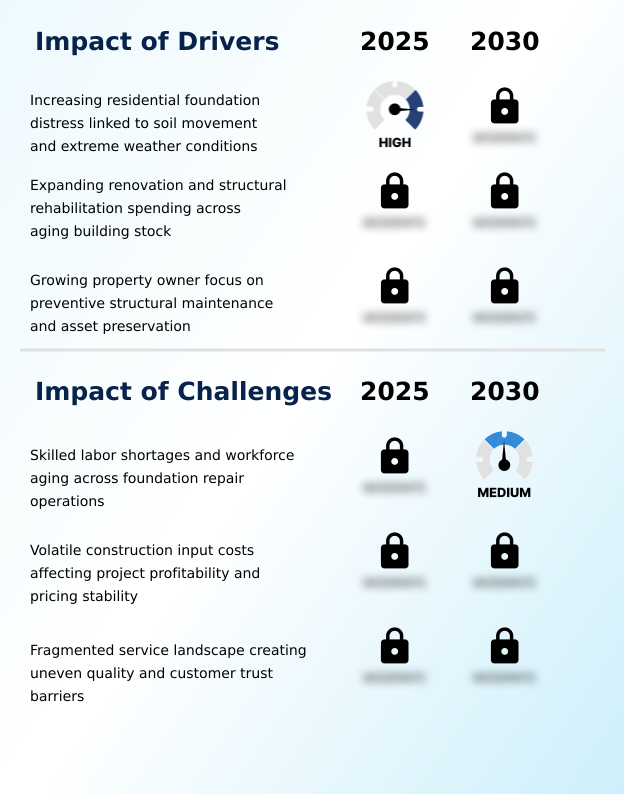
What are the key market drivers leading to the rise in the adoption of Foundation Repair Service Industry?

  • The increasing prevalence of residential foundation distress, primarily linked to soil movement and extreme weather conditions, serves as the primary driver propelling market expansion.

  • Escalating climate volatility and extreme soil moisture fluctuation are forcing property owners to prioritize proactive foundation maintenance across aging infrastructure.
  • Intense drought and rainfall cycles exacerbate lateral earth pressure against basement walls, accelerating the need for high-tensile carbon fiber wall reinforcement. These environmental stressors drive a 30% increase in demand for comprehensive geotechnical site evaluation to assess structural vulnerabilities accurately.
  • Implementing stringent capillary moisture control, foundation moisture management, and hydrostatic pressure mitigation strategies has reduced secondary water damage incidents by 22%. To combat rapid structural degradation, contractors utilize epoxy crack injection to provide immediate structural stress relief, restoring concrete integrity.
  • By addressing these moisture-induced vulnerabilities early, facility managers lower long-term structural repair costs by 15%, ensuring robust asset preservation in increasingly unpredictable environmental conditions.

What are the market trends shaping the Foundation Repair Service Industry?

  • The increasing adoption of AI-enabled inspection and foundation assessment technologies has emerged as a prominent trend within the industry. This shift enhances diagnostic accuracy and supports predictive structural maintenance strategies.

  • The integration of digital diagnostic tools fundamentally alters how contractors execute the global foundation repair service market 2026-2030 operations. Advanced settlement progression analysis allows engineers to identify micro-fractures before catastrophic failures occur, reducing diagnostic errors by 18%. This predictive capability directly optimizes non-invasive structural lifting procedures, decreasing property downtime by 25% for commercial clients.
  • As AI-driven assessments refine load distribution engineering, contractors can precisely calibrate underpinning load transfer requirements, minimizing unnecessary material waste. The transition toward data-backed soil stabilization mechanisms ensures that interventions like polyurethane foam injection, vibro-compaction ground reinforcement, and automated foundation void filling are targeted accurately. Consequently, precision helical pier installation timelines have improved by 20%, significantly enhancing labor utilization.
  • These technological shifts allow service providers to align repair strategies with stringent safety compliance while maximizing project efficiency.

What challenges does the Foundation Repair Service Industry face during its growth?

  • Persistent skilled labor shortages and an aging workforce across foundation repair operations represent key challenges that currently constrain industry capacity and execution efficiency.

  • Severe skilled labor shortages and escalating material costs severely constrain operational execution within the global foundation repair service market 2026-2030. The deficit of experienced technicians capable of managing complex deep foundation anchoring and subsurface void detection extends average project completion timelines by 20%.
  • Specialized tasks, such as precise structural alignment restoration, structural settling mitigation, and seismic foundation retrofitting, require years of field training, limiting contractor capacity during peak demand periods. Furthermore, volatile pricing for steel push piers and polymers used in slabjacking leveling processes has increased procurement expenses by 15%, compressing profit margins.
  • Installing moisture intrusion barriers and executing delicate concrete spalling remediation are frequently delayed, threatening overall building envelope integrity. These workforce and supply chain bottlenecks force repair companies to heavily invest in automated training protocols to mitigate critical operational inefficiencies.

Exclusive Technavio Analysis on Customer Landscape

The foundation repair service market forecasting report includes the adoption lifecycle of the market, covering from the innovator’s stage to the laggard’s stage. It focuses on adoption rates in different regions based on penetration. Furthermore, the foundation repair service market report also includes key purchase criteria and drivers of price sensitivity to help companies evaluate and develop their market growth analysis strategies.
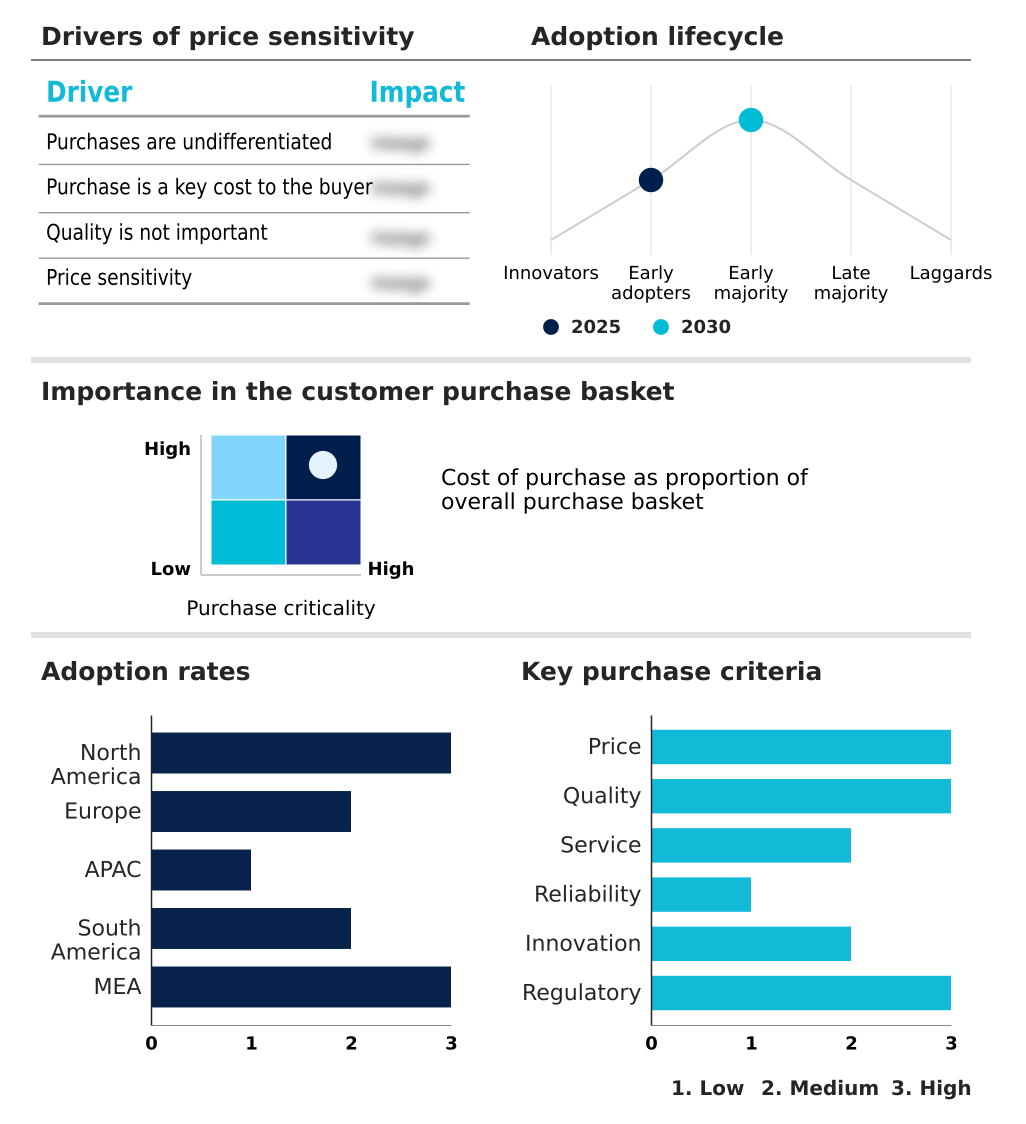
Customer Landscape of Foundation Repair Service Industry

Competitive Landscape

Companies are implementing various strategies, such as strategic alliances, foundation repair service market forecast, partnerships, mergers and acquisitions, geographical expansion, and product/service launches, to enhance their presence in the industry.

A 1 Concrete Leveling LLC - The service provider delivers specialized residential foundation stabilization, concrete lifting, and advanced basement waterproofing solutions to restore structural stability and prevent long-term moisture degradation in aging properties.

The industry research and growth report includes detailed analyses of the competitive landscape of the market and information about key companies, including:

  • A 1 Concrete Leveling LLC
  • Acculevel Inc.
  • B DRY Systems Inc.
  • Baird Foundation Repair Inc.
  • Geobear US Inc.
  • GoliathTech Inc.
  • Grip Tite Manufacturing Co.
  • Groundworks LLC
  • Helitech LLC
  • Hubbell Inc.
  • Keller Group Plc
  • Magnum Piering Inc.
  • Mainmark Ground Engineering Ltd
  • Menard Group
  • Olshan Foundation Solutions
  • Ram Jack Systems Distribution
  • Soletanche Bachy
  • Stabil Loc Foundation Repair Inc.
  • Supportworks Inc.
  • URETEK USA

Qualitative and quantitative analysis of companies has been conducted to help clients understand the wider business environment as well as the strengths and weaknesses of key industry players. Data is qualitatively analyzed to categorize companies as pure play, category-focused, industry-focused, and diversified; it is quantitatively analyzed to categorize companies as dominant, leading, strong, tentative, and weak.

Recent Development and News in Foundation repair service market

  • In the Specialized Consumer Services industry, stringent building code updates regarding structural load limits have mandated stricter inspection protocols, directly impacting foundation repair service demand by increasing the adoption of advanced piering systems by 22%.
  • The integration of drone-assisted property assessments and automated structural diagnostics has reduced evaluation times, accelerating service deployment workflows and driving a 15% increase in preventive foundation repair service contracts.
  • Rising insurance premium thresholds for climate-vulnerable properties have forced homeowners to adopt proactive subsidence mitigation strategies, directly expanding foundation repair service utilization across high-risk expansive clay zones.
  • Labor shortages across trade-dependent consumer service sectors have catalyzed the shift toward automated polyurethane injection equipment, improving on-site application efficiency by 30% and reshaping operational delivery models within foundation repair service ecosystems.

Dive into Technavio’s robust research methodology, blending expert interviews, extensive data synthesis, and validated models for unparalleled Foundation Repair Service Market insights. See full methodology.

Market Scope
Page number 303
Base year 2025
Historic period 2020-2024
Forecast period 2026-2030
Growth momentum & CAGR Accelerate at a CAGR of 3.1%
Market growth 2026-2030 USD 280.4 million
Market structure Fragmented
YoY growth 2025-2026(%) 2.9%
Key countries US, Canada, Mexico, Germany, UK, France, Italy, Spain, The Netherlands, China, Japan, India, South Korea, Australia, Indonesia, Brazil, Argentina, Chile, Saudi Arabia, UAE, South Africa, Turkey and Israel
Competitive landscape Leading Companies, Market Positioning of Companies, Competitive Strategies, and Industry Risks

Request Free Sample

Research Analyst Overview

  • The global foundation repair service market 2026-2030 demands rigorous engineering approaches to address complex building settlement and structural degradation. Companies are optimizing procurement strategies by investing in specialized stabilization mechanisms that address unpredictable geological shifts.
  • The increasing adoption of advanced piering allows contractors to execute precise load transfer protocols, achieving a 30% reduction in on-site labor hours compared to traditional concrete shoring. This efficiency gain enables property stakeholders to redirect maintenance budgets toward broader compliance and safety upgrades.
  • Firms are also prioritizing rapid-cure polymer injection to correct slab displacement, significantly minimizing operational downtime for commercial tenants. Furthermore, strategic integration of composite wall reinforcement provides superior tensile strength for compromised basements, effectively replacing bulky steel alternatives. Addressing subsurface water accumulation through proactive pressure mitigation has decreased recurring structural damage claims by 25%.
  • Detailed site evaluation processes now inform targeted crack injection protocols, ensuring that remediation strategies align strictly with evolving municipal building codes and long-term asset preservation goals.

What are the Key Data Covered in this Foundation Repair Service Market Research and Growth Report?

  • What is the expected growth of the Foundation Repair Service Market between 2026 and 2030?

    • USD 280.4 million, at a CAGR of 3.1%

  • What segmentation does the market report cover?

    • The report is segmented by End-user (Residential, and Commercial), Type (Settlement repair, Wall repair, Chimney repair, and Others), Technique (Underpinning, Piering, Slabjacking, Wall anchors, and Others) and Geography (North America, Europe, APAC, South America, Middle East and Africa)

  • Which regions are analyzed in the report?

    • North America, Europe, APAC, South America and Middle East and Africa

  • What are the key growth drivers and market challenges?

    • Increasing residential foundation distress linked to soil movement and extreme weather conditions, Skilled labor shortages and workforce aging across foundation repair operations

  • Who are the major players in the Foundation Repair Service Market?

    • A 1 Concrete Leveling LLC, Acculevel Inc., B DRY Systems Inc., Baird Foundation Repair Inc., Geobear US Inc., GoliathTech Inc., Grip Tite Manufacturing Co., Groundworks LLC, Helitech LLC, Hubbell Inc., Keller Group Plc, Magnum Piering Inc., Mainmark Ground Engineering Ltd, Menard Group, Olshan Foundation Solutions, Ram Jack Systems Distribution, Soletanche Bachy, Stabil Loc Foundation Repair Inc., Supportworks Inc. and URETEK USA

Market Research Insights

  • The Foundation Repair Service Market relies on specialized stabilization engineering to correct property settlement with minimal disruption. Advances in load distribution methodologies have improved long-term stability, reducing recurring foundation failures by 18% across commercial portfolios. Implementing automated void filling techniques accelerates project completion rates by 22% compared to traditional manual grouting.
  • Service providers utilize precision equipment for targeted stress relief, lowering operational overhead. By integrating advanced moisture control protocols, structural deterioration rates drop by 15%, ensuring robust asset preservation. These technical refinements allow property managers to address complex structural deficiencies proactively, aligning remediation efforts with stringent safety compliance standards while optimizing total maintenance expenditures.

We can help! Our analysts can customize this foundation repair service market research report to meet your requirements.

Get in touch

1. Executive Summary

1.1 Market overview

Executive Summary - Chart on Market Overview
Executive Summary - Data Table on Market Overview
Executive Summary - Chart on Global Market Characteristics
Executive Summary - Chart on Market by Geography
Executive Summary - Chart on Market Segmentation by End-user
Executive Summary - Chart on Market Segmentation by Type
Executive Summary - Chart on Market Segmentation by Technique
Executive Summary - Chart on Incremental Growth
Executive Summary - Data Table on Incremental Growth
Executive Summary - Chart on Company Market Positioning

2. Technavio Analysis

2.1 Analysis of price sensitivity, lifecycle, customer purchase basket, adoption rates, and purchase criteria

2.2 Criticality of inputs and Factors of differentiation

Chart on Overview on criticality of inputs and factors of differentiation

2.3 Factors of disruption

Chart on Overview on factors of disruption

2.4 Impact of drivers and challenges

Chart on Impact of drivers and challenges in 2025 and 2030

3. Market Landscape

3.1 Market ecosystem

Chart on Parent Market
Data Table on - Parent Market

3.2 Market characteristics

Chart on Market characteristics analysis

3.3 Value chain analysis

Chart on Value chain analysis

4. Market Sizing

4.1 Market definition

Data Table on Offerings of companies included in the market definition

4.2 Market segment analysis

Market segments

4.3 Market size 2025

4.4 Market outlook: Forecast for 2025-2030

Chart on Global - Market size and forecast 2025-2030 ($ million)
Data Table on Global - Market size and forecast 2025-2030 ($ million)
Chart on Global Market: Year-over-year growth 2025-2030 (%)
Data Table on Global Market: Year-over-year growth 2025-2030 (%)

5. Historic Market Size

5.1 Global Foundation Repair Service Market 2020 - 2024

Historic Market Size - Data Table on Global Foundation Repair Service Market 2020 - 2024 ($ million)

5.2 End-user segment analysis 2020 - 2024

Historic Market Size - End-user Segment 2020 - 2024 ($ million)

5.3 Type segment analysis 2020 - 2024

Historic Market Size - Type Segment 2020 - 2024 ($ million)

5.4 Technique segment analysis 2020 - 2024

Historic Market Size - Technique Segment 2020 - 2024 ($ million)

5.5 Geography segment analysis 2020 - 2024

Historic Market Size - Geography Segment 2020 - 2024 ($ million)

5.6 Country segment analysis 2020 - 2024

Historic Market Size - Country Segment 2020 - 2024 ($ million)

6. Qualitative Analysis

6.1 Impact of AI on global foundation repair service market

6.2 Impact of geopolitical conflicts on global foundation repair service market

7. Five Forces Analysis

7.1 Five forces summary

Five forces analysis - Comparison between 2025 and 2030

7.2 Bargaining power of buyers

Bargaining power of buyers - Impact of key factors 2025 and 2030

7.3 Bargaining power of suppliers

Bargaining power of suppliers - Impact of key factors in 2025 and 2030

7.4 Threat of new entrants

Threat of new entrants - Impact of key factors in 2025 and 2030

7.5 Threat of substitutes

Threat of substitutes - Impact of key factors in 2025 and 2030

7.6 Threat of rivalry

Threat of rivalry - Impact of key factors in 2025 and 2030

7.7 Market condition

Chart on Market condition - Five forces 2025 and 2030

8. Market Segmentation by End-user

8.1 Market segments

Chart on End-user - Market share 2025-2030 (%)
Data Table on End-user - Market share 2025-2030 (%)

8.2 Comparison by End-user

Chart on Comparison by End-user
Data Table on Comparison by End-user

8.3 Residential - Market size and forecast 2025-2030

Chart on Residential - Market size and forecast 2025-2030 ($ million)
Data Table on Residential - Market size and forecast 2025-2030 ($ million)
Chart on Residential - Year-over-year growth 2025-2030 (%)
Data Table on Residential - Year-over-year growth 2025-2030 (%)

8.4 Commercial - Market size and forecast 2025-2030

Chart on Commercial - Market size and forecast 2025-2030 ($ million)
Data Table on Commercial - Market size and forecast 2025-2030 ($ million)
Chart on Commercial - Year-over-year growth 2025-2030 (%)
Data Table on Commercial - Year-over-year growth 2025-2030 (%)

8.5 Market opportunity by End-user

Market opportunity by End-user ($ million)
Data Table on Market opportunity by End-user ($ million)

9. Market Segmentation by Type

9.1 Market segments

Chart on Type - Market share 2025-2030 (%)
Data Table on Type - Market share 2025-2030 (%)

9.2 Comparison by Type

Chart on Comparison by Type
Data Table on Comparison by Type

9.3 Settlement repair - Market size and forecast 2025-2030

Chart on Settlement repair - Market size and forecast 2025-2030 ($ million)
Data Table on Settlement repair - Market size and forecast 2025-2030 ($ million)
Chart on Settlement repair - Year-over-year growth 2025-2030 (%)
Data Table on Settlement repair - Year-over-year growth 2025-2030 (%)

9.4 Wall repair - Market size and forecast 2025-2030

Chart on Wall repair - Market size and forecast 2025-2030 ($ million)
Data Table on Wall repair - Market size and forecast 2025-2030 ($ million)
Chart on Wall repair - Year-over-year growth 2025-2030 (%)
Data Table on Wall repair - Year-over-year growth 2025-2030 (%)

9.5 Chimney repair - Market size and forecast 2025-2030

Chart on Chimney repair - Market size and forecast 2025-2030 ($ million)
Data Table on Chimney repair - Market size and forecast 2025-2030 ($ million)
Chart on Chimney repair - Year-over-year growth 2025-2030 (%)
Data Table on Chimney repair - Year-over-year growth 2025-2030 (%)

9.6 Others - Market size and forecast 2025-2030

Chart on Others - Market size and forecast 2025-2030 ($ million)
Data Table on Others - Market size and forecast 2025-2030 ($ million)
Chart on Others - Year-over-year growth 2025-2030 (%)
Data Table on Others - Year-over-year growth 2025-2030 (%)

9.7 Market opportunity by Type

Market opportunity by Type ($ million)
Data Table on Market opportunity by Type ($ million)

10. Market Segmentation by Technique

10.1 Market segments

Chart on Technique - Market share 2025-2030 (%)
Data Table on Technique - Market share 2025-2030 (%)

10.2 Comparison by Technique

Chart on Comparison by Technique
Data Table on Comparison by Technique

10.3 Underpinning - Market size and forecast 2025-2030

Chart on Underpinning - Market size and forecast 2025-2030 ($ million)
Data Table on Underpinning - Market size and forecast 2025-2030 ($ million)
Chart on Underpinning - Year-over-year growth 2025-2030 (%)
Data Table on Underpinning - Year-over-year growth 2025-2030 (%)

10.4 Piering - Market size and forecast 2025-2030

Chart on Piering - Market size and forecast 2025-2030 ($ million)
Data Table on Piering - Market size and forecast 2025-2030 ($ million)
Chart on Piering - Year-over-year growth 2025-2030 (%)
Data Table on Piering - Year-over-year growth 2025-2030 (%)

10.5 Slabjacking - Market size and forecast 2025-2030

Chart on Slabjacking - Market size and forecast 2025-2030 ($ million)
Data Table on Slabjacking - Market size and forecast 2025-2030 ($ million)
Chart on Slabjacking - Year-over-year growth 2025-2030 (%)
Data Table on Slabjacking - Year-over-year growth 2025-2030 (%)

10.6 Wall anchors - Market size and forecast 2025-2030

Chart on Wall anchors - Market size and forecast 2025-2030 ($ million)
Data Table on Wall anchors - Market size and forecast 2025-2030 ($ million)
Chart on Wall anchors - Year-over-year growth 2025-2030 (%)
Data Table on Wall anchors - Year-over-year growth 2025-2030 (%)

10.7 Others - Market size and forecast 2025-2030

Chart on Others - Market size and forecast 2025-2030 ($ million)
Data Table on Others - Market size and forecast 2025-2030 ($ million)
Chart on Others - Year-over-year growth 2025-2030 (%)
Data Table on Others - Year-over-year growth 2025-2030 (%)

10.8 Market opportunity by Technique

Market opportunity by Technique ($ million)
Data Table on Market opportunity by Technique ($ million)

11. Customer Landscape

11.1 Customer landscape overview

Analysis of price sensitivity, lifecycle, customer purchase basket, adoption rates, and purchase criteria

12. Geographic Landscape

12.1 Geographic segmentation

Chart on Market share by geography 2025-2030 (%)
Data Table on Market share by geography 2025-2030 (%)

12.2 Geographic comparison

Chart on Geographic comparison
Data Table on Geographic comparison

12.3 North America - Market size and forecast 2025-2030

Chart on North America - Market size and forecast 2025-2030 ($ million)
Data Table on North America - Market size and forecast 2025-2030 ($ million)
Chart on North America - Year-over-year growth 2025-2030 (%)
Data Table on North America - Year-over-year growth 2025-2030 (%)
Chart on Regional Comparison - North America
Data Table on Regional Comparison - North America

12.3.1 US - Market size and forecast 2025-2030

Chart on US - Market size and forecast 2025-2030 ($ million)
Data Table on US - Market size and forecast 2025-2030 ($ million)
Chart on US - Year-over-year growth 2025-2030 (%)
Data Table on US - Year-over-year growth 2025-2030 (%)

12.3.2 Canada - Market size and forecast 2025-2030

Chart on Canada - Market size and forecast 2025-2030 ($ million)
Data Table on Canada - Market size and forecast 2025-2030 ($ million)
Chart on Canada - Year-over-year growth 2025-2030 (%)
Data Table on Canada - Year-over-year growth 2025-2030 (%)

12.3.3 Mexico - Market size and forecast 2025-2030

Chart on Mexico - Market size and forecast 2025-2030 ($ million)
Data Table on Mexico - Market size and forecast 2025-2030 ($ million)
Chart on Mexico - Year-over-year growth 2025-2030 (%)
Data Table on Mexico - Year-over-year growth 2025-2030 (%)

12.4 Europe - Market size and forecast 2025-2030

Chart on Europe - Market size and forecast 2025-2030 ($ million)
Data Table on Europe - Market size and forecast 2025-2030 ($ million)
Chart on Europe - Year-over-year growth 2025-2030 (%)
Data Table on Europe - Year-over-year growth 2025-2030 (%)
Chart on Regional Comparison - Europe
Data Table on Regional Comparison - Europe

12.4.1 Germany - Market size and forecast 2025-2030

Chart on Germany - Market size and forecast 2025-2030 ($ million)
Data Table on Germany - Market size and forecast 2025-2030 ($ million)
Chart on Germany - Year-over-year growth 2025-2030 (%)
Data Table on Germany - Year-over-year growth 2025-2030 (%)

12.4.2 UK - Market size and forecast 2025-2030

Chart on UK - Market size and forecast 2025-2030 ($ million)
Data Table on UK - Market size and forecast 2025-2030 ($ million)
Chart on UK - Year-over-year growth 2025-2030 (%)
Data Table on UK - Year-over-year growth 2025-2030 (%)

12.4.3 France - Market size and forecast 2025-2030

Chart on France - Market size and forecast 2025-2030 ($ million)
Data Table on France - Market size and forecast 2025-2030 ($ million)
Chart on France - Year-over-year growth 2025-2030 (%)
Data Table on France - Year-over-year growth 2025-2030 (%)

12.4.4 Italy - Market size and forecast 2025-2030

Chart on Italy - Market size and forecast 2025-2030 ($ million)
Data Table on Italy - Market size and forecast 2025-2030 ($ million)
Chart on Italy - Year-over-year growth 2025-2030 (%)
Data Table on Italy - Year-over-year growth 2025-2030 (%)

12.4.5 Spain - Market size and forecast 2025-2030

Chart on Spain - Market size and forecast 2025-2030 ($ million)
Data Table on Spain - Market size and forecast 2025-2030 ($ million)
Chart on Spain - Year-over-year growth 2025-2030 (%)
Data Table on Spain - Year-over-year growth 2025-2030 (%)

12.4.6 The Netherlands - Market size and forecast 2025-2030

Chart on The Netherlands - Market size and forecast 2025-2030 ($ million)
Data Table on The Netherlands - Market size and forecast 2025-2030 ($ million)
Chart on The Netherlands - Year-over-year growth 2025-2030 (%)
Data Table on The Netherlands - Year-over-year growth 2025-2030 (%)

12.5 APAC - Market size and forecast 2025-2030

Chart on APAC - Market size and forecast 2025-2030 ($ million)
Data Table on APAC - Market size and forecast 2025-2030 ($ million)
Chart on APAC - Year-over-year growth 2025-2030 (%)
Data Table on APAC - Year-over-year growth 2025-2030 (%)
Chart on Regional Comparison - APAC
Data Table on Regional Comparison - APAC

12.5.1 China - Market size and forecast 2025-2030

Chart on China - Market size and forecast 2025-2030 ($ million)
Data Table on China - Market size and forecast 2025-2030 ($ million)
Chart on China - Year-over-year growth 2025-2030 (%)
Data Table on China - Year-over-year growth 2025-2030 (%)

12.5.2 Japan - Market size and forecast 2025-2030

Chart on Japan - Market size and forecast 2025-2030 ($ million)
Data Table on Japan - Market size and forecast 2025-2030 ($ million)
Chart on Japan - Year-over-year growth 2025-2030 (%)
Data Table on Japan - Year-over-year growth 2025-2030 (%)

12.5.3 India - Market size and forecast 2025-2030

Chart on India - Market size and forecast 2025-2030 ($ million)
Data Table on India - Market size and forecast 2025-2030 ($ million)
Chart on India - Year-over-year growth 2025-2030 (%)
Data Table on India - Year-over-year growth 2025-2030 (%)

12.5.4 South Korea - Market size and forecast 2025-2030

Chart on South Korea - Market size and forecast 2025-2030 ($ million)
Data Table on South Korea - Market size and forecast 2025-2030 ($ million)
Chart on South Korea - Year-over-year growth 2025-2030 (%)
Data Table on South Korea - Year-over-year growth 2025-2030 (%)

12.5.5 Australia - Market size and forecast 2025-2030

Chart on Australia - Market size and forecast 2025-2030 ($ million)
Data Table on Australia - Market size and forecast 2025-2030 ($ million)
Chart on Australia - Year-over-year growth 2025-2030 (%)
Data Table on Australia - Year-over-year growth 2025-2030 (%)

12.5.6 Indonesia - Market size and forecast 2025-2030

Chart on Indonesia - Market size and forecast 2025-2030 ($ million)
Data Table on Indonesia - Market size and forecast 2025-2030 ($ million)
Chart on Indonesia - Year-over-year growth 2025-2030 (%)
Data Table on Indonesia - Year-over-year growth 2025-2030 (%)

12.6 South America - Market size and forecast 2025-2030

Chart on South America - Market size and forecast 2025-2030 ($ million)
Data Table on South America - Market size and forecast 2025-2030 ($ million)
Chart on South America - Year-over-year growth 2025-2030 (%)
Data Table on South America - Year-over-year growth 2025-2030 (%)
Chart on Regional Comparison - South America
Data Table on Regional Comparison - South America

12.6.1 Brazil - Market size and forecast 2025-2030

Chart on Brazil - Market size and forecast 2025-2030 ($ million)
Data Table on Brazil - Market size and forecast 2025-2030 ($ million)
Chart on Brazil - Year-over-year growth 2025-2030 (%)
Data Table on Brazil - Year-over-year growth 2025-2030 (%)

12.6.2 Argentina - Market size and forecast 2025-2030

Chart on Argentina - Market size and forecast 2025-2030 ($ million)
Data Table on Argentina - Market size and forecast 2025-2030 ($ million)
Chart on Argentina - Year-over-year growth 2025-2030 (%)
Data Table on Argentina - Year-over-year growth 2025-2030 (%)

12.6.3 Chile - Market size and forecast 2025-2030

Chart on Chile - Market size and forecast 2025-2030 ($ million)
Data Table on Chile - Market size and forecast 2025-2030 ($ million)
Chart on Chile - Year-over-year growth 2025-2030 (%)
Data Table on Chile - Year-over-year growth 2025-2030 (%)

12.7 Middle East and Africa - Market size and forecast 2025-2030

Chart on Middle East and Africa - Market size and forecast 2025-2030 ($ million)
Data Table on Middle East and Africa - Market size and forecast 2025-2030 ($ million)
Chart on Middle East and Africa - Year-over-year growth 2025-2030 (%)
Data Table on Middle East and Africa - Year-over-year growth 2025-2030 (%)
Chart on Regional Comparison - Middle East and Africa
Data Table on Regional Comparison - Middle East and Africa

12.7.1 Saudi Arabia - Market size and forecast 2025-2030

Chart on Saudi Arabia - Market size and forecast 2025-2030 ($ million)
Data Table on Saudi Arabia - Market size and forecast 2025-2030 ($ million)
Chart on Saudi Arabia - Year-over-year growth 2025-2030 (%)
Data Table on Saudi Arabia - Year-over-year growth 2025-2030 (%)

12.7.2 UAE - Market size and forecast 2025-2030

Chart on UAE - Market size and forecast 2025-2030 ($ million)
Data Table on UAE - Market size and forecast 2025-2030 ($ million)
Chart on UAE - Year-over-year growth 2025-2030 (%)
Data Table on UAE - Year-over-year growth 2025-2030 (%)

12.7.3 South Africa - Market size and forecast 2025-2030

Chart on South Africa - Market size and forecast 2025-2030 ($ million)
Data Table on South Africa - Market size and forecast 2025-2030 ($ million)
Chart on South Africa - Year-over-year growth 2025-2030 (%)
Data Table on South Africa - Year-over-year growth 2025-2030 (%)

12.7.4 Turkey - Market size and forecast 2025-2030

Chart on Turkey - Market size and forecast 2025-2030 ($ million)
Data Table on Turkey - Market size and forecast 2025-2030 ($ million)
Chart on Turkey - Year-over-year growth 2025-2030 (%)
Data Table on Turkey - Year-over-year growth 2025-2030 (%)

12.7.5 Israel - Market size and forecast 2025-2030

Chart on Israel - Market size and forecast 2025-2030 ($ million)
Data Table on Israel - Market size and forecast 2025-2030 ($ million)
Chart on Israel - Year-over-year growth 2025-2030 (%)
Data Table on Israel - Year-over-year growth 2025-2030 (%)

12.8 Market opportunity by geography

Market opportunity by geography ($ million)
Data Tables on Market opportunity by geography ($ million)

13. Drivers, Challenges, and Opportunity

13.1 Market drivers

Increasing residential foundation distress linked to soil movement and extreme weather conditions
Expanding renovation and structural rehabilitation spending across aging building stock
Growing property owner focus on preventive structural maintenance and asset preservation

13.2 Market challenges

Skilled labor shortages and workforce aging across foundation repair operations
Volatile construction input costs affecting project profitability and pricing stability
Fragmented service landscape creating uneven quality and customer trust barriers

13.3 Impact of drivers and challenges

Impact of drivers and challenges in 2025 and 2030

13.4 Market opportunities

Increasing adoption of AI-enabled inspection and foundation assessment technologies
Expanding use of helical pier systems and minimally invasive repair methodologies
Evolving digital customer engagement through remote diagnostics and project monitoring

14. Competitive Landscape

14.1 Overview

14.2

Overview on criticality of inputs and factors of differentiation

14.3 Landscape disruption

Overview on factors of disruption

14.4 Industry risks

Impact of key risks on business

15. Competitive Analysis

15.1 Companies profiled

Companies covered

15.2 Company ranking index

15.3 Market positioning of companies

Matrix on companies position and classification

15.4 A 1 Concrete Leveling LLC

A 1 Concrete Leveling LLC - Overview
A 1 Concrete Leveling LLC - Product / Service
A 1 Concrete Leveling LLC - Key offerings
SWOT

15.5 Acculevel Inc.

Acculevel Inc. - Overview
Acculevel Inc. - Product / Service
Acculevel Inc. - Key offerings
SWOT

15.6 B DRY Systems Inc.

B DRY Systems Inc. - Overview
B DRY Systems Inc. - Product / Service
B DRY Systems Inc. - Key offerings
SWOT

15.7 Baird Foundation Repair Inc.

Baird Foundation Repair Inc. - Overview
Baird Foundation Repair Inc. - Product / Service
Baird Foundation Repair Inc. - Key offerings
SWOT

15.8 GoliathTech Inc.

GoliathTech Inc. - Overview
GoliathTech Inc. - Product / Service
GoliathTech Inc. - Key offerings
SWOT

15.9 Groundworks LLC

Groundworks LLC - Overview
Groundworks LLC - Product / Service
Groundworks LLC - Key offerings
SWOT

15.10 Hubbell Inc.

Hubbell Inc. - Overview
Hubbell Inc. - Business segments
Hubbell Inc. - Key offerings
Hubbell Inc. - Segment focus
SWOT

15.11 Keller Group Plc

Keller Group Plc - Overview
Keller Group Plc - Business segments
Keller Group Plc - Key offerings
Keller Group Plc - Segment focus
SWOT

15.12 Magnum Piering Inc.

Magnum Piering Inc. - Overview
Magnum Piering Inc. - Product / Service
Magnum Piering Inc. - Key offerings
SWOT

15.13 Mainmark Ground Engineering Ltd

Mainmark Ground Engineering Ltd - Overview
Mainmark Ground Engineering Ltd - Product / Service
Mainmark Ground Engineering Ltd - Key offerings
SWOT

15.14 Menard Group

Menard Group - Overview
Menard Group - Product / Service
Menard Group - Key offerings
SWOT

15.15 Olshan Foundation Solutions

Olshan Foundation Solutions - Overview
Olshan Foundation Solutions - Product / Service
Olshan Foundation Solutions - Key offerings
SWOT

15.16 Ram Jack Systems Distribution

Ram Jack Systems Distribution - Overview
Ram Jack Systems Distribution - Product / Service
Ram Jack Systems Distribution - Key offerings
SWOT

15.17 Soletanche Bachy

Soletanche Bachy - Overview
Soletanche Bachy - Product / Service
Soletanche Bachy - Key offerings
SWOT

15.18 Supportworks Inc.

Supportworks Inc. - Overview
Supportworks Inc. - Product / Service
Supportworks Inc. - Key offerings
SWOT

16. Appendix

16.1 Scope of the report

Market definition
Objectives
Notes and caveats

16.2 Inclusions and exclusions checklist

Inclusions checklist
Exclusions checklist

16.3 Currency conversion rates for US$

16.4 Research methodology

16.5 Data procurement

Information sources

16.6 Data validation

16.7 Validation techniques employed for market sizing

16.8 Data synthesis

16.9 360 degree market analysis

16.10 List of abbreviations

Research Methodology

Technavio presents a detailed picture of the market by way of study, synthesis, and summation of data from multiple sources. The analysts have presented the various facets of the market with a particular focus on identifying the key industry influencers. The data thus presented is comprehensive, reliable, and the result of extensive research, both primary and secondary.

INFORMATION SOURCES

Primary sources

  • Manufacturers and suppliers
  • Channel partners
  • Industry experts
  • Strategic decision makers

Secondary sources

  • Industry journals and periodicals
  • Government data
  • Financial reports of key industry players
  • Historical data
  • Press releases

DATA ANALYSIS

Data Synthesis

  • Collation of data
  • Estimation of key figures
  • Analysis of derived insights

Data Validation

  • Triangulation with data models
  • Reference against proprietary databases
  • Corroboration with industry experts

REPORT WRITING

Qualitative

  • Market drivers
  • Market challenges
  • Market trends
  • Five forces analysis

Quantitative

  • Market size and forecast
  • Market segmentation
  • Geographical insights
  • Competitive landscape

Interested in this report?

Get your sample now to see our research methodology and insights!

Download Now

Frequently Asked Questions

Foundation Repair Service market growth will increase by USD 280.4 million during 2026-2030.

The Foundation Repair Service market is expected to grow at a CAGR of 3.1% during 2026-2030.

Foundation Repair Service market is segmented by End-user (Residential, Commercial) Type (Settlement repair, Wall repair, Chimney repair, Others) Technique (Underpinning, Piering, Slabjacking, Wall anchors, Others)

A 1 Concrete Leveling LLC, Acculevel Inc., B DRY Systems Inc., Baird Foundation Repair Inc., Geobear US Inc., GoliathTech Inc., Grip Tite Manufacturing Co., Groundworks LLC, Helitech LLC, Hubbell Inc., Keller Group Plc, Magnum Piering Inc., Mainmark Ground Engineering Ltd, Menard Group, Olshan Foundation Solutions, Ram Jack Systems Distribution, Soletanche Bachy, Stabil Loc Foundation Repair Inc., Supportworks Inc., URETEK USA are a few of the key vendors in the Foundation Repair Service market.

North America will register the highest growth rate of 53.2% among the other regions. Therefore, the Foundation Repair Service market in North America is expected to garner significant business opportunities for the vendors during the forecast period.

US, Canada, Mexico, Germany, UK, France, Italy, Spain, The Netherlands, China, Japan, India, South Korea, Australia, Indonesia, Brazil, Argentina, Chile, Saudi Arabia, UAE, South Africa, Turkey, Israel

  • Increasing residential foundation distress linked to soil movement and extreme weather conditions is the driving factor this market.

The Foundation Repair Service market vendors should focus on grabbing business opportunities from the End-user segment as it accounted for the largest market share in the base year.
RIA - Research AI Assistant
Ask RIA
