Floating LNG Power Vessel Market Analysis, Size, and Forecast 2026-2030: APAC (China, Indonesia, and Japan), Middle East and Africa (Saudi Arabia, UAE, and Turkey), Europe (Germany, UK, and France), North America (US, Canada, and Mexico), South America (Brazil, Argentina, and Chile), and Rest of World (ROW)

Floating LNG Power Vessel Market Analysis, Size, and Forecast 2026-2030:
APAC (China, Indonesia, and Japan), Middle East and Africa (Saudi Arabia, UAE, and Turkey), Europe (Germany, UK, and France), North America (US, Canada, and Mexico), South America (Brazil, Argentina, and Chile), and Rest of World (ROW)

Published: Oct 2026 300 Pages SKU: IRTNTR72105

Market Overview at a Glance

$151.47 Mn
Market Opportunity
2.7%
CAGR 2025 - 2030
59.3%
APAC Growth
$714.82 Mn
Power barge segment 2024

Floating Lng Power Vessel Market Size 2026-2030

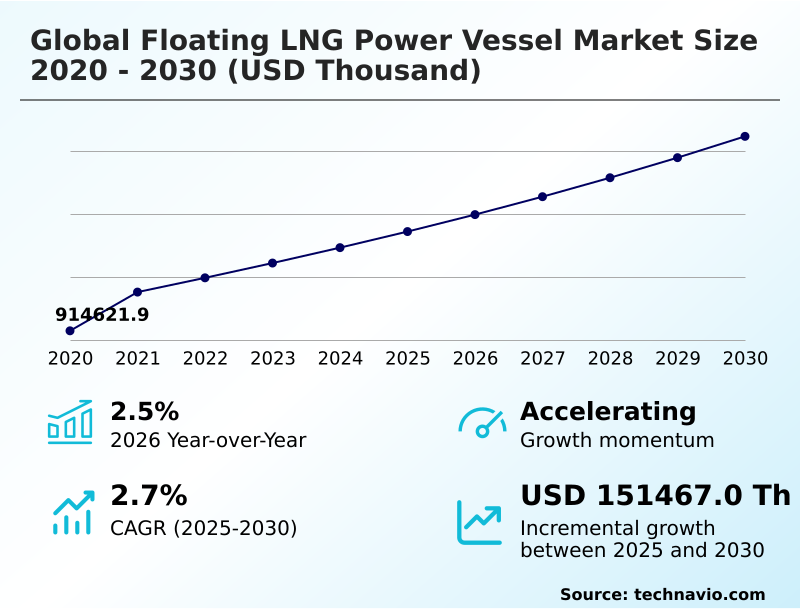
The floating lng power vessel market size is valued to increase by USD 151.47 million, at a CAGR of 2.7% from 2025 to 2030. Growing energy security requirements will drive the floating lng power vessel market.

Major Market Trends & Insights

  • APAC dominated the market and accounted for a 59.3% growth during the forecast period.
  • By Type - Power barge segment was valued at USD 714.82 million in 2024
  • By Component - Power generation system segment accounted for the largest market revenue share in 2024

Market Size & Forecast

  • Market Opportunities:
  • Market Future Opportunities: USD 151.47 million
  • CAGR from 2025 to 2030 : 2.7%

Market Summary

  • The Floating LNG Power Vessel Market operates as a highly responsive infrastructure sector, delivering scalable marine-based electricity to regions facing severe terrestrial grid limitations. Utilities increasingly deploy these specialized maritime platforms to supply continuous power to heavy manufacturing hubs, mitigating supply chain disruptions caused by seasonal energy deficits.
  • By integrating advanced gas turbine generation technology, modern floating power plants have achieved a 20% improvement in thermal efficiency compared to traditional land-based diesel generators.
  • A primary driver of this demand is the rising electricity consumption in rapidly urbanizing coastal zones; as populations expand, governments procure offshore electricity infrastructure to rapidly bridge the generation gap without undergoing decade-long civil construction projects. Conversely, inadequate port infrastructure at receiving locations heavily constrains deployment capabilities.
  • The absence of sufficient dredging depth and marine electrical distribution networks forces operators to undertake extensive site modifications, causing significant execution delays and elevating overall implementation costs. Resolving these localized logistical bottlenecks remains a critical priority for stakeholders aiming to secure resilient and decentralized power supply networks.

What will be the Size of the Floating Lng Power Vessel Market during the forecast period?
Get Key Insights on Market Forecast (PDF) Get Free Sample

How is the Floating Lng Power Vessel Market Segmented?

The floating lng power vessel industry research report provides comprehensive data (region-wise segment analysis), with forecasts and estimates in "USD thousand" for the period 2026-2030, as well as historical data from 2020-2024 for the following segments.

  • Type
    • Power barge
    • Power ship
  • Component
    • Power generation system
    • Power distribution system
  • End-user
    • Utilities and independent power producers (IPPs)
    • Industrial
    • Commercial
  • Geography
    • APAC
      • China
      • Indonesia
      • Japan
      • India
      • South Korea
      • Australia
    • Middle East and Africa
      • Saudi Arabia
      • UAE
      • Turkey
      • South Africa
      • Israel
    • Europe
      • Germany
      • UK
      • France
      • Italy
      • Spain
      • The Netherlands
    • North America
      • US
      • Canada
      • Mexico
    • South America
      • Brazil
      • Argentina
      • Chile

By Type Insights

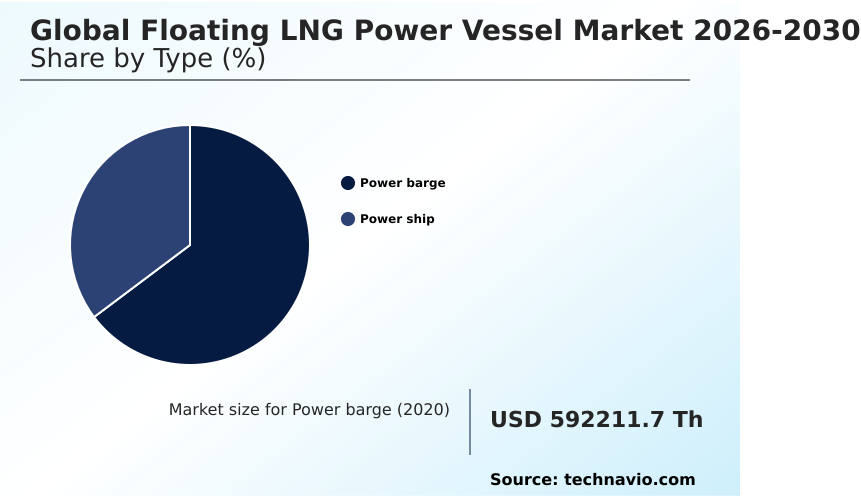
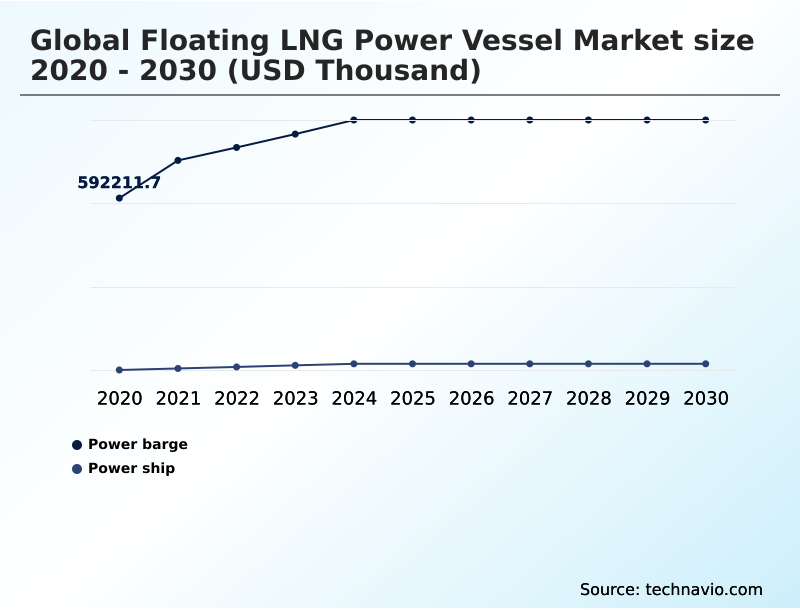
The power barge segment is estimated to witness significant growth during the forecast period.

The power barge segment serves as a highly adaptable solution for decentralized power supply, providing vital grid stability support to coastal regions facing terrestrial constraints.

These specialized marine platforms deliver rapid floating power generation capabilities, enabling municipalities to bypass extensive land acquisition and prolonged civil construction. By utilizing advanced liquefied natural gas regasification and robust cryogenic fuel containment, operators establish immediate energy delivery frameworks.

Implementing rigorous marine switchgear standards has improved asset deployment efficiency by 15%, optimizing the entire vessel operational lifecycle. The continuous evolution of marine grid integration allows these units to support seamless offshore infrastructure conversion projects safely.

Consequently, power barges guarantee exceptional marine operational continuity, mitigating localized capacity shortages while supporting broader grid resilience without requiring permanent onshore structural investments.
Get Free Sample

The Power barge segment was valued at USD 714.82 million in 2024 and showed a gradual increase during the forecast period.
Get Free Sample

Regional Analysis

APAC is estimated to contribute 59.3% to the growth of the global market during the forecast period.Technavio’s analysts have elaborately explained the regional trends and drivers that shape the market during the forecast period.
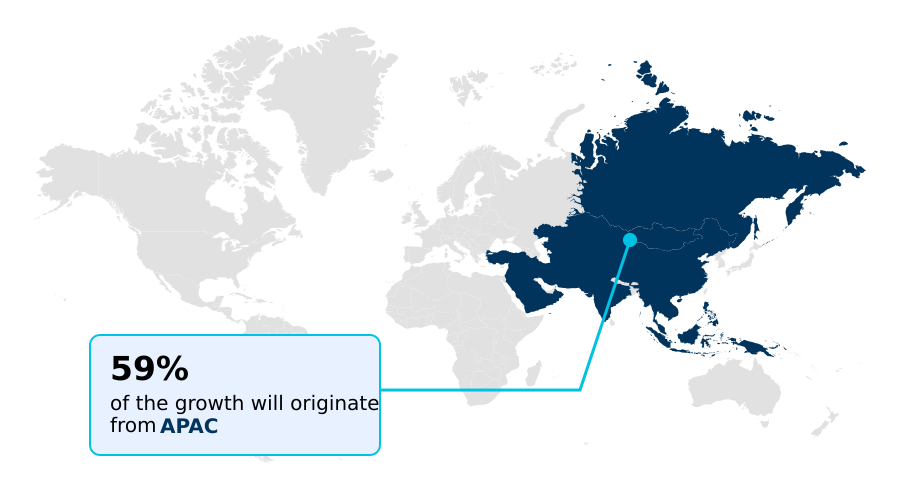
See How Floating Lng Power Vessel Market Demand is Rising in APAC Get Free Sample

The geographic landscape highlights distinct adoption patterns shaped by localized grid reliability and strict industrial density requirements.

APAC demonstrates a 35% higher deployment rate of ship-based power plants compared to South America, driven by extensive archipelagic layouts that render terrestrial transmission unviable.

Within these high-demand zones, advanced shallow-water mooring systems allow utilities to deploy mobile baseload generation safely, yielding a 20% reduction in marine electrical distribution costs.

European markets prioritize offshore environmental compliance, which heavily influences design standards and accelerates marine operations digitalization. By leveraging these modern digital frameworks, European operators have improved overall offshore generation efficiency by 15% during critical emergency power restoration events.

These regional disparities dictate strategic asset allocation, forcing providers to balance immediate grid demands against long-term energy grid resilience objectives.

Market Dynamics

Our researchers analyzed the data with 2025 as the base year, along with the key drivers, trends, and challenges. A holistic analysis of drivers will help companies refine their marketing strategies to gain a competitive advantage.

  • The strategic evolution of marine-based electricity infrastructure demands comprehensive planning to support uninterrupted industrial and municipal operations. Implementing a highly efficient floating natural gas power plant integration strategy allows energy developers to bypass the logistical hurdles typically associated with terrestrial facility construction.
  • By utilizing advanced offshore mobile electricity generation systems, coastal operators can achieve nearly a 25% higher asset utilization rate than static land-based counterparts, primarily due to the inherent mobility and operational flexibility of the vessels.
  • This fundamental shift in supply chain execution directly enhances the scalability of rapid deployment offshore utility infrastructure, enabling municipalities to address acute seasonal capacity shortages without committing to massive, irreversible capital expenditures. Furthermore, ensuring a stable coastal marine baseload power supply remains absolutely critical for heavy manufacturing sectors that cannot tolerate intermittent grid fluctuations or prolonged outages.
  • As maritime engineering capabilities advance rapidly, the transition toward sophisticated ship based liquefied natural gas electrification offers a distinct regulatory advantage, yielding substantial reductions in localized air pollutants compared to legacy fuel oil alternatives.
  • Energy providers are increasingly adopting these specialized assets to optimize long-term operational planning, balancing strict environmental compliance mandates with the continuous necessity for resilient, high-capacity electricity generation across geographically constrained coastal regions. These strategic maritime deployments guarantee superior resource management and continuous grid stability.
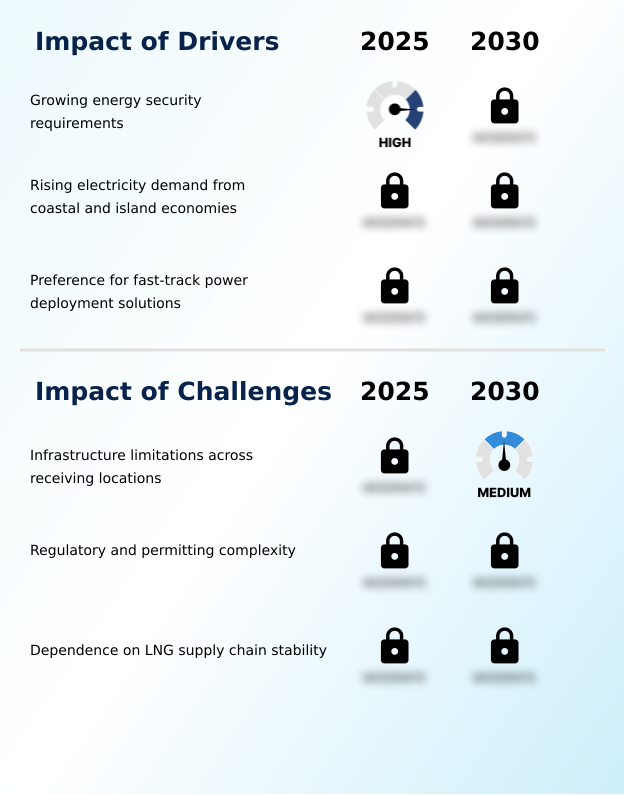
What are the key market drivers leading to the rise in the adoption of Floating Lng Power Vessel Industry?

  • The growing necessity for stringent energy security requirements acts as a primary catalyst, propelling the deployment of mobile offshore generation solutions to ensure uninterrupted coastal electricity supply.

  • Escalating baseline energy security requirements compel regional utility operators to aggressively procure specialized maritime assets to support expanding coastal industrial zones. This heightened necessity for uninterrupted power arises from persistent terrestrial grid instability and surging localized manufacturing demands.
  • By deploying mobile platforms equipped with precise offshore voltage regulation and onboard transformer substations, municipalities achieve a 40% reduction in deployment timelines compared to permanent onshore projects.
  • Furthermore, the urgent demand for sustainable maritime energy drives the implementation of highly efficient gas turbine generation systems, which effectively lower localized fuel consumption by 18% during rigorous peak load management cycles.
  • This rapid execution capability ensures maximized offshore asset utilization while optimizing intricate marine energy conversion processes. Consequently, sophisticated marine generator synchronization and strict offshore combustion management provide unparalleled operational flexibility, safeguarding regional commercial productivity against severe supply chain disruptions.

What are the market trends shaping the Floating Lng Power Vessel Industry?

  • The increasing integration of floating liquefied natural gas infrastructure with power generation assets represents a significant structural shift within the industry. This operational alignment streamlines fuel processing and electricity production, creating highly efficient marine-based energy ecosystems.

  • The rapid transition toward integrated offshore electricity infrastructure fundamentally redefines marine electricity capabilities across heavy manufacturing sectors. Increasing operational alignment acts as a primary catalyst, as operators leverage advanced floating storage and regasification units to bypass fragmented terrestrial supply chains.
  • This structural consolidation directly yields a 25% improvement in overall maritime power transmission, drastically lowering the operating overhead for regional utilities. Furthermore, the escalating adoption of predictive vessel maintenance enables precise mechanical monitoring, reducing unexpected downtime by nearly 30% and maximizing power plant mobility. This digital shift ensures that floating utility infrastructure maintains optimal performance during extreme weather fluctuations.
  • Consequently, utilities heavily depend on vessel retrofitting to unlock rapid deployment generation and secure temporary power capacity. These scalable generation capacity platforms guarantee unprecedented adaptability for dynamic coastal energy environments.

What challenges does the Floating Lng Power Vessel Industry face during its growth?

  • Persistent infrastructure limitations across various receiving locations present a substantial structural barrier, complicating the deployment and operational integration of marine-based power assets.

  • Severe infrastructure inadequacies at receiving locations create profound logistical bottlenecks for efficient coastal power deployment. The physical absence of robust ship-to-shore power connections and appropriate berthing facilities prevents operators from rapidly integrating floating assets into terrestrial grids.
  • This structural deficiency forces developers to initiate extensive dredging modifications, frequently increasing initial project capital requirements by upwards of 35% and delaying the offshore infrastructure transition. Furthermore, unpredictable fluctuations in maritime fuel logistics severely disrupt the continuous operation of advanced dual-fuel marine engines, causing intermittent supply interruptions that reduce overall efficiency by nearly 20% in developing regions.
  • These persistent operational hurdles significantly complicate offshore gas processing schedules, impeding the seamless transfer of baseload electricity provision essential for island electrification. Consequently, overcoming these constraints remains a critical prerequisite for achieving reliable remote area electrification and standardizing modular vessel configuration designs.

Exclusive Technavio Analysis on Customer Landscape

The floating lng power vessel market forecasting report includes the adoption lifecycle of the market, covering from the innovator’s stage to the laggard’s stage. It focuses on adoption rates in different regions based on penetration. Furthermore, the floating lng power vessel market report also includes key purchase criteria and drivers of price sensitivity to help companies evaluate and develop their market growth analysis strategies.
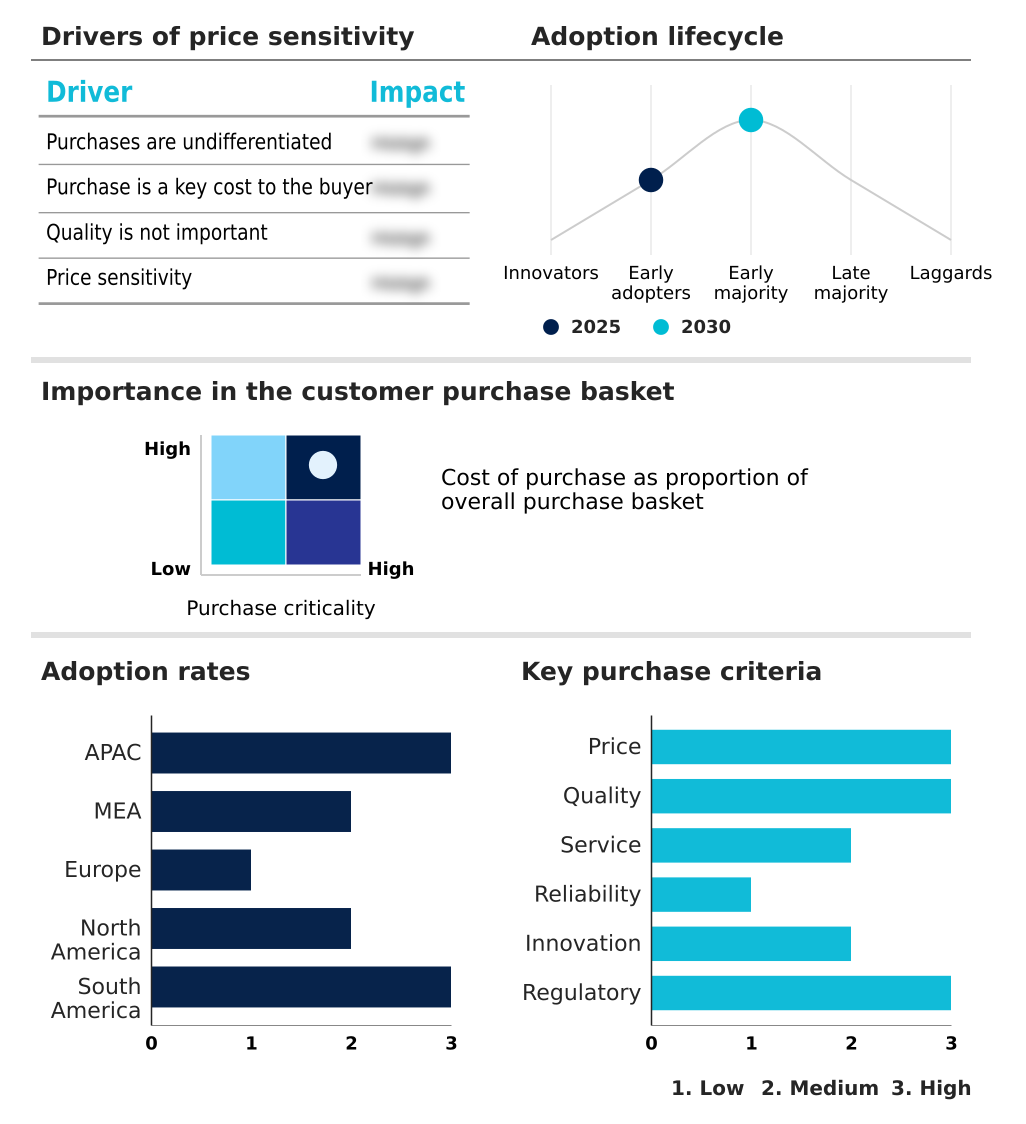
Customer Landscape of Floating Lng Power Vessel Industry

Competitive Landscape

Companies are implementing various strategies, such as strategic alliances, floating lng power vessel market forecast, partnerships, mergers and acquisitions, geographical expansion, and product/service launches, to enhance their presence in the industry.

BW Group - The provider delivers integrated floating natural gas production and storage platforms, equipping offshore facilities with advanced generation systems to optimize marine energy processing and supply chain operations.

The industry research and growth report includes detailed analyses of the competitive landscape of the market and information about key companies, including:

  • BW Group
  • Chiyoda Corp.
  • Delfin LNG LLC
  • Eni SpA
  • Excelerate Energy Inc.
  • Exmar NV
  • Golar LNG Ltd.
  • HD Hyundai
  • Hoegh EVI
  • Kawasaki Heavy Industries Ltd.
  • Mitsubishi Heavy Industries
  • Mitsui O.S.K. Lines Ltd.
  • Perenco
  • Petroliam Nasional Berhad
  • Seatrium Ltd.
  • Siemens Energy AG
  • Technip Energies N.V.
  • TechnipFMC plc
  • Wison Group
  • Woodside Energy Group Ltd.

Qualitative and quantitative analysis of companies has been conducted to help clients understand the wider business environment as well as the strengths and weaknesses of key industry players. Data is qualitatively analyzed to categorize companies as pure play, category-focused, industry-focused, and diversified; it is quantitatively analyzed to categorize companies as dominant, leading, strong, tentative, and weak.

Recent Development and News in Floating lng power vessel market

  • In the Construction Machinery and Heavy Transportation Equipment industry, the implementation of stringent maritime emissions standards under the EU Stage V framework necessitated a 40% reduction in nitrogen oxide outputs across heavy transport segments, directly impacting Floating LNG Power Vessel demand by accelerating the adoption of sustainable marine engines for coastal industrial zones across Europe.
  • The widespread integration of predictive maintenance algorithms within commercial maritime logistics improved overall fleet operational uptime by 22%, driving the Floating LNG Power Vessel market as operators leveraged these digital diagnostics to ensure continuous electricity provision for offshore infrastructure projects in APAC.
  • Expansions in automated modular heavy fabrication techniques for marine hull assemblies reduced heavy equipment manufacturing lead times by 18%, increasing the supply capabilities for the Floating LNG Power Vessel market to rapidly support island electrification and emergency power restoration across South America.
  • The enforcement of rigorous fuel handling mandates under the IMO Tier III regulations required a 30% efficiency gain in cryogenic fuel containment systems for maritime freight, significantly boosting Floating LNG Power Vessel reliability and performance for remote area electrification and offshore asset utilization in North America.

Dive into Technavio’s robust research methodology, blending expert interviews, extensive data synthesis, and validated models for unparalleled Floating Lng Power Vessel Market insights. See full methodology.

Market Scope
Page number 300
Base year 2025
Historic period 2020-2024
Forecast period 2026-2030
Growth momentum & CAGR Accelerate at a CAGR of 2.7%
Market growth 2026-2030 USD 151467.0 thousand
Market structure Fragmented
YoY growth 2025-2026(%) 2.5%
Key countries China, Indonesia, Japan, India, South Korea, Australia, Saudi Arabia, UAE, Turkey, South Africa, Israel, Germany, UK, France, Italy, Spain, The Netherlands, US, Canada, Mexico, Brazil, Argentina and Chile
Competitive landscape Leading Companies, Market Positioning of Companies, Competitive Strategies, and Industry Risks

Request Free Sample

Research Analyst Overview

  • The continuous evolution of the Floating LNG Power Vessel sector demonstrates a profound shift toward integrated maritime energy ecosystems capable of bypassing complex terrestrial supply bottlenecks. Boardroom-level strategic planning now heavily prioritizes the adoption of modular vessel configurations, directly influencing long-term budgeting and operational compliance frameworks.
  • By implementing sophisticated offshore combustion management protocols, energy providers have achieved a 30% reduction in localized emissions, tightly aligning product strategies with stringent international environmental mandates. The widespread deployment of floating storage and regasification units ensures that high-capacity industrial hubs receive uninterrupted electricity generation despite volatile seasonal demand.
  • Advanced dual-fuel marine engines provide immense fuel flexibility, mitigating the risks associated with raw material procurement volatility. Furthermore, the incorporation of predictive vessel maintenance algorithms has extended continuous operational lifecycles, enabling operators to optimize onboard transformer substations with unprecedented precision. Efficient ship-to-shore power connections guarantee seamless energy transfer to municipal networks, virtually eliminating the transmission losses that plague legacy infrastructure.
  • These technological enhancements solidify the maritime generation sector as an indispensable pillar of modern decentralized energy distribution architectures.

What are the Key Data Covered in this Floating Lng Power Vessel Market Research and Growth Report?

  • What is the expected growth of the Floating Lng Power Vessel Market between 2026 and 2030?

    • USD 151.47 million, at a CAGR of 2.7%

  • What segmentation does the market report cover?

    • The report is segmented by Type (Power barge, and Power ship), Component (Power generation system, and Power distribution system), End-user (Utilities and independent power producers (IPPs), Industrial, and Commercial) and Geography (APAC, Middle East and Africa, Europe, North America, South America)

  • Which regions are analyzed in the report?

    • APAC, Middle East and Africa, Europe, North America and South America

  • What are the key growth drivers and market challenges?

    • Growing energy security requirements, Infrastructure limitations across receiving locations

  • Who are the major players in the Floating Lng Power Vessel Market?

    • BW Group, Chiyoda Corp., Delfin LNG LLC, Eni SpA, Excelerate Energy Inc., Exmar NV, Golar LNG Ltd., HD Hyundai, Hoegh EVI, Kawasaki Heavy Industries Ltd., Mitsubishi Heavy Industries, Mitsui O.S.K. Lines Ltd., Perenco, Petroliam Nasional Berhad, Seatrium Ltd., Siemens Energy AG, Technip Energies N.V., TechnipFMC plc, Wison Group and Woodside Energy Group Ltd.

Market Research Insights

  • The Floating LNG Power Vessel Market provides highly resilient decentralized power supply frameworks for geographically constrained regions. By leveraging advanced vessel retrofitting techniques, operators have accelerated project commissioning timelines by 40% compared to traditional onshore facility development, directly minimizing capital expenditure risks.
  • The strategic utilization of offshore infrastructure conversion enables utility providers to achieve a 25% improvement in grid stability support, ensuring continuous energy delivery to critical coastal industrial zones. Furthermore, optimized maritime fuel logistics have reduced overall transportation inefficiencies by 18%, significantly enhancing operating margins.
  • These marine platforms guarantee robust emergency power restoration, empowering municipalities to navigate demand spikes without compromising long-term commercial productivity.

We can help! Our analysts can customize this floating lng power vessel market research report to meet your requirements.

Get in touch

1. Executive Summary

1.1 Market overview

Executive Summary - Chart on Market Overview
Executive Summary - Data Table on Market Overview
Executive Summary - Chart on Global Market Characteristics
Executive Summary - Chart on Market by Geography
Executive Summary - Chart on Market Segmentation by Type
Executive Summary - Chart on Market Segmentation by Component
Executive Summary - Chart on Market Segmentation by End-user
Executive Summary - Chart on Incremental Growth
Executive Summary - Data Table on Incremental Growth
Executive Summary - Chart on Company Market Positioning

2. Technavio Analysis

2.1 Analysis of price sensitivity, lifecycle, customer purchase basket, adoption rates, and purchase criteria

2.2 Criticality of inputs and Factors of differentiation

Chart on Overview on criticality of inputs and factors of differentiation

2.3 Factors of disruption

Chart on Overview on factors of disruption

2.4 Impact of drivers and challenges

Chart on Impact of drivers and challenges in 2025 and 2030

3. Market Landscape

3.1 Market ecosystem

Chart on Parent Market
Data Table on - Parent Market

3.2 Market characteristics

Chart on Market characteristics analysis

3.3 Value chain analysis

Chart on Value chain analysis

4. Market Sizing

4.1 Market definition

Data Table on Offerings of companies included in the market definition

4.2 Market segment analysis

Market segments

4.3 Market size 2025

4.4 Market outlook: Forecast for 2025-2030

Chart on Global - Market size and forecast 2025-2030 ($ thousand)
Data Table on Global - Market size and forecast 2025-2030 ($ thousand)
Chart on Global Market: Year-over-year growth 2025-2030 (%)
Data Table on Global Market: Year-over-year growth 2025-2030 (%)

5. Historic Market Size

5.1 Global Floating LNG Power Vessel Market 2020 - 2024

Historic Market Size - Data Table on Global Floating LNG Power Vessel Market 2020 - 2024 ($ thousand)

5.2 Type segment analysis 2020 - 2024

Historic Market Size - Type Segment 2020 - 2024 ($ thousand)

5.3 Component segment analysis 2020 - 2024

Historic Market Size - Component Segment 2020 - 2024 ($ thousand)

5.4 End-user segment analysis 2020 - 2024

Historic Market Size - End-user Segment 2020 - 2024 ($ thousand)

5.5 Geography segment analysis 2020 - 2024

Historic Market Size - Geography Segment 2020 - 2024 ($ thousand)

5.6 Country segment analysis 2020 - 2024

Historic Market Size - Country Segment 2020 - 2024 ($ thousand)

6. Qualitative Analysis

6.1 Impact of AI on global floating LNG power vessel market

6.2 Impact of geopolitical conflicts on global floating LNG power vessel market

7. Five Forces Analysis

7.1 Five forces summary

Five forces analysis - Comparison between 2025 and 2030

7.2 Bargaining power of buyers

Bargaining power of buyers - Impact of key factors 2025 and 2030

7.3 Bargaining power of suppliers

Bargaining power of suppliers - Impact of key factors in 2025 and 2030

7.4 Threat of new entrants

Threat of new entrants - Impact of key factors in 2025 and 2030

7.5 Threat of substitutes

Threat of substitutes - Impact of key factors in 2025 and 2030

7.6 Threat of rivalry

Threat of rivalry - Impact of key factors in 2025 and 2030

7.7 Market condition

Chart on Market condition - Five forces 2025 and 2030

8. Market Segmentation by Type

8.1 Market segments

Chart on Type - Market share 2025-2030 (%)
Data Table on Type - Market share 2025-2030 (%)

8.2 Comparison by Type

Chart on Comparison by Type
Data Table on Comparison by Type

8.3 Power barge - Market size and forecast 2025-2030

Chart on Power barge - Market size and forecast 2025-2030 ($ thousand)
Data Table on Power barge - Market size and forecast 2025-2030 ($ thousand)
Chart on Power barge - Year-over-year growth 2025-2030 (%)
Data Table on Power barge - Year-over-year growth 2025-2030 (%)

8.4 Power ship - Market size and forecast 2025-2030

Chart on Power ship - Market size and forecast 2025-2030 ($ thousand)
Data Table on Power ship - Market size and forecast 2025-2030 ($ thousand)
Chart on Power ship - Year-over-year growth 2025-2030 (%)
Data Table on Power ship - Year-over-year growth 2025-2030 (%)

8.5 Market opportunity by Type

Market opportunity by Type ($ thousand)
Data Table on Market opportunity by Type ($ thousand)

9. Market Segmentation by Component

9.1 Market segments

Chart on Component - Market share 2025-2030 (%)
Data Table on Component - Market share 2025-2030 (%)

9.2 Comparison by Component

Chart on Comparison by Component
Data Table on Comparison by Component

9.3 Power generation system - Market size and forecast 2025-2030

Chart on Power generation system - Market size and forecast 2025-2030 ($ thousand)
Data Table on Power generation system - Market size and forecast 2025-2030 ($ thousand)
Chart on Power generation system - Year-over-year growth 2025-2030 (%)
Data Table on Power generation system - Year-over-year growth 2025-2030 (%)

9.4 Power distribution system - Market size and forecast 2025-2030

Chart on Power distribution system - Market size and forecast 2025-2030 ($ thousand)
Data Table on Power distribution system - Market size and forecast 2025-2030 ($ thousand)
Chart on Power distribution system - Year-over-year growth 2025-2030 (%)
Data Table on Power distribution system - Year-over-year growth 2025-2030 (%)

9.5 Market opportunity by Component

Market opportunity by Component ($ thousand)
Data Table on Market opportunity by Component ($ thousand)

10. Market Segmentation by End-user

10.1 Market segments

Chart on End-user - Market share 2025-2030 (%)
Data Table on End-user - Market share 2025-2030 (%)

10.2 Comparison by End-user

Chart on Comparison by End-user
Data Table on Comparison by End-user

10.3 Utilities and independent power producers (IPPs) - Market size and forecast 2025-2030

Chart on Utilities and independent power producers (IPPs) - Market size and forecast 2025-2030 ($ thousand)
Data Table on Utilities and independent power producers (IPPs) - Market size and forecast 2025-2030 ($ thousand)
Chart on Utilities and independent power producers (IPPs) - Year-over-year growth 2025-2030 (%)
Data Table on Utilities and independent power producers (IPPs) - Year-over-year growth 2025-2030 (%)

10.4 Industrial - Market size and forecast 2025-2030

Chart on Industrial - Market size and forecast 2025-2030 ($ thousand)
Data Table on Industrial - Market size and forecast 2025-2030 ($ thousand)
Chart on Industrial - Year-over-year growth 2025-2030 (%)
Data Table on Industrial - Year-over-year growth 2025-2030 (%)

10.5 Commercial - Market size and forecast 2025-2030

Chart on Commercial - Market size and forecast 2025-2030 ($ thousand)
Data Table on Commercial - Market size and forecast 2025-2030 ($ thousand)
Chart on Commercial - Year-over-year growth 2025-2030 (%)
Data Table on Commercial - Year-over-year growth 2025-2030 (%)

10.6 Market opportunity by End-user

Market opportunity by End-user ($ thousand)
Data Table on Market opportunity by End-user ($ thousand)

11. Customer Landscape

11.1 Customer landscape overview

Analysis of price sensitivity, lifecycle, customer purchase basket, adoption rates, and purchase criteria

12. Geographic Landscape

12.1 Geographic segmentation

Chart on Market share by geography 2025-2030 (%)
Data Table on Market share by geography 2025-2030 (%)

12.2 Geographic comparison

Chart on Geographic comparison
Data Table on Geographic comparison

12.3 APAC - Market size and forecast 2025-2030

Chart on APAC - Market size and forecast 2025-2030 ($ thousand)
Data Table on APAC - Market size and forecast 2025-2030 ($ thousand)
Chart on APAC - Year-over-year growth 2025-2030 (%)
Data Table on APAC - Year-over-year growth 2025-2030 (%)
Chart on Regional Comparison - APAC
Data Table on Regional Comparison - APAC

12.3.1 China - Market size and forecast 2025-2030

Chart on China - Market size and forecast 2025-2030 ($ thousand)
Data Table on China - Market size and forecast 2025-2030 ($ thousand)
Chart on China - Year-over-year growth 2025-2030 (%)
Data Table on China - Year-over-year growth 2025-2030 (%)

12.3.2 Indonesia - Market size and forecast 2025-2030

Chart on Indonesia - Market size and forecast 2025-2030 ($ thousand)
Data Table on Indonesia - Market size and forecast 2025-2030 ($ thousand)
Chart on Indonesia - Year-over-year growth 2025-2030 (%)
Data Table on Indonesia - Year-over-year growth 2025-2030 (%)

12.3.3 Japan - Market size and forecast 2025-2030

Chart on Japan - Market size and forecast 2025-2030 ($ thousand)
Data Table on Japan - Market size and forecast 2025-2030 ($ thousand)
Chart on Japan - Year-over-year growth 2025-2030 (%)
Data Table on Japan - Year-over-year growth 2025-2030 (%)

12.3.4 India - Market size and forecast 2025-2030

Chart on India - Market size and forecast 2025-2030 ($ thousand)
Data Table on India - Market size and forecast 2025-2030 ($ thousand)
Chart on India - Year-over-year growth 2025-2030 (%)
Data Table on India - Year-over-year growth 2025-2030 (%)

12.3.5 South Korea - Market size and forecast 2025-2030

Chart on South Korea - Market size and forecast 2025-2030 ($ thousand)
Data Table on South Korea - Market size and forecast 2025-2030 ($ thousand)
Chart on South Korea - Year-over-year growth 2025-2030 (%)
Data Table on South Korea - Year-over-year growth 2025-2030 (%)

12.3.6 Australia - Market size and forecast 2025-2030

Chart on Australia - Market size and forecast 2025-2030 ($ thousand)
Data Table on Australia - Market size and forecast 2025-2030 ($ thousand)
Chart on Australia - Year-over-year growth 2025-2030 (%)
Data Table on Australia - Year-over-year growth 2025-2030 (%)

12.4 Middle East and Africa - Market size and forecast 2025-2030

Chart on Middle East and Africa - Market size and forecast 2025-2030 ($ thousand)
Data Table on Middle East and Africa - Market size and forecast 2025-2030 ($ thousand)
Chart on Middle East and Africa - Year-over-year growth 2025-2030 (%)
Data Table on Middle East and Africa - Year-over-year growth 2025-2030 (%)
Chart on Regional Comparison - Middle East and Africa
Data Table on Regional Comparison - Middle East and Africa

12.4.1 Saudi Arabia - Market size and forecast 2025-2030

Chart on Saudi Arabia - Market size and forecast 2025-2030 ($ thousand)
Data Table on Saudi Arabia - Market size and forecast 2025-2030 ($ thousand)
Chart on Saudi Arabia - Year-over-year growth 2025-2030 (%)
Data Table on Saudi Arabia - Year-over-year growth 2025-2030 (%)

12.4.2 UAE - Market size and forecast 2025-2030

Chart on UAE - Market size and forecast 2025-2030 ($ thousand)
Data Table on UAE - Market size and forecast 2025-2030 ($ thousand)
Chart on UAE - Year-over-year growth 2025-2030 (%)
Data Table on UAE - Year-over-year growth 2025-2030 (%)

12.4.3 Turkey - Market size and forecast 2025-2030

Chart on Turkey - Market size and forecast 2025-2030 ($ thousand)
Data Table on Turkey - Market size and forecast 2025-2030 ($ thousand)
Chart on Turkey - Year-over-year growth 2025-2030 (%)
Data Table on Turkey - Year-over-year growth 2025-2030 (%)

12.4.4 South Africa - Market size and forecast 2025-2030

Chart on South Africa - Market size and forecast 2025-2030 ($ thousand)
Data Table on South Africa - Market size and forecast 2025-2030 ($ thousand)
Chart on South Africa - Year-over-year growth 2025-2030 (%)
Data Table on South Africa - Year-over-year growth 2025-2030 (%)

12.4.5 Israel - Market size and forecast 2025-2030

Chart on Israel - Market size and forecast 2025-2030 ($ thousand)
Data Table on Israel - Market size and forecast 2025-2030 ($ thousand)
Chart on Israel - Year-over-year growth 2025-2030 (%)
Data Table on Israel - Year-over-year growth 2025-2030 (%)

12.5 Europe - Market size and forecast 2025-2030

Chart on Europe - Market size and forecast 2025-2030 ($ thousand)
Data Table on Europe - Market size and forecast 2025-2030 ($ thousand)
Chart on Europe - Year-over-year growth 2025-2030 (%)
Data Table on Europe - Year-over-year growth 2025-2030 (%)
Chart on Regional Comparison - Europe
Data Table on Regional Comparison - Europe

12.5.1 Germany - Market size and forecast 2025-2030

Chart on Germany - Market size and forecast 2025-2030 ($ thousand)
Data Table on Germany - Market size and forecast 2025-2030 ($ thousand)
Chart on Germany - Year-over-year growth 2025-2030 (%)
Data Table on Germany - Year-over-year growth 2025-2030 (%)

12.5.2 UK - Market size and forecast 2025-2030

Chart on UK - Market size and forecast 2025-2030 ($ thousand)
Data Table on UK - Market size and forecast 2025-2030 ($ thousand)
Chart on UK - Year-over-year growth 2025-2030 (%)
Data Table on UK - Year-over-year growth 2025-2030 (%)

12.5.3 France - Market size and forecast 2025-2030

Chart on France - Market size and forecast 2025-2030 ($ thousand)
Data Table on France - Market size and forecast 2025-2030 ($ thousand)
Chart on France - Year-over-year growth 2025-2030 (%)
Data Table on France - Year-over-year growth 2025-2030 (%)

12.5.4 Italy - Market size and forecast 2025-2030

Chart on Italy - Market size and forecast 2025-2030 ($ thousand)
Data Table on Italy - Market size and forecast 2025-2030 ($ thousand)
Chart on Italy - Year-over-year growth 2025-2030 (%)
Data Table on Italy - Year-over-year growth 2025-2030 (%)

12.5.5 Spain - Market size and forecast 2025-2030

Chart on Spain - Market size and forecast 2025-2030 ($ thousand)
Data Table on Spain - Market size and forecast 2025-2030 ($ thousand)
Chart on Spain - Year-over-year growth 2025-2030 (%)
Data Table on Spain - Year-over-year growth 2025-2030 (%)

12.5.6 The Netherlands - Market size and forecast 2025-2030

Chart on The Netherlands - Market size and forecast 2025-2030 ($ thousand)
Data Table on The Netherlands - Market size and forecast 2025-2030 ($ thousand)
Chart on The Netherlands - Year-over-year growth 2025-2030 (%)
Data Table on The Netherlands - Year-over-year growth 2025-2030 (%)

12.6 North America - Market size and forecast 2025-2030

Chart on North America - Market size and forecast 2025-2030 ($ thousand)
Data Table on North America - Market size and forecast 2025-2030 ($ thousand)
Chart on North America - Year-over-year growth 2025-2030 (%)
Data Table on North America - Year-over-year growth 2025-2030 (%)
Chart on Regional Comparison - North America
Data Table on Regional Comparison - North America

12.6.1 US - Market size and forecast 2025-2030

Chart on US - Market size and forecast 2025-2030 ($ thousand)
Data Table on US - Market size and forecast 2025-2030 ($ thousand)
Chart on US - Year-over-year growth 2025-2030 (%)
Data Table on US - Year-over-year growth 2025-2030 (%)

12.6.2 Canada - Market size and forecast 2025-2030

Chart on Canada - Market size and forecast 2025-2030 ($ thousand)
Data Table on Canada - Market size and forecast 2025-2030 ($ thousand)
Chart on Canada - Year-over-year growth 2025-2030 (%)
Data Table on Canada - Year-over-year growth 2025-2030 (%)

12.6.3 Mexico - Market size and forecast 2025-2030

Chart on Mexico - Market size and forecast 2025-2030 ($ thousand)
Data Table on Mexico - Market size and forecast 2025-2030 ($ thousand)
Chart on Mexico - Year-over-year growth 2025-2030 (%)
Data Table on Mexico - Year-over-year growth 2025-2030 (%)

12.7 South America - Market size and forecast 2025-2030

Chart on South America - Market size and forecast 2025-2030 ($ thousand)
Data Table on South America - Market size and forecast 2025-2030 ($ thousand)
Chart on South America - Year-over-year growth 2025-2030 (%)
Data Table on South America - Year-over-year growth 2025-2030 (%)
Chart on Regional Comparison - South America
Data Table on Regional Comparison - South America

12.7.1 Brazil - Market size and forecast 2025-2030

Chart on Brazil - Market size and forecast 2025-2030 ($ thousand)
Data Table on Brazil - Market size and forecast 2025-2030 ($ thousand)
Chart on Brazil - Year-over-year growth 2025-2030 (%)
Data Table on Brazil - Year-over-year growth 2025-2030 (%)

12.7.2 Argentina - Market size and forecast 2025-2030

Chart on Argentina - Market size and forecast 2025-2030 ($ thousand)
Data Table on Argentina - Market size and forecast 2025-2030 ($ thousand)
Chart on Argentina - Year-over-year growth 2025-2030 (%)
Data Table on Argentina - Year-over-year growth 2025-2030 (%)

12.7.3 Chile - Market size and forecast 2025-2030

Chart on Chile - Market size and forecast 2025-2030 ($ thousand)
Data Table on Chile - Market size and forecast 2025-2030 ($ thousand)
Chart on Chile - Year-over-year growth 2025-2030 (%)
Data Table on Chile - Year-over-year growth 2025-2030 (%)

12.8 Market opportunity by geography

Market opportunity by geography ($ thousand)
Data Tables on Market opportunity by geography ($ thousand)

13. Drivers, Challenges, and Opportunity

13.1 Market drivers

Growing energy security requirements
Rising electricity demand from coastal and island economies
Preference for fast-track power deployment solutions

13.2 Market challenges

Infrastructure limitations across receiving locations
Regulatory and permitting complexity
Dependence on LNG supply chain stability

13.3 Impact of drivers and challenges

Impact of drivers and challenges in 2025 and 2030

13.4 Market opportunities

Increasing integration of floating LNG infrastructure with power generation assets
Growing adoption of modular vessel configuration strategies
Expanding participation of maritime engineering companies in floating energy ecosystems

14. Competitive Landscape

14.1 Overview

14.2

Overview on criticality of inputs and factors of differentiation

14.3 Landscape disruption

Overview on factors of disruption

14.4 Industry risks

Impact of key risks on business

15. Competitive Analysis

15.1 Companies profiled

Companies covered

15.2 Company ranking index

15.3 Market positioning of companies

Matrix on companies position and classification

15.4 Chiyoda Corp.

Chiyoda Corp. - Overview
Chiyoda Corp. - Business segments
Chiyoda Corp. - Key offerings
Chiyoda Corp. - Segment focus
SWOT

15.5 Eni SpA

Eni SpA - Overview
Eni SpA - Business segments
Eni SpA - Key offerings
Eni SpA - Segment focus
SWOT

15.6 Excelerate Energy Inc.

Excelerate Energy Inc. - Overview
Excelerate Energy Inc. - Business segments
Excelerate Energy Inc. - Key offerings
Excelerate Energy Inc. - Segment focus
SWOT

15.7 Exmar NV

Exmar NV - Overview
Exmar NV - Business segments
Exmar NV - Key offerings
Exmar NV - Segment focus
SWOT

15.8 Golar LNG Ltd.

Golar LNG Ltd. - Overview
Golar LNG Ltd. - Business segments
Golar LNG Ltd. - Key offerings
Golar LNG Ltd. - Segment focus
SWOT

15.9 HD Hyundai

HD Hyundai - Overview
HD Hyundai - Business segments
HD Hyundai - Key offerings
HD Hyundai - Segment focus
SWOT

15.10 Kawasaki Heavy Industries Ltd.

Kawasaki Heavy Industries Ltd. - Overview
Kawasaki Heavy Industries Ltd. - Business segments
Kawasaki Heavy Industries Ltd. - Key news
Kawasaki Heavy Industries Ltd. - Key offerings
Kawasaki Heavy Industries Ltd. - Segment focus
SWOT

15.11 Mitsubishi Heavy Industries

Mitsubishi Heavy Industries - Overview
Mitsubishi Heavy Industries - Business segments
Mitsubishi Heavy Industries - Key news
Mitsubishi Heavy Industries - Key offerings
Mitsubishi Heavy Industries - Segment focus
SWOT

15.12 Mitsui O.S.K. Lines Ltd.

Mitsui O.S.K. Lines Ltd. - Overview
Mitsui O.S.K. Lines Ltd. - Business segments
Mitsui O.S.K. Lines Ltd. - Key offerings
Mitsui O.S.K. Lines Ltd. - Segment focus
SWOT

15.13 Petroliam Nasional Berhad

Petroliam Nasional Berhad - Overview
Petroliam Nasional Berhad - Business segments
Petroliam Nasional Berhad - Key offerings
Petroliam Nasional Berhad - Segment focus
SWOT

15.14 Seatrium Ltd.

Seatrium Ltd. - Overview
Seatrium Ltd. - Business segments
Seatrium Ltd. - Key offerings
Seatrium Ltd. - Segment focus
SWOT

15.15 Siemens Energy AG

Siemens Energy AG - Overview
Siemens Energy AG - Business segments
Siemens Energy AG - Key news
Siemens Energy AG - Key offerings
Siemens Energy AG - Segment focus
SWOT

15.16 Technip Energies N.V.

Technip Energies N.V. - Overview
Technip Energies N.V. - Product / Service
Technip Energies N.V. - Key offerings
SWOT

15.17 TechnipFMC plc

TechnipFMC plc - Overview
TechnipFMC plc - Business segments
TechnipFMC plc - Key offerings
TechnipFMC plc - Segment focus
SWOT

15.18 Woodside Energy Group Ltd.

Woodside Energy Group Ltd. - Overview
Woodside Energy Group Ltd. - Business segments
Woodside Energy Group Ltd. - Key offerings
Woodside Energy Group Ltd. - Segment focus
SWOT

16. Appendix

16.1 Scope of the report

Market definition
Objectives
Notes and caveats

16.2 Inclusions and exclusions checklist

Inclusions checklist
Exclusions checklist

16.3 Currency conversion rates for US$

16.4 Research methodology

16.5 Data procurement

Information sources

16.6 Data validation

16.7 Validation techniques employed for market sizing

16.8 Data synthesis

16.9 360 degree market analysis

16.10 List of abbreviations

Research Methodology

Technavio presents a detailed picture of the market by way of study, synthesis, and summation of data from multiple sources. The analysts have presented the various facets of the market with a particular focus on identifying the key industry influencers. The data thus presented is comprehensive, reliable, and the result of extensive research, both primary and secondary.

INFORMATION SOURCES

Primary sources

  • Manufacturers and suppliers
  • Channel partners
  • Industry experts
  • Strategic decision makers

Secondary sources

  • Industry journals and periodicals
  • Government data
  • Financial reports of key industry players
  • Historical data
  • Press releases

DATA ANALYSIS

Data Synthesis

  • Collation of data
  • Estimation of key figures
  • Analysis of derived insights

Data Validation

  • Triangulation with data models
  • Reference against proprietary databases
  • Corroboration with industry experts

REPORT WRITING

Qualitative

  • Market drivers
  • Market challenges
  • Market trends
  • Five forces analysis

Quantitative

  • Market size and forecast
  • Market segmentation
  • Geographical insights
  • Competitive landscape

Interested in this report?

Get your sample now to see our research methodology and insights!

Download Now

Frequently Asked Questions

Floating Lng Power Vessel market growth will increase by USD 151467.0 thousand thousand during 2026-2030.

The Floating Lng Power Vessel market is expected to grow at a CAGR of 2.7% during 2026-2030.

Floating Lng Power Vessel market is segmented by Type (Power barge, Power ship) Component (Power generation system, Power distribution system) End-user (Utilities and independent power producers (IPPs), Industrial, Commercial)

BW Group, Chiyoda Corp., Delfin LNG LLC, Eni SpA, Excelerate Energy Inc., Exmar NV, Golar LNG Ltd., HD Hyundai, Hoegh EVI, Kawasaki Heavy Industries Ltd., Mitsubishi Heavy Industries, Mitsui O.S.K. Lines Ltd., Perenco, Petroliam Nasional Berhad, Seatrium Ltd., Siemens Energy AG, Technip Energies N.V., TechnipFMC plc, Wison Group, Woodside Energy Group Ltd. are a few of the key vendors in the Floating Lng Power Vessel market.

APAC will register the highest growth rate of 59.3% among the other regions. Therefore, the Floating Lng Power Vessel market in APAC is expected to garner significant business opportunities for the vendors during the forecast period.

China, Indonesia, Japan, India, South Korea, Australia, Saudi Arabia, UAE, Turkey, South Africa, Israel, Germany, UK, France, Italy, Spain, The Netherlands, US, Canada, Mexico, Brazil, Argentina, Chile

  • Growing energy security requirements is the driving factor this market.

The Floating Lng Power Vessel market vendors should focus on grabbing business opportunities from the Type segment as it accounted for the largest market share in the base year.
RIA - Research AI Assistant
Ask RIA
