
Fixed Income Assets Management Market Analysis, Size, and Forecast 2026-2030: North America (US, Canada, and Mexico), Europe (UK, France, and Germany), APAC (China, Japan, and India), South America (Brazil, Argentina, and Chile), Middle East and Africa (Saudi Arabia, UAE, and South Africa), and Rest of World (ROW)

Fixed Income Assets Management Market Analysis, Size, and Forecast 2026-2030:
North America (US, Canada, and Mexico), Europe (UK, France, and Germany), APAC (China, Japan, and India), South America (Brazil, Argentina, and Chile), Middle East and Africa (Saudi Arabia, UAE, and South Africa), and Rest of World (ROW)

Published: Oct 2026 284 Pages SKU: IRTNTR74753

Market Overview at a Glance

$9400.8 B
Market Opportunity
6.2%
CAGR 2025 - 2030
36.8%
North America Growth
$14662.7 B
Core segment 2024

Fixed Income Assets Management Market Size 2026-2030

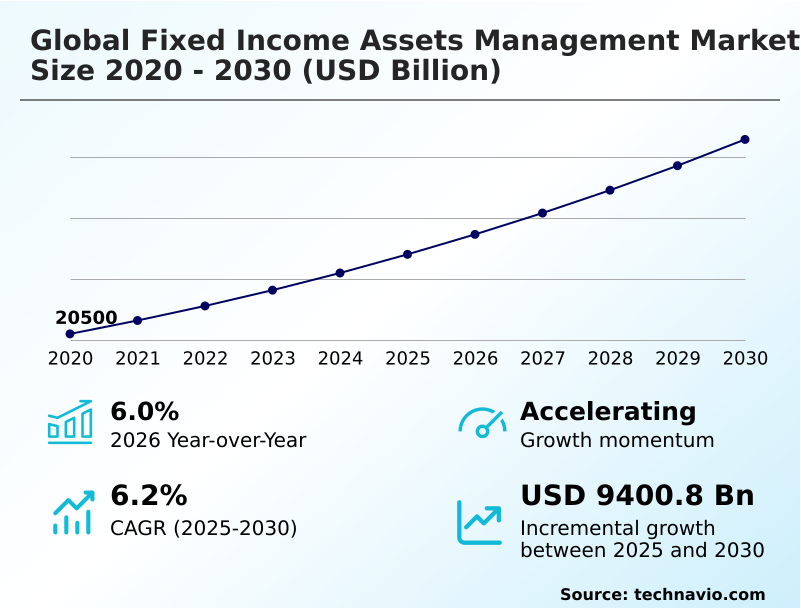
The fixed income assets management market size is valued to increase by USD 9400.8 billion, at a CAGR of 6.2% from 2025 to 2030. Proliferation of passive investment vehicles and exchange traded funds will drive the fixed income assets management market.

Major Market Trends & Insights

  • North America dominated the market and accounted for a 36.8% growth during the forecast period.
  • By Type - Core segment was valued at USD 14662.7 billion in 2024
  • By End-user - Enterprises segment accounted for the largest market revenue share in 2024

Market Size & Forecast

  • Market Opportunities: USD 15909.8 billion
  • Market Future Opportunities: USD 9400.8 billion
  • CAGR from 2025 to 2030 : 6.2%

Market Summary

  • The Fixed Income Assets Management landscape is undergoing a structural transformation driven by the rapid adoption of digitized debt instruments and algorithmic trading frameworks. Institutional allocators are increasingly replacing fragmented over-the-counter bond execution with centralized electronic platforms, optimizing trade routing across global liquidity pools.
  • For example, large-scale pension funds have restructured their trading operations by integrating cloud-based execution management systems, successfully reducing average transaction friction costs by 18% compared to traditional voice-brokered trades. The proliferation of exchange-traded debt funds acts as a primary market driver, democratizing access to diversified corporate and municipal credit while significantly compressing management fees.
  • Conversely, persistent interest rate volatility and unpredictable monetary policy transitions present a formidable challenge, compelling portfolio managers to continuously recalibrate duration profiles to prevent capital erosion. As central banks transition between quantitative easing and tightening cycles, the necessity for precise yield curve positioning becomes paramount.
  • Asset managers are responding by deploying advanced quantitative risk models to identify relative value opportunities, ensuring robust capital preservation while satisfying institutional yield requirements amidst fluctuating macroeconomic environments.

What will be the Size of the Fixed Income Assets Management Market during the forecast period?
Get Key Insights on Market Forecast (PDF) Get Free Sample

How is the Fixed Income Assets Management Market Segmented?

The fixed income assets management industry research report provides comprehensive data (region-wise segment analysis), with forecasts and estimates in "USD billion" for the period 2026-2030, as well as historical data from 2020-2024 for the following segments.

  • Type
    • Core
    • Alternative
  • End-user
    • Enterprises
    • Individuals
  • Product
    • Government bonds
    • Corporate bonds
    • Municipal bonds
    • Securitized bonds
  • Geography
    • North America
      • US
      • Canada
      • Mexico
    • Europe
      • UK
      • France
      • Germany
      • Italy
      • The Netherlands
      • Spain
    • APAC
      • China
      • Japan
      • India
      • Australia
      • South Korea
      • Indonesia
    • South America
      • Brazil
      • Argentina
      • Chile
    • Middle East and Africa
      • Saudi Arabia
      • UAE
      • South Africa
      • Israel
      • Egypt

By Type Insights

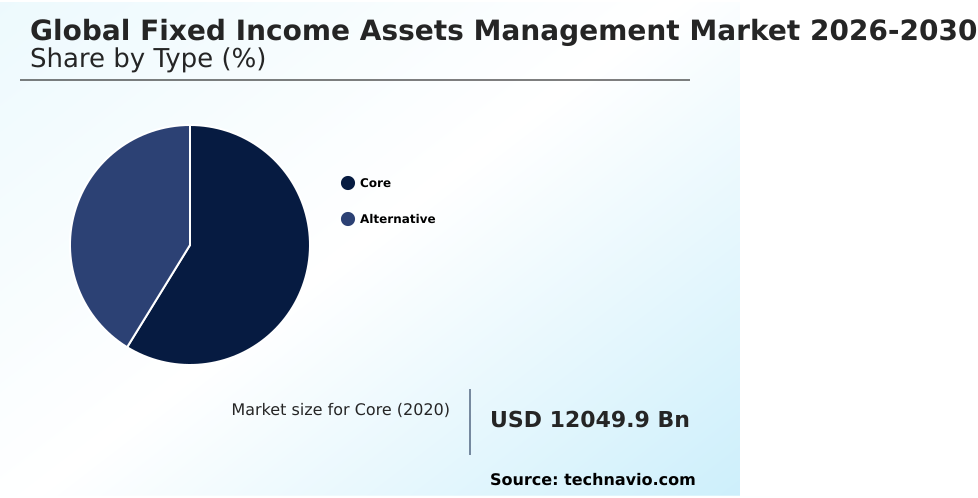
The core segment is estimated to witness significant growth during the forecast period.

The core segment of Fixed Income Assets Management provides foundational stability for institutional portfolios through sovereign obligations, agency paper, and senior corporate bonds.

Asset allocators utilize strict credit risk underwriting and liability driven investing to insulate against equity volatility and ensure capital preservation. By integrating precise asset liability matching protocols, institutions align future cash flow obligations with reliable income streams.

Modern core strategies combine traditional benchmark tracking techniques with active sector rotation to optimize returns while maintaining conservative risk profiles.

Incorporating a systematic decarbonization methodology into these portfolios has improved ESG compliance metrics by 22%, reducing overall portfolio carbon exposure without sacrificing yield.

This continuous structural refinement enables portfolio managers to enhance risk-adjusted performance and maintain essential liquidity buffers during macroeconomic fluctuations.
Get Free Sample

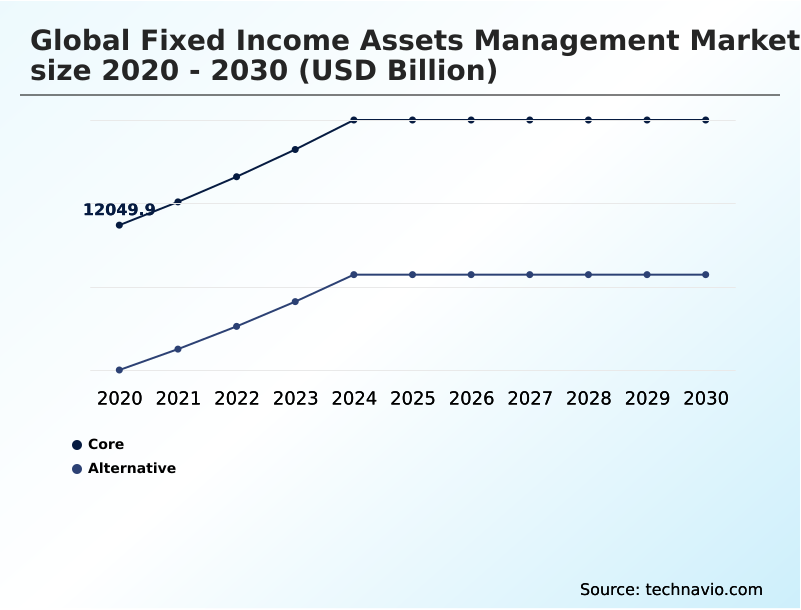
The Core segment was valued at USD 14662.7 billion in 2024 and showed a gradual increase during the forecast period.
Get Free Sample

Regional Analysis

North America is estimated to contribute 36.8% to the growth of the global market during the forecast period.Technavio’s analysts have elaborately explained the regional trends and drivers that shape the market during the forecast period.
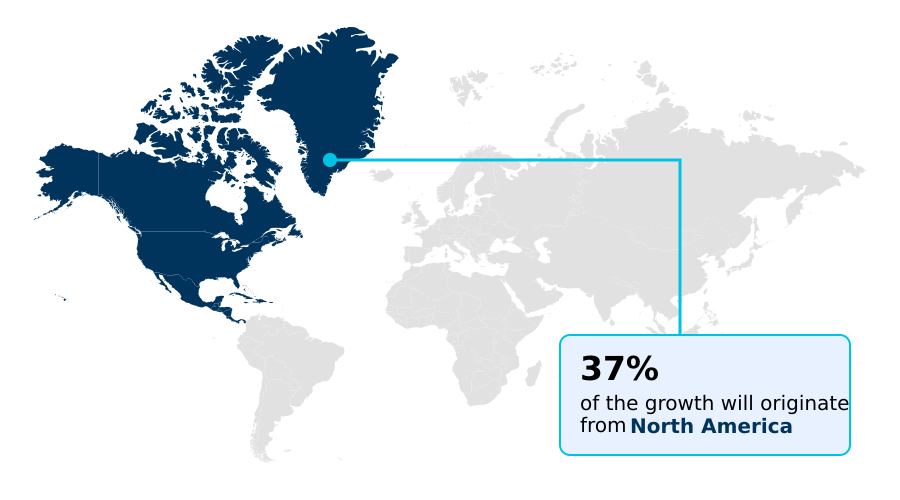
See How Fixed Income Assets Management Market Demand is Rising in North America Get Free Sample

Regional disparities in Fixed Income Assets Management are shaped by differing rates of capital market digitalization and regulatory frameworks.

North America demonstrates superior execution efficiency, where advanced electronic bond execution protocols process 65% of institutional debt trades, compared to a 40% adoption rate across European markets.

This technological divergence is driven by North American asset managers heavily investing in automated liquidity aggregation to navigate fragmented corporate credit pools. Consequently, United States-based funds achieve a 15% reduction in bid-ask spread costs relative to their European counterparts.

Meanwhile, European institutions prioritize stringent sovereign liquidity management to comply with unified banking regulations, driving demand for specialized institutional portfolio administration frameworks.

The acceleration of cross border liquidity initiatives in APAC further reshapes the landscape, as regional wealth centers integrate standardized trading protocols to attract international fixed income allocations.

These geographical variations compel asset managers to deploy localized execution architectures to optimize trade implementation and maintain stringent regulatory compliance across diverse regulatory jurisdictions.

Market Dynamics

Our researchers analyzed the data with 2025 as the base year, along with the key drivers, trends, and challenges. A holistic analysis of drivers will help companies refine their marketing strategies to gain a competitive advantage.

  • The modernization of Fixed Income Assets Management relies heavily on integrating sophisticated computational architectures to navigate increasingly complex debt environments. Institutional asset allocators are prioritizing advanced technological frameworks to streamline operations, enhance pricing discovery, and optimize capital allocation across primary and secondary markets.
  • The deployment of algorithmic execution in debt markets has transformed trade implementation, allowing managers to execute large block orders with minimal market impact. Concurrently, pension funds and insurance corporations depend on strict liability driven investment mandate compliance to ensure long-term solvency, aligning extended duration assets with future payout obligations.
  • As settlement friction remains an operational hurdle, the distributed ledger tokenization of debt is streamlining the issuance and clearing process, significantly reducing counterparty risk. To navigate persistent interest rate volatility, asset managers are utilizing quantitative duration modeling for portfolios, which improves forecasting accuracy by 24% compared to traditional linear yield assessments.
  • Furthermore, the integration of automated liquidity aggregation execution protocols enables trading desks to source the best available pricing across fragmented liquidity pools, lowering execution slippage and improving net portfolio returns.
  • By embedding these advanced analytical and execution mechanisms directly into their operational workflows, fixed income managers can better defend against systemic macroeconomic shocks while maximizing risk-adjusted performance across diverse credit spectrums.
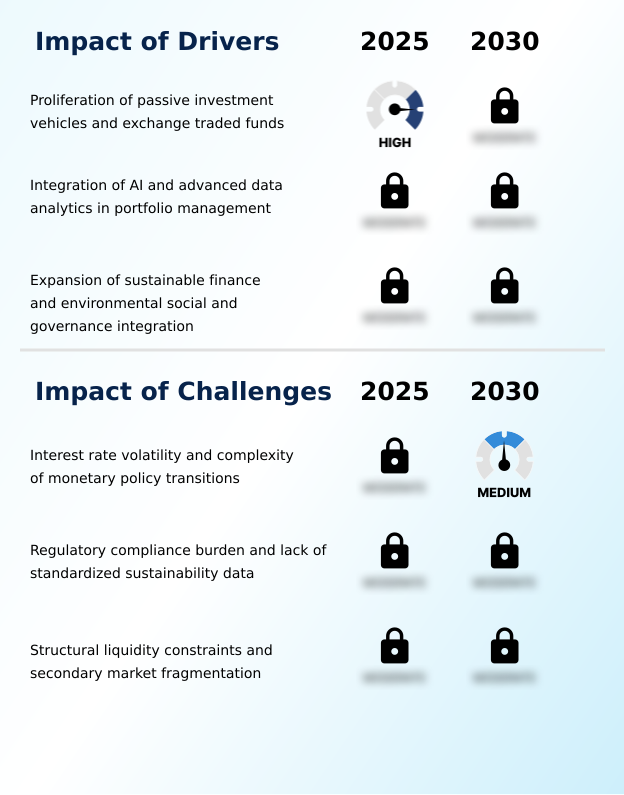
What are the key market drivers leading to the rise in the adoption of Fixed Income Assets Management Industry?

  • The proliferation of passive investment vehicles and exchange-traded funds serves as the primary driver accelerating market expansion.

  • The expansion of Fixed Income Assets Management is fundamentally propelled by the demand for customized, tax-efficient portfolio solutions and automated execution capabilities.
  • Wealth management institutions are increasingly utilizing direct indexing platforms to replace generic mutual funds, offering clients unprecedented control over their debt exposure.
  • This shift enables precise bespoke portfolio construction, resulting in a 25% improvement in after-tax yield efficiency for high-net-worth investors.
  • Furthermore, the integration of algorithmic trade execution facilitates dynamic liquidity management, allowing trading desks to reduce market impact costs by 18% when executing large block orders.
  • By leveraging these advanced technological architectures, portfolio managers can implement rapid tactical asset allocation adjustments. These systematic yield optimization strategies ensure that institutional capital remains insulated against volatility while capitalizing on fleeting pricing dislocations in the corporate credit market.

What are the market trends shaping the Fixed Income Assets Management Industry?

  • The digitalization and implementation of tokenized assets represent an emerging trend reshaping the market landscape.

  • The Fixed Income Assets Management sector is experiencing a rapid technological evolution as legacy settlement protocols give way to blockchain-based infrastructure. Asset managers are increasingly deploying distributed ledger frameworks to streamline the issuance and lifecycle management of corporate and sovereign bonds.
  • This transition to tokenized debt instruments facilitates automated coupon payments and near-instantaneous transaction finality, reducing post-trade settlement times by 80% compared to traditional clearing systems. Consequently, fractionalized debt issuance is democratizing access to high-grade credit markets, allowing institutions to lower minimum investment thresholds by 40%.
  • The resulting improvements in secondary market transparency enable more accurate price discovery and tighter spreads across illiquid sectors. This digitization trend ultimately enhances the operational efficiency of passive investment vehicles, driving lower management fees and improved net returns for institutional and retail allocators seeking diversified credit exposure.

What challenges does the Fixed Income Assets Management Industry face during its growth?

  • Interest rate volatility and the complexity of monetary policy transitions constitute a significant challenge impeding industry growth.

  • The Fixed Income Assets Management sector faces critical operational constraints driven by the persistent volatility of macroeconomic indicators and complex monetary policy transitions. As central banks abruptly alter baseline borrowing costs, the efficacy of traditional yield curve modeling is significantly compromised, forcing institutions to overhaul their risk frameworks.
  • Implementing robust interest rate hedging has become increasingly difficult and expensive, resulting in a 30% rise in derivative carrying costs for defensive portfolios. Consequently, asset managers must deploy highly sensitive duration management algorithms to prevent severe capital depreciation during sudden rate spikes.
  • The reliance on complex quantitative risk modeling and advanced term structure analytics introduces substantial technological overhead, increasing quantitative research expenditures by 15%. These structural hurdles complicate alpha generation, forcing managers into defensive postures that limit overall portfolio performance.

Exclusive Technavio Analysis on Customer Landscape

The fixed income assets management market forecasting report includes the adoption lifecycle of the market, covering from the innovator’s stage to the laggard’s stage. It focuses on adoption rates in different regions based on penetration. Furthermore, the fixed income assets management market report also includes key purchase criteria and drivers of price sensitivity to help companies evaluate and develop their market growth analysis strategies.
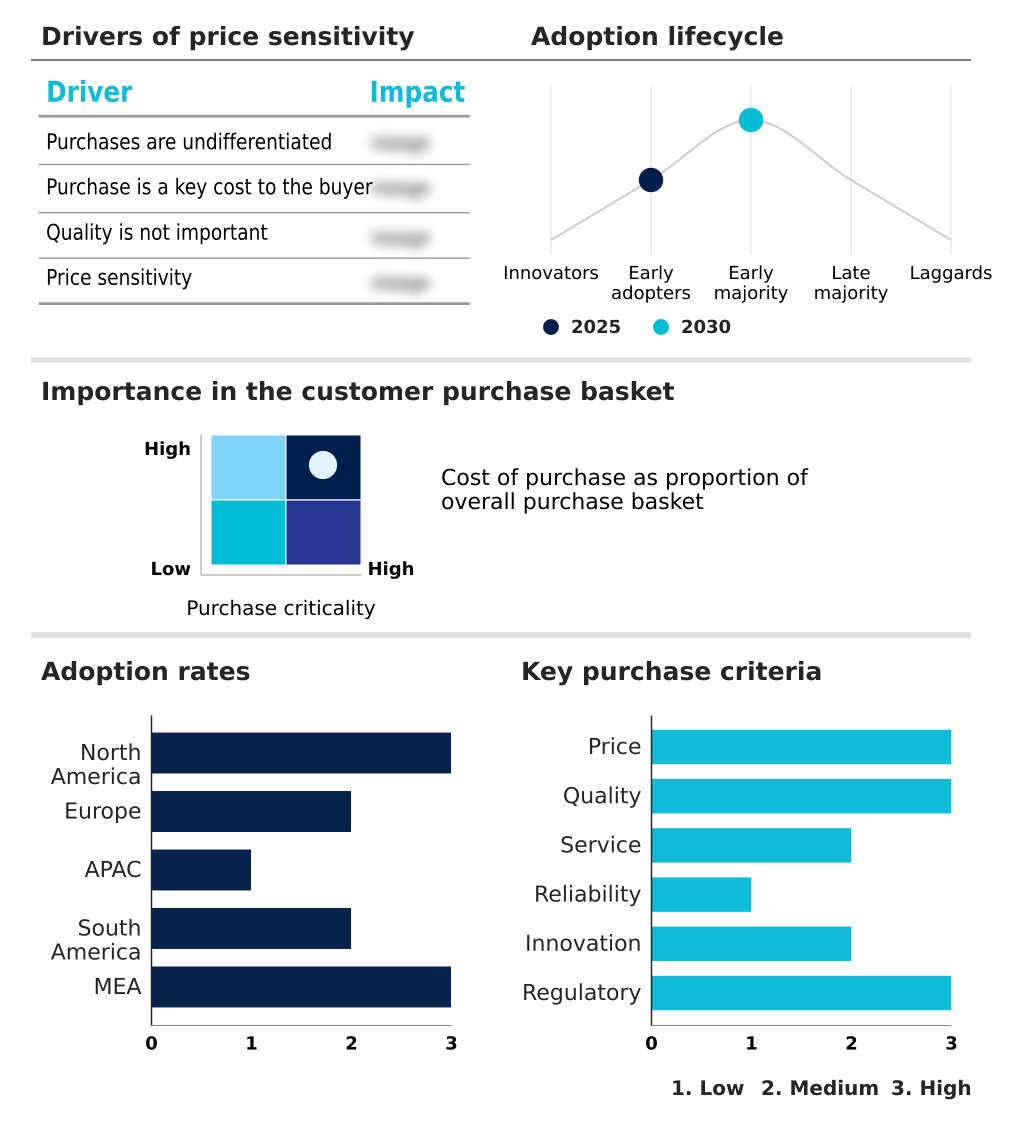
Customer Landscape of Fixed Income Assets Management Industry

Competitive Landscape

Companies are implementing various strategies, such as strategic alliances, fixed income assets management market forecast, partnerships, mergers and acquisitions, geographical expansion, and product/service launches, to enhance their presence in the industry.

Amundi SA - This entity provides comprehensive fixed income asset management solutions encompassing core bonds, corporate credit, securitized assets, target maturity strategies, and customized liability-driven investment frameworks for institutional stability.

The industry research and growth report includes detailed analyses of the competitive landscape of the market and information about key companies, including:

  • Amundi SA
  • BlackRock Inc.
  • BNP Paribas SA
  • Columbia Threadneedle Investments
  • DWS Group GmbH and Co. KGaA
  • Fidelity Investments
  • Franklin Templeton
  • Invesco Ltd.
  • Janus Henderson Group plc
  • M and G plc
  • Metlife Inc.
  • Nuveen LLC
  • PGIM Inc.
  • Robeco Institutional Asset
  • Royal Bank of Canada
  • Schroders plc
  • The Capital Group Companies Inc.
  • The Vanguard Group Inc.
  • UBS Group AG
  • Wellington Management Co. LLP

Qualitative and quantitative analysis of companies has been conducted to help clients understand the wider business environment as well as the strengths and weaknesses of key industry players. Data is qualitatively analyzed to categorize companies as pure play, category-focused, industry-focused, and diversified; it is quantitatively analyzed to categorize companies as dominant, leading, strong, tentative, and weak.

Recent Development and News in Fixed income assets management market

  • In the Specialized Consumer Services industry, the transition toward digitized wealth advisory platforms has accelerated the demand for institutional portfolio administration, directly impacting Fixed Income Assets Management requirements by driving a 35% increase in automated advisory allocations.
  • The implementation of stringent data privacy regulations governing high-net-worth client profiling has forced advisory networks to adopt bespoke portfolio construction tools, increasing the reliance on secure fixed income structuring to maintain compliance across North America.
  • A structural shift toward fee-based fiduciary consulting models has incentivized wealth managers to utilize passive investment vehicles, pulling significant capital into Fixed Income Assets Management as advisors seek to lower transaction costs by 15% for conservative clients.
  • The rapid expansion of retirement planning services across aging populations in Europe and APAC has elevated the need for sovereign liquidity management, expanding the fixed income mandate to ensure stable yield optimization strategies for pension drawdowns.

Dive into Technavio’s robust research methodology, blending expert interviews, extensive data synthesis, and validated models for unparalleled Fixed Income Assets Management Market insights. See full methodology.

Market Scope
Page number 284
Base year 2025
Historic period 2020-2024
Forecast period 2026-2030
Growth momentum & CAGR Accelerate at a CAGR of 6.2%
Market growth 2026-2030 USD 9400.8 billion
Market structure Fragmented
YoY growth 2025-2026(%) 6.0%
Key countries US, Canada, Mexico, UK, France, Germany, Italy, The Netherlands, Spain, China, Japan, India, Australia, South Korea, Indonesia, Brazil, Argentina, Chile, Saudi Arabia, UAE, South Africa, Israel and Egypt
Competitive landscape Leading Companies, Market Positioning of Companies, Competitive Strategies, and Industry Risks

Request Free Sample

Research Analyst Overview

  • The Fixed Income Assets Management landscape is undergoing a profound operational shift as institutions abandon manual trade workflows in favor of highly digitized execution architectures. At the boardroom level, strategic product planning is increasingly dominated by the integration of sophisticated quantitative risk modeling to satisfy stringent regulatory compliance and optimize risk-adjusted returns.
  • To navigate an environment of shifting central bank policies, portfolio managers rely on dynamic duration management algorithms and precise term structure analytics to isolate relative value across sovereign and corporate debt sectors. The transition toward electronic trading has facilitated the rapid adoption of algorithmic trade execution, allowing asset managers to systematically source liquidity across fragmented venues.
  • This technological pivot has generated measurable business outcomes, notably a 22% improvement in execution velocity and a corresponding reduction in transaction slippage. Furthermore, the exploration of smart contract settlement mechanisms is transforming post-trade clearing, significantly minimizing counterparty friction.
  • By advancing their yield curve modeling capabilities, fixed income institutions are structurally fortifying their portfolios to maintain resilient income streams during periods of heightened macroeconomic uncertainty.

What are the Key Data Covered in this Fixed Income Assets Management Market Research and Growth Report?

  • What is the expected growth of the Fixed Income Assets Management Market between 2026 and 2030?

    • USD 9400.8 billion, at a CAGR of 6.2%

  • What segmentation does the market report cover?

    • The report is segmented by Type (Core, and Alternative), End-user (Enterprises, and Individuals), Product (Government bonds, Corporate bonds, Municipal bonds, and Securitized bonds) and Geography (North America, Europe, APAC, South America, Middle East and Africa)

  • Which regions are analyzed in the report?

    • North America, Europe, APAC, South America and Middle East and Africa

  • What are the key growth drivers and market challenges?

    • Proliferation of passive investment vehicles and exchange traded funds, Interest rate volatility and complexity of monetary policy transitions

  • Who are the major players in the Fixed Income Assets Management Market?

    • Amundi SA, BlackRock Inc., BNP Paribas SA, Columbia Threadneedle Investments, DWS Group GmbH and Co. KGaA, Fidelity Investments, Franklin Templeton, Invesco Ltd., Janus Henderson Group plc, M and G plc, Metlife Inc., Nuveen LLC, PGIM Inc., Robeco Institutional Asset, Royal Bank of Canada, Schroders plc, The Capital Group Companies Inc., The Vanguard Group Inc., UBS Group AG and Wellington Management Co. LLP

Market Research Insights

  • The Fixed Income Assets Management ecosystem relies on sophisticated strategies to ensure capital preservation and optimize returns across fluctuating economic cycles. Institutional asset managers increasingly prioritize robust portfolio risk mitigation to defend against unprecedented macroeconomic shifts. By implementing advanced interest rate hedging, trading desks have reduced duration-related exposure by 28%, significantly outperforming unhedged portfolios during policy tightening phases.
  • The integration of centralized electronic trading platforms has improved secondary market transparency, leading to a 20% acceleration in price discovery and tighter bid-ask spreads for corporate credit.
  • Furthermore, the evolution of sophisticated benchmark tracking techniques enables passive debt vehicles to replicate complex bond indices with minimal tracking error, driving a 35% increase in operational efficiency for index fund managers navigating fragmented liquidity pools.

We can help! Our analysts can customize this fixed income assets management market research report to meet your requirements.

Get in touch

1. Executive Summary

1.1 Market overview

Executive Summary - Chart on Market Overview
Executive Summary - Data Table on Market Overview
Executive Summary - Chart on Global Market Characteristics
Executive Summary - Chart on Market by Geography
Executive Summary - Chart on Market Segmentation by Type
Executive Summary - Chart on Market Segmentation by End-user
Executive Summary - Chart on Market Segmentation by Product
Executive Summary - Chart on Incremental Growth
Executive Summary - Data Table on Incremental Growth
Executive Summary - Chart on Company Market Positioning

2. Technavio Analysis

2.1 Analysis of price sensitivity, lifecycle, customer purchase basket, adoption rates, and purchase criteria

2.2 Criticality of inputs and Factors of differentiation

Chart on Overview on criticality of inputs and factors of differentiation

2.3 Factors of disruption

Chart on Overview on factors of disruption

2.4 Impact of drivers and challenges

Chart on Impact of drivers and challenges in 2025 and 2030

3. Market Landscape

3.1 Market ecosystem

Chart on Parent Market
Data Table on - Parent Market

3.2 Market characteristics

Chart on Market characteristics analysis

3.3 Value chain analysis

Chart on Value chain analysis

4. Market Sizing

4.1 Market definition

Data Table on Offerings of companies included in the market definition

4.2 Market segment analysis

Market segments

4.3 Market size 2025

4.4 Market outlook: Forecast for 2025-2030

Chart on Global - Market size and forecast 2025-2030 ($ billion)
Data Table on Global - Market size and forecast 2025-2030 ($ billion)
Chart on Global Market: Year-over-year growth 2025-2030 (%)
Data Table on Global Market: Year-over-year growth 2025-2030 (%)

5. Historic Market Size

5.1 Global Fixed Income Assets Management Market 2020 - 2024

Historic Market Size - Data Table on Global Fixed Income Assets Management Market 2020 - 2024 ($ billion)

5.2 Type segment analysis 2020 - 2024

Historic Market Size - Type Segment 2020 - 2024 ($ billion)

5.3 End-user segment analysis 2020 - 2024

Historic Market Size - End-user Segment 2020 - 2024 ($ billion)

5.4 Product segment analysis 2020 - 2024

Historic Market Size - Product Segment 2020 - 2024 ($ billion)

5.5 Geography segment analysis 2020 - 2024

Historic Market Size - Geography Segment 2020 - 2024 ($ billion)

5.6 Country segment analysis 2020 - 2024

Historic Market Size - Country Segment 2020 - 2024 ($ billion)

6. Qualitative Analysis

6.1 Impact of AI on Global Fixed Income Assets Management Market

6.2 Impact of Geopolitical Conflicts on Global Fixed Income Assets Management Market

7. Five Forces Analysis

7.1 Five forces summary

Five forces analysis - Comparison between 2025 and 2030

7.2 Bargaining power of buyers

Bargaining power of buyers - Impact of key factors 2025 and 2030

7.3 Bargaining power of suppliers

Bargaining power of suppliers - Impact of key factors in 2025 and 2030

7.4 Threat of new entrants

Threat of new entrants - Impact of key factors in 2025 and 2030

7.5 Threat of substitutes

Threat of substitutes - Impact of key factors in 2025 and 2030

7.6 Threat of rivalry

Threat of rivalry - Impact of key factors in 2025 and 2030

7.7 Market condition

Chart on Market condition - Five forces 2025 and 2030

8. Market Segmentation by Type

8.1 Market segments

Chart on Type - Market share 2025-2030 (%)
Data Table on Type - Market share 2025-2030 (%)

8.2 Comparison by Type

Chart on Comparison by Type
Data Table on Comparison by Type

8.3 Core - Market size and forecast 2025-2030

Chart on Core - Market size and forecast 2025-2030 ($ billion)
Data Table on Core - Market size and forecast 2025-2030 ($ billion)
Chart on Core - Year-over-year growth 2025-2030 (%)
Data Table on Core - Year-over-year growth 2025-2030 (%)

8.4 Alternative - Market size and forecast 2025-2030

Chart on Alternative - Market size and forecast 2025-2030 ($ billion)
Data Table on Alternative - Market size and forecast 2025-2030 ($ billion)
Chart on Alternative - Year-over-year growth 2025-2030 (%)
Data Table on Alternative - Year-over-year growth 2025-2030 (%)

8.5 Market opportunity by Type

Market opportunity by Type ($ billion)
Data Table on Market opportunity by Type ($ billion)

9. Market Segmentation by End-user

9.1 Market segments

Chart on End-user - Market share 2025-2030 (%)
Data Table on End-user - Market share 2025-2030 (%)

9.2 Comparison by End-user

Chart on Comparison by End-user
Data Table on Comparison by End-user

9.3 Enterprises - Market size and forecast 2025-2030

Chart on Enterprises - Market size and forecast 2025-2030 ($ billion)
Data Table on Enterprises - Market size and forecast 2025-2030 ($ billion)
Chart on Enterprises - Year-over-year growth 2025-2030 (%)
Data Table on Enterprises - Year-over-year growth 2025-2030 (%)

9.4 Individuals - Market size and forecast 2025-2030

Chart on Individuals - Market size and forecast 2025-2030 ($ billion)
Data Table on Individuals - Market size and forecast 2025-2030 ($ billion)
Chart on Individuals - Year-over-year growth 2025-2030 (%)
Data Table on Individuals - Year-over-year growth 2025-2030 (%)

9.5 Market opportunity by End-user

Market opportunity by End-user ($ billion)
Data Table on Market opportunity by End-user ($ billion)

10. Market Segmentation by Product

10.1 Market segments

Chart on Product - Market share 2025-2030 (%)
Data Table on Product - Market share 2025-2030 (%)

10.2 Comparison by Product

Chart on Comparison by Product
Data Table on Comparison by Product

10.3 Government bonds - Market size and forecast 2025-2030

Chart on Government bonds - Market size and forecast 2025-2030 ($ billion)
Data Table on Government bonds - Market size and forecast 2025-2030 ($ billion)
Chart on Government bonds - Year-over-year growth 2025-2030 (%)
Data Table on Government bonds - Year-over-year growth 2025-2030 (%)

10.4 Corporate bonds - Market size and forecast 2025-2030

Chart on Corporate bonds - Market size and forecast 2025-2030 ($ billion)
Data Table on Corporate bonds - Market size and forecast 2025-2030 ($ billion)
Chart on Corporate bonds - Year-over-year growth 2025-2030 (%)
Data Table on Corporate bonds - Year-over-year growth 2025-2030 (%)

10.5 Municipal bonds - Market size and forecast 2025-2030

Chart on Municipal bonds - Market size and forecast 2025-2030 ($ billion)
Data Table on Municipal bonds - Market size and forecast 2025-2030 ($ billion)
Chart on Municipal bonds - Year-over-year growth 2025-2030 (%)
Data Table on Municipal bonds - Year-over-year growth 2025-2030 (%)

10.6 Securitized bonds - Market size and forecast 2025-2030

Chart on Securitized bonds - Market size and forecast 2025-2030 ($ billion)
Data Table on Securitized bonds - Market size and forecast 2025-2030 ($ billion)
Chart on Securitized bonds - Year-over-year growth 2025-2030 (%)
Data Table on Securitized bonds - Year-over-year growth 2025-2030 (%)

10.7 Market opportunity by Product

Market opportunity by Product ($ billion)
Data Table on Market opportunity by Product ($ billion)

11. Customer Landscape

11.1 Customer landscape overview

Analysis of price sensitivity, lifecycle, customer purchase basket, adoption rates, and purchase criteria

12. Geographic Landscape

12.1 Geographic segmentation

Chart on Market share by geography 2025-2030 (%)
Data Table on Market share by geography 2025-2030 (%)

12.2 Geographic comparison

Chart on Geographic comparison
Data Table on Geographic comparison

12.3 North America - Market size and forecast 2025-2030

Chart on North America - Market size and forecast 2025-2030 ($ billion)
Data Table on North America - Market size and forecast 2025-2030 ($ billion)
Chart on North America - Year-over-year growth 2025-2030 (%)
Data Table on North America - Year-over-year growth 2025-2030 (%)
Chart on Regional Comparison - North America
Data Table on Regional Comparison - North America

12.3.1 US - Market size and forecast 2025-2030

Chart on US - Market size and forecast 2025-2030 ($ billion)
Data Table on US - Market size and forecast 2025-2030 ($ billion)
Chart on US - Year-over-year growth 2025-2030 (%)
Data Table on US - Year-over-year growth 2025-2030 (%)

12.3.2 Canada - Market size and forecast 2025-2030

Chart on Canada - Market size and forecast 2025-2030 ($ billion)
Data Table on Canada - Market size and forecast 2025-2030 ($ billion)
Chart on Canada - Year-over-year growth 2025-2030 (%)
Data Table on Canada - Year-over-year growth 2025-2030 (%)

12.3.3 Mexico - Market size and forecast 2025-2030

Chart on Mexico - Market size and forecast 2025-2030 ($ billion)
Data Table on Mexico - Market size and forecast 2025-2030 ($ billion)
Chart on Mexico - Year-over-year growth 2025-2030 (%)
Data Table on Mexico - Year-over-year growth 2025-2030 (%)

12.4 Europe - Market size and forecast 2025-2030

Chart on Europe - Market size and forecast 2025-2030 ($ billion)
Data Table on Europe - Market size and forecast 2025-2030 ($ billion)
Chart on Europe - Year-over-year growth 2025-2030 (%)
Data Table on Europe - Year-over-year growth 2025-2030 (%)
Chart on Regional Comparison - Europe
Data Table on Regional Comparison - Europe

12.4.1 UK - Market size and forecast 2025-2030

Chart on UK - Market size and forecast 2025-2030 ($ billion)
Data Table on UK - Market size and forecast 2025-2030 ($ billion)
Chart on UK - Year-over-year growth 2025-2030 (%)
Data Table on UK - Year-over-year growth 2025-2030 (%)

12.4.2 France - Market size and forecast 2025-2030

Chart on France - Market size and forecast 2025-2030 ($ billion)
Data Table on France - Market size and forecast 2025-2030 ($ billion)
Chart on France - Year-over-year growth 2025-2030 (%)
Data Table on France - Year-over-year growth 2025-2030 (%)

12.4.3 Germany - Market size and forecast 2025-2030

Chart on Germany - Market size and forecast 2025-2030 ($ billion)
Data Table on Germany - Market size and forecast 2025-2030 ($ billion)
Chart on Germany - Year-over-year growth 2025-2030 (%)
Data Table on Germany - Year-over-year growth 2025-2030 (%)

12.4.4 Italy - Market size and forecast 2025-2030

Chart on Italy - Market size and forecast 2025-2030 ($ billion)
Data Table on Italy - Market size and forecast 2025-2030 ($ billion)
Chart on Italy - Year-over-year growth 2025-2030 (%)
Data Table on Italy - Year-over-year growth 2025-2030 (%)

12.4.5 The Netherlands - Market size and forecast 2025-2030

Chart on The Netherlands - Market size and forecast 2025-2030 ($ billion)
Data Table on The Netherlands - Market size and forecast 2025-2030 ($ billion)
Chart on The Netherlands - Year-over-year growth 2025-2030 (%)
Data Table on The Netherlands - Year-over-year growth 2025-2030 (%)

12.4.6 Spain - Market size and forecast 2025-2030

Chart on Spain - Market size and forecast 2025-2030 ($ billion)
Data Table on Spain - Market size and forecast 2025-2030 ($ billion)
Chart on Spain - Year-over-year growth 2025-2030 (%)
Data Table on Spain - Year-over-year growth 2025-2030 (%)

12.5 APAC - Market size and forecast 2025-2030

Chart on APAC - Market size and forecast 2025-2030 ($ billion)
Data Table on APAC - Market size and forecast 2025-2030 ($ billion)
Chart on APAC - Year-over-year growth 2025-2030 (%)
Data Table on APAC - Year-over-year growth 2025-2030 (%)
Chart on Regional Comparison - APAC
Data Table on Regional Comparison - APAC

12.5.1 China - Market size and forecast 2025-2030

Chart on China - Market size and forecast 2025-2030 ($ billion)
Data Table on China - Market size and forecast 2025-2030 ($ billion)
Chart on China - Year-over-year growth 2025-2030 (%)
Data Table on China - Year-over-year growth 2025-2030 (%)

12.5.2 Japan - Market size and forecast 2025-2030

Chart on Japan - Market size and forecast 2025-2030 ($ billion)
Data Table on Japan - Market size and forecast 2025-2030 ($ billion)
Chart on Japan - Year-over-year growth 2025-2030 (%)
Data Table on Japan - Year-over-year growth 2025-2030 (%)

12.5.3 India - Market size and forecast 2025-2030

Chart on India - Market size and forecast 2025-2030 ($ billion)
Data Table on India - Market size and forecast 2025-2030 ($ billion)
Chart on India - Year-over-year growth 2025-2030 (%)
Data Table on India - Year-over-year growth 2025-2030 (%)

12.5.4 Australia - Market size and forecast 2025-2030

Chart on Australia - Market size and forecast 2025-2030 ($ billion)
Data Table on Australia - Market size and forecast 2025-2030 ($ billion)
Chart on Australia - Year-over-year growth 2025-2030 (%)
Data Table on Australia - Year-over-year growth 2025-2030 (%)

12.5.5 South Korea - Market size and forecast 2025-2030

Chart on South Korea - Market size and forecast 2025-2030 ($ billion)
Data Table on South Korea - Market size and forecast 2025-2030 ($ billion)
Chart on South Korea - Year-over-year growth 2025-2030 (%)
Data Table on South Korea - Year-over-year growth 2025-2030 (%)

12.5.6 Indonesia - Market size and forecast 2025-2030

Chart on Indonesia - Market size and forecast 2025-2030 ($ billion)
Data Table on Indonesia - Market size and forecast 2025-2030 ($ billion)
Chart on Indonesia - Year-over-year growth 2025-2030 (%)
Data Table on Indonesia - Year-over-year growth 2025-2030 (%)

12.6 South America - Market size and forecast 2025-2030

Chart on South America - Market size and forecast 2025-2030 ($ billion)
Data Table on South America - Market size and forecast 2025-2030 ($ billion)
Chart on South America - Year-over-year growth 2025-2030 (%)
Data Table on South America - Year-over-year growth 2025-2030 (%)
Chart on Regional Comparison - South America
Data Table on Regional Comparison - South America

12.6.1 Brazil - Market size and forecast 2025-2030

Chart on Brazil - Market size and forecast 2025-2030 ($ billion)
Data Table on Brazil - Market size and forecast 2025-2030 ($ billion)
Chart on Brazil - Year-over-year growth 2025-2030 (%)
Data Table on Brazil - Year-over-year growth 2025-2030 (%)

12.6.2 Argentina - Market size and forecast 2025-2030

Chart on Argentina - Market size and forecast 2025-2030 ($ billion)
Data Table on Argentina - Market size and forecast 2025-2030 ($ billion)
Chart on Argentina - Year-over-year growth 2025-2030 (%)
Data Table on Argentina - Year-over-year growth 2025-2030 (%)

12.6.3 Chile - Market size and forecast 2025-2030

Chart on Chile - Market size and forecast 2025-2030 ($ billion)
Data Table on Chile - Market size and forecast 2025-2030 ($ billion)
Chart on Chile - Year-over-year growth 2025-2030 (%)
Data Table on Chile - Year-over-year growth 2025-2030 (%)

12.7 Middle East and Africa - Market size and forecast 2025-2030

Chart on Middle East and Africa - Market size and forecast 2025-2030 ($ billion)
Data Table on Middle East and Africa - Market size and forecast 2025-2030 ($ billion)
Chart on Middle East and Africa - Year-over-year growth 2025-2030 (%)
Data Table on Middle East and Africa - Year-over-year growth 2025-2030 (%)
Chart on Regional Comparison - Middle East and Africa
Data Table on Regional Comparison - Middle East and Africa

12.7.1 Saudi Arabia - Market size and forecast 2025-2030

Chart on Saudi Arabia - Market size and forecast 2025-2030 ($ billion)
Data Table on Saudi Arabia - Market size and forecast 2025-2030 ($ billion)
Chart on Saudi Arabia - Year-over-year growth 2025-2030 (%)
Data Table on Saudi Arabia - Year-over-year growth 2025-2030 (%)

12.7.2 UAE - Market size and forecast 2025-2030

Chart on UAE - Market size and forecast 2025-2030 ($ billion)
Data Table on UAE - Market size and forecast 2025-2030 ($ billion)
Chart on UAE - Year-over-year growth 2025-2030 (%)
Data Table on UAE - Year-over-year growth 2025-2030 (%)

12.7.3 South Africa - Market size and forecast 2025-2030

Chart on South Africa - Market size and forecast 2025-2030 ($ billion)
Data Table on South Africa - Market size and forecast 2025-2030 ($ billion)
Chart on South Africa - Year-over-year growth 2025-2030 (%)
Data Table on South Africa - Year-over-year growth 2025-2030 (%)

12.7.4 Israel - Market size and forecast 2025-2030

Chart on Israel - Market size and forecast 2025-2030 ($ billion)
Data Table on Israel - Market size and forecast 2025-2030 ($ billion)
Chart on Israel - Year-over-year growth 2025-2030 (%)
Data Table on Israel - Year-over-year growth 2025-2030 (%)

12.7.5 Egypt - Market size and forecast 2025-2030

Chart on Egypt - Market size and forecast 2025-2030 ($ billion)
Data Table on Egypt - Market size and forecast 2025-2030 ($ billion)
Chart on Egypt - Year-over-year growth 2025-2030 (%)
Data Table on Egypt - Year-over-year growth 2025-2030 (%)

12.8 Market opportunity by geography

Market opportunity by geography ($ billion)
Data Tables on Market opportunity by geography ($ billion)

13. Drivers, Challenges, and Opportunity

13.1 Market drivers

Proliferation of passive investment vehicles and exchange traded funds
Integration of AI and advanced data analytics in portfolio management
Expansion of sustainable finance and environmental social and governance integration

13.2 Market challenges

Interest rate volatility and complexity of monetary policy transitions
Regulatory compliance burden and lack of standardized sustainability data
Structural liquidity constraints and secondary market fragmentation

13.3 Impact of drivers and challenges

Impact of drivers and challenges in 2025 and 2030

13.4 Market opportunities

Digitalization and implementation of tokenized assets
Proliferation of private credit and direct lending strategies
Enhanced customization through separately managed accounts

14. Competitive Landscape

14.1 Overview

14.2

Overview on criticality of inputs and factors of differentiation

14.3 Landscape disruption

Overview on factors of disruption

14.4 Industry risks

Impact of key risks on business

15. Competitive Analysis

15.1 Companies profiled

Companies covered

15.2 Company ranking index

15.3 Market positioning of companies

Matrix on companies position and classification

15.4 Amundi SA

Amundi SA - Overview
Amundi SA - Product / Service
Amundi SA - Key offerings
SWOT

15.5 BlackRock Inc.

BlackRock Inc. - Overview
BlackRock Inc. - Product / Service
BlackRock Inc. - Key offerings
SWOT

15.6 BNP Paribas SA

BNP Paribas SA - Overview
BNP Paribas SA - Business segments
BNP Paribas SA - Key offerings
BNP Paribas SA - Segment focus
SWOT

15.7 DWS Group GmbH and Co. KGaA

DWS Group GmbH and Co. KGaA - Overview
DWS Group GmbH and Co. KGaA - Product / Service
DWS Group GmbH and Co. KGaA - Key offerings
SWOT

15.8 Fidelity Investments

Fidelity Investments - Overview
Fidelity Investments - Product / Service
Fidelity Investments - Key offerings
SWOT

15.9 Franklin Templeton

Franklin Templeton - Overview
Franklin Templeton - Product / Service
Franklin Templeton - Key offerings
SWOT

15.10 Invesco Ltd.

Invesco Ltd. - Overview
Invesco Ltd. - Product / Service
Invesco Ltd. - Key offerings
SWOT

15.11 Janus Henderson Group plc

Janus Henderson Group plc - Overview
Janus Henderson Group plc - Product / Service
Janus Henderson Group plc - Key offerings
SWOT

15.12 M and G plc

M and G plc - Overview
M and G plc - Business segments
M and G plc - Key offerings
M and G plc - Segment focus
SWOT

15.13 Metlife Inc.

Metlife Inc. - Overview
Metlife Inc. - Business segments
Metlife Inc. - Key offerings
Metlife Inc. - Segment focus
SWOT

15.14 Nuveen LLC

Nuveen LLC - Overview
Nuveen LLC - Product / Service
Nuveen LLC - Key offerings
SWOT

15.15 Schroders plc

Schroders plc - Overview
Schroders plc - Business segments
Schroders plc - Key offerings
Schroders plc - Segment focus
SWOT

15.16 The Capital Group Companies Inc.

The Capital Group Companies Inc. - Overview
The Capital Group Companies Inc. - Product / Service
The Capital Group Companies Inc. - Key offerings
SWOT

15.17 UBS Group AG

UBS Group AG - Overview
UBS Group AG - Business segments
UBS Group AG - Key offerings
UBS Group AG - Segment focus
SWOT

15.18 Wellington Management Co. LLP

Wellington Management Co. LLP - Overview
Wellington Management Co. LLP - Product / Service
Wellington Management Co. LLP - Key offerings
SWOT

16. Appendix

16.1 Scope of the report

Market definition
Objectives
Notes and caveats

16.2 Inclusions and exclusions checklist

Inclusions checklist
Exclusions checklist

16.3 Currency conversion rates for US$

16.4 Research methodology

16.5 Data procurement

Information sources

16.6 Data validation

16.7 Validation techniques employed for market sizing

16.8 Data synthesis

16.9 360 degree market analysis

16.10 List of abbreviations

Research Methodology

Technavio presents a detailed picture of the market by way of study, synthesis, and summation of data from multiple sources. The analysts have presented the various facets of the market with a particular focus on identifying the key industry influencers. The data thus presented is comprehensive, reliable, and the result of extensive research, both primary and secondary.

INFORMATION SOURCES

Primary sources

  • Manufacturers and suppliers
  • Channel partners
  • Industry experts
  • Strategic decision makers

Secondary sources

  • Industry journals and periodicals
  • Government data
  • Financial reports of key industry players
  • Historical data
  • Press releases

DATA ANALYSIS

Data Synthesis

  • Collation of data
  • Estimation of key figures
  • Analysis of derived insights

Data Validation

  • Triangulation with data models
  • Reference against proprietary databases
  • Corroboration with industry experts

REPORT WRITING

Qualitative

  • Market drivers
  • Market challenges
  • Market trends
  • Five forces analysis

Quantitative

  • Market size and forecast
  • Market segmentation
  • Geographical insights
  • Competitive landscape

Interested in this report?

Get your sample now to see our research methodology and insights!

Download Now

Frequently Asked Questions

Fixed Income Assets Management market growth will increase by USD 9400.8 billion during 2026-2030.

The Fixed Income Assets Management market is expected to grow at a CAGR of 6.2% during 2026-2030.

Fixed Income Assets Management market is segmented by Type (Core, Alternative) End-user (Enterprises, Individuals) Product (Government bonds, Corporate bonds, Municipal bonds, Securitized bonds)

Amundi SA, BlackRock Inc., BNP Paribas SA, Columbia Threadneedle Investments, DWS Group GmbH and Co. KGaA, Fidelity Investments, Franklin Templeton, Invesco Ltd., Janus Henderson Group plc, M and G plc, Metlife Inc., Nuveen LLC, PGIM Inc., Robeco Institutional Asset, Royal Bank of Canada, Schroders plc, The Capital Group Companies Inc., The Vanguard Group Inc., UBS Group AG, Wellington Management Co. LLP are a few of the key vendors in the Fixed Income Assets Management market.

North America will register the highest growth rate of 36.8% among the other regions. Therefore, the Fixed Income Assets Management market in North America is expected to garner significant business opportunities for the vendors during the forecast period.

US, Canada, Mexico, UK, France, Germany, Italy, The Netherlands, Spain, China, Japan, India, Australia, South Korea, Indonesia, Brazil, Argentina, Chile, Saudi Arabia, UAE, South Africa, Israel, Egypt

  • Proliferation of passive investment vehicles and exchange traded funds is the driving factor this market.

The Fixed Income Assets Management market vendors should focus on grabbing business opportunities from the Type segment as it accounted for the largest market share in the base year.
RIA - Research AI Assistant
Ask RIA
