Fitness App Market Analysis, Size, and Forecast 2026-2030: North America (US, Canada, and Mexico), APAC (China, India, and Japan), Europe (Germany, UK, and France), South America (Brazil and Argentina), Middle East and Africa (Saudi Arabia, UAE, and South Africa), and Rest of World (ROW)

Fitness App Market Analysis, Size, and Forecast 2026-2030:
North America (US, Canada, and Mexico), APAC (China, India, and Japan), Europe (Germany, UK, and France), South America (Brazil and Argentina), Middle East and Africa (Saudi Arabia, UAE, and South Africa), and Rest of World (ROW)

Published: May 2026 287 Pages SKU: IRTNTR40200

Market Overview at a Glance

$155.69 B
Market Opportunity
28.6%
CAGR 2025 - 2030
30.5%
APAC Growth
$30.16 B
Female segment 2024

Fitness App Market Size 2026-2030

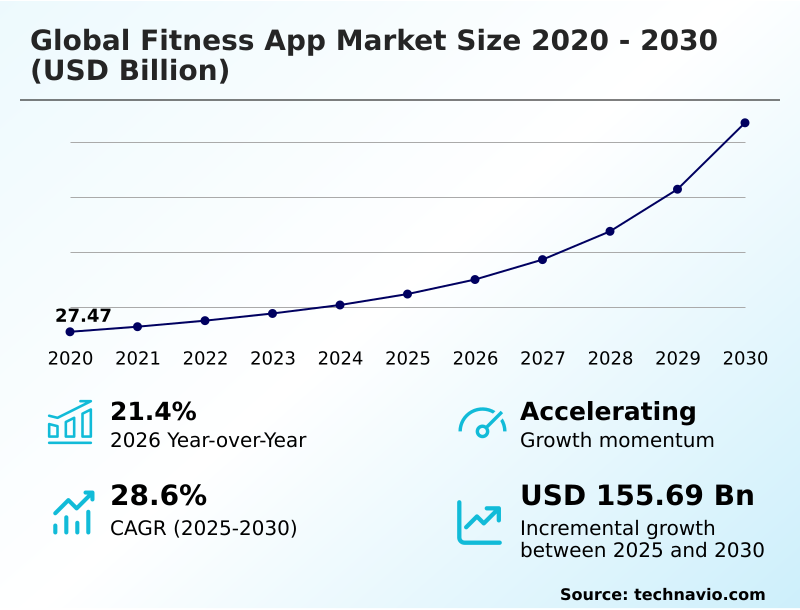
The fitness app market size is valued to increase by USD 155.69 billion, at a CAGR of 28.6% from 2025 to 2030. Institutionalization of AI and predictive health analytics will drive the fitness app market.

Major Market Trends & Insights

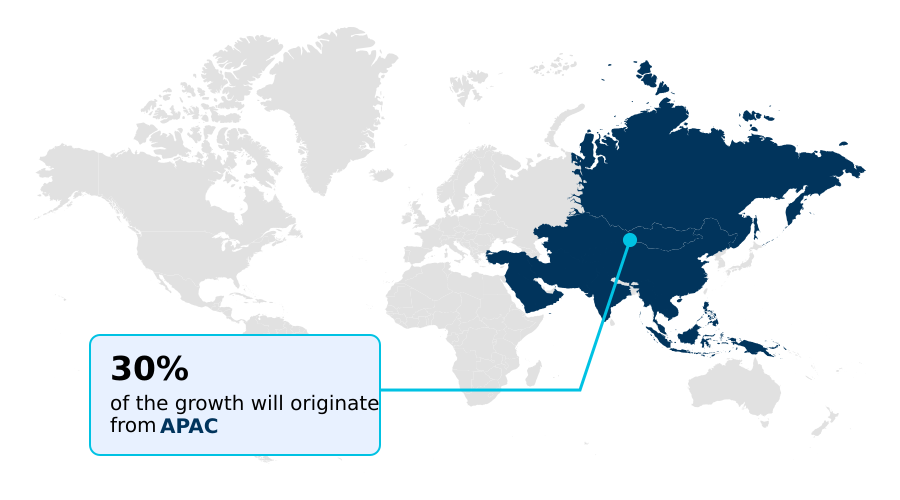
  • APAC dominated the market and accounted for a 30.5% growth during the forecast period.
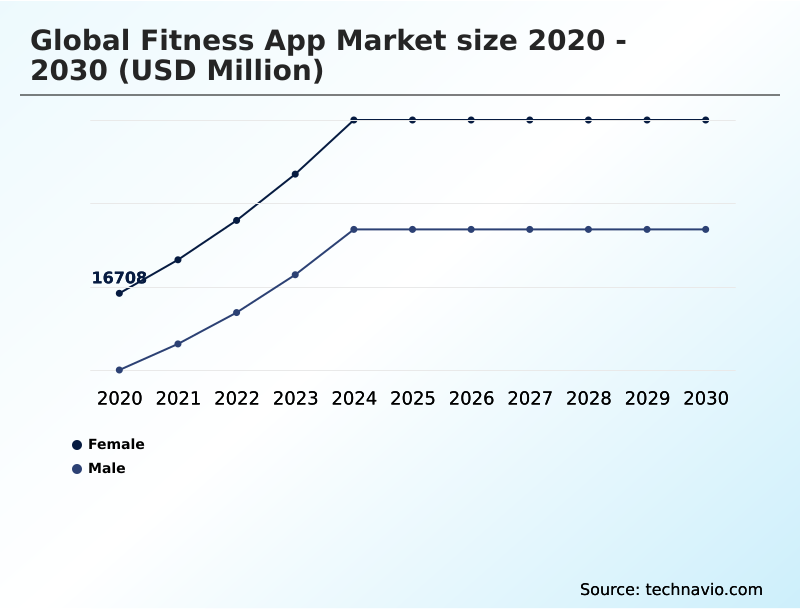
  • By Gender - Female segment was valued at USD 30.16 billion in 2024
  • By Application - Lifestyle monitoring segment accounted for the largest market revenue share in 2024

Market Size & Forecast

  • Market Opportunities: USD 189.99 billion
  • Market Future Opportunities: USD 155.69 billion
  • CAGR from 2025 to 2030 : 28.6%

Market Summary

  • The fitness app market is undergoing a profound evolution, moving beyond simple activity logging to become a central component of digital health ecosystems. This transition is driven by the institutionalization of AI-driven coaching and predictive health analytics, which offer users hyper-personalized training and wellness guidance.
  • The integration with an expanding array of wearable sensors allows for sophisticated biometric data analysis, tracking metrics like heart rate variability and sleep quality to deliver actionable insights.
  • For instance, corporations are increasingly adopting these platforms for their wellness programs, using aggregated, anonymized data to measure the ROI of their health initiatives by correlating app engagement with reduced absenteeism, demonstrating a tangible business case.
  • However, this data-rich environment creates challenges related to user attrition and the critical need for robust data privacy, pushing developers to innovate on engagement and security. The market's future hinges on creating a seamless, valuable, and trustworthy cross-device user experience that integrates into both personal and professional life.

What will be the Size of the Fitness App Market during the forecast period?

Get Key Insights on Market Forecast (PDF) Request Free Sample

How is the Fitness App Market Segmented?

The fitness app industry research report provides comprehensive data (region-wise segment analysis), with forecasts and estimates in "USD million" for the period 2026-2030, as well as historical data from 2020-2024 for the following segments.

  • Gender
    • Female
    • Male
  • Application
    • Lifestyle monitoring
    • Health monitoring
    • Others
  • Platform
    • iOS
    • Android
  • Geography
    • North America
      • US
      • Canada
      • Mexico
    • APAC
      • China
      • India
      • Japan
    • Europe
      • Germany
      • UK
      • France
    • South America
      • Brazil
      • Argentina
    • Middle East and Africa
      • Saudi Arabia
      • UAE
      • South Africa
    • Rest of World (ROW)

By Gender Insights

The female segment is estimated to witness significant growth during the forecast period.

The female segment shows high engagement with holistic wellness platforms and community-driven fitness, prioritizing diverse exercise modalities and specialized health tracking.

These users leverage mobile software applications for specific life stages, driving demand for at-home exercise programming that integrates mental health and social connectivity.

Consequently, platforms that deliver a guided, progressive fitness journey through personalized workout algorithms and biometric feedback systems see higher adoption.

The integration of gamification architecture has been shown to increase daily active user rates by nearly 30%, demonstrating a clear path to improving retention within this demographic.

This reflects a broader trend where data-driven coaching and habit-formation engines are essential for sustained engagement, moving beyond basic workout libraries to offer a comprehensive digital fitness transformation.

Request Free Sample

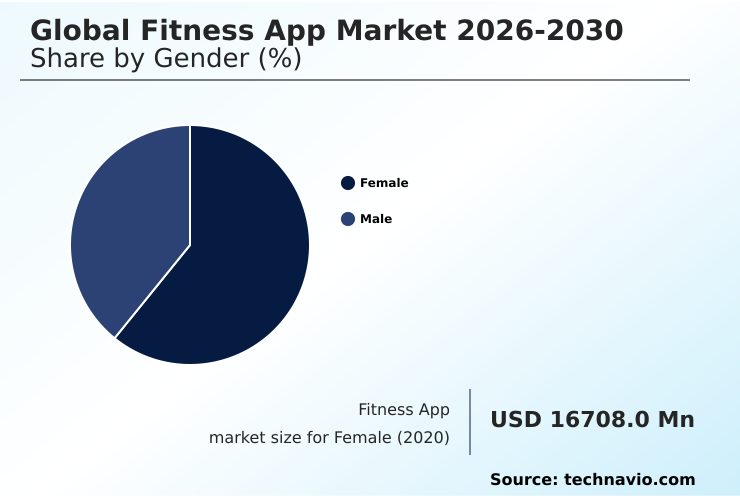
The Female segment was valued at USD 30.16 billion in 2024 and showed a gradual increase during the forecast period.

Request Free Sample

Regional Analysis

APAC is estimated to contribute 30.5% to the growth of the global market during the forecast period.Technavio’s analysts have elaborately explained the regional trends and drivers that shape the market during the forecast period.

See How Fitness App Market Demand is Rising in APAC Request Free Sample

The geographic landscape is dynamic, with APAC emerging as the fastest-growing region, contributing approximately 30.5% of the market's incremental growth, driven by rapid smartphone adoption and a rising middle class.

This contrasts with North America, which remains a primary revenue generator and presents a 30.36% market opportunity, characterized by high adoption of premium subscription-based fitness models and connected fitness ecosystems.

In Europe, stringent data privacy regulations influence the development of digital therapeutics frameworks. These mature markets are seeing a rise in remote coaching models and virtual running clubs.

The development of AI-powered health platforms and software-only biometric analysis is crucial for penetrating emerging economies, where localized content and affordable freemium business models are key to capturing market share and building sustainable user bases.
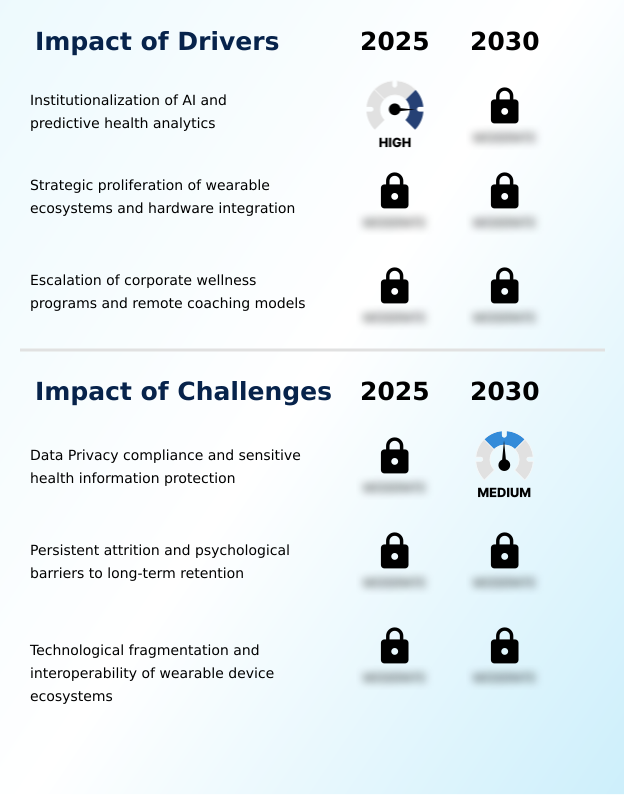
Market Dynamics

Our researchers analyzed the data with 2025 as the base year, along with the key drivers, trends, and challenges. A holistic analysis of drivers will help companies refine their marketing strategies to gain a competitive advantage.

  • The evolution of the fitness app market hinges on moving beyond standalone applications toward a deeply integrated, holistic wellness experience. A core strategic focus is overcoming user attrition in mobile fitness, where initial engagement often fails to translate into long-term retention.
  • Successfully integrating wearables with fitness apps is a foundational step, but the real challenge lies in resolving interoperability challenges in fitness tech to ensure seamless cross-platform data synchronization. This allows for the collection of rich biometric data for predictive health, which is essential for advanced AI for personalized workout generation.
  • Forward-thinking companies are exploring how to build a decentralized fitness metaverse, leveraging gamification strategies for user retention and creating social accountability in apps. The rise of AI coaches versus human trainers highlights a pivotal shift, raising ethical considerations in AI health coaching while offering scalability.
  • To achieve commercial success, platforms must perfect their subscription models for fitness content, scale B2B fitness app solutions for corporate wellness programs, and effectively measure the ROI of these initiatives.
  • This complex ecosystem, which also incorporates computer vision for real-time feedback and haptic feedback for motivation, requires a sophisticated approach to data privacy in health tracking apps and developing a hybrid fitness business model that caters to diverse user needs.

What are the key market drivers leading to the rise in the adoption of Fitness App Industry?

  • The institutionalization of AI and the integration of predictive health analytics are key drivers propelling market growth and innovation.

  • Growth is primarily fueled by the institutionalization of predictive health analytics and the seamless integration of hardware. The proliferation of wearable ecosystems, where real-time form correction and heart rate variability tracking are standard, anchors user retention.
  • This data-driven coaching approach allows platforms to offer tangible, medical-grade value, positioning them as essential preventative healthcare tools.
  • Corporate wellness platforms are a significant factor, with enterprise wellness contracts providing stable revenue streams and driving the adoption of B2B fitness solutions. These platforms improve employee productivity by an average of 15% for participating teams.
  • The strategic focus on software-only biometric analysis and direct-to-consumer health infrastructure is democratizing access to high-level personal training, making sophisticated health insights available without costly hardware.

What are the market trends shaping the Fitness App Industry?

  • The industrialization of generative AI for personalization is a defining market trend. This shift enables hyper-personalized training environments and dynamic user interactions at scale.

  • Market trends are coalescing around the industrialization of AI and deep data integration. The shift toward agentic AI coaches and high-fidelity virtual environments is redefining user interaction, with platforms leveraging exercise prescription adjustment for hyper-personalization. This is made possible by continuous glucose monitoring and sleep cycle analysis, enabling a more holistic approach.
  • A key development is the move toward decentralized fitness rewards within spatial computing fitness settings, which has been shown to improve engagement by over 25%. This evolution is supported by robust digital health ecosystems and creator economy fitness apps, which are pushing the boundaries of content delivery.
  • As a result, the market is transitioning from simple mobile health monitoring to sophisticated, proactive wellness management, where user attrition management becomes a central strategic focus.

What challenges does the Fitness App Industry face during its growth?

  • Ensuring compliance with data privacy regulations and protecting sensitive health information represents a key challenge for the industry's growth.

  • Key challenges revolve around data security, user retention, and technical fragmentation. Navigating data privacy compliance and protecting sensitive health information is a primary restraint, with non-compliance leading to significant financial penalties that can exceed 4% of global turnover.
  • The industry also grapples with persistent user attrition, as the novelty of a new digital interface often fails to translate into long-term habit formation without robust social accountability features. Furthermore, achieving seamless interoperability standards across a fragmented ecosystem of devices is a significant technical hurdle.
  • This requires a sophisticated back-end infrastructure, complicating development and increasing costs for platforms aiming to deliver a unified cross-device user experience and maintain a leading position in the digital fitness transformation.

Exclusive Technavio Analysis on Customer Landscape

The fitness app market forecasting report includes the adoption lifecycle of the market, covering from the innovator’s stage to the laggard’s stage. It focuses on adoption rates in different regions based on penetration. Furthermore, the fitness app market report also includes key purchase criteria and drivers of price sensitivity to help companies evaluate and develop their market growth analysis strategies.

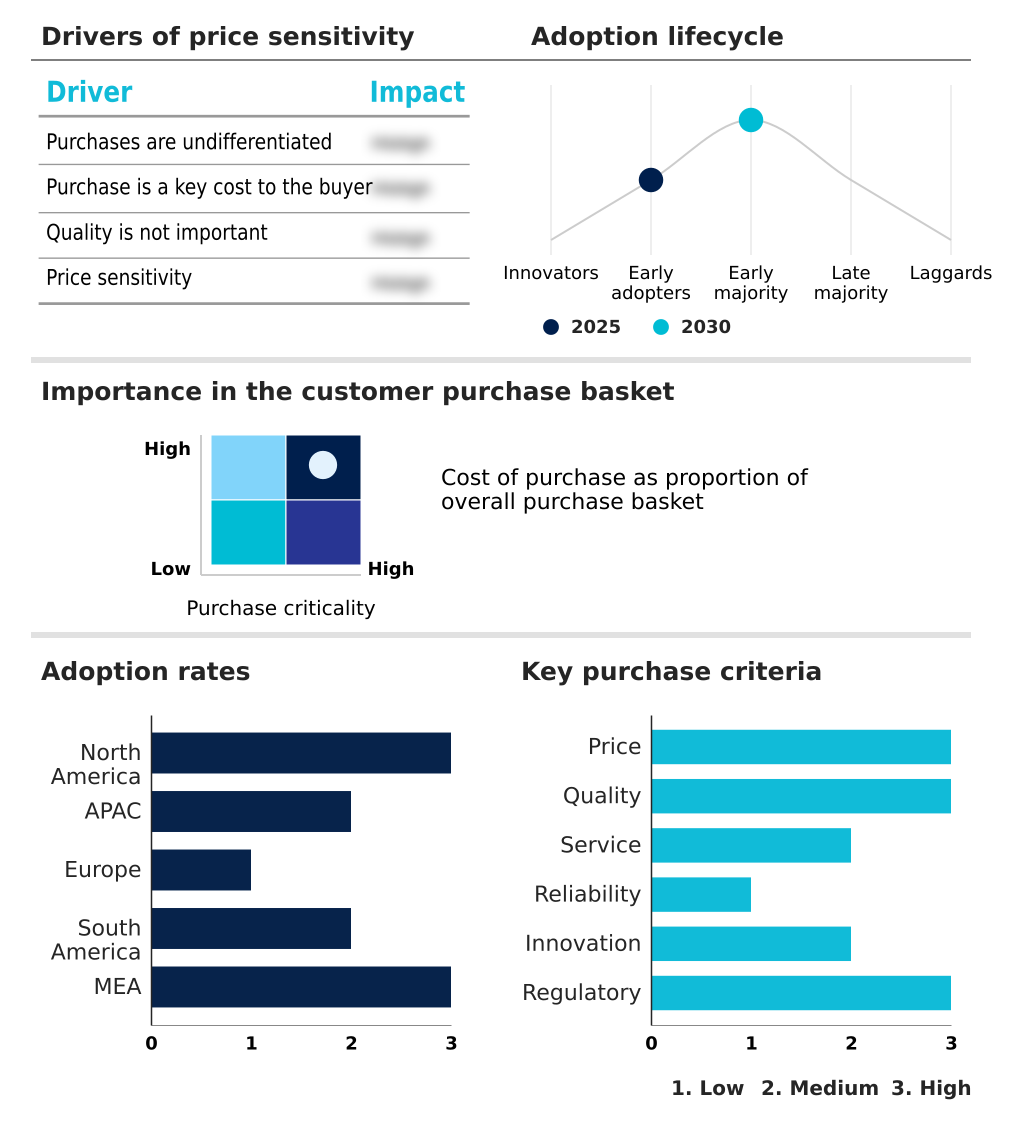
Customer Landscape of Fitness App Industry

Competitive Landscape

Companies are implementing various strategies, such as strategic alliances, fitness app market forecast, partnerships, mergers and acquisitions, geographical expansion, and product/service launches, to enhance their presence in the industry.

Apple Inc. - Delivering integrated digital platforms for personalized health tracking, guided workouts, and AI-driven wellness coaching to enhance user engagement and performance outcomes.

The industry research and growth report includes detailed analyses of the competitive landscape of the market and information about key companies, including:

  • Apple Inc.
  • BetterMe Ltd.
  • Boostcamp
  • Centr LLC
  • Fitbit LLC
  • FitOn Inc.
  • Freeletics GmbH
  • Future Research Inc.
  • Hevy Studios S.L.
  • Icon Health and Fitness Inc.
  • Jefit Inc.
  • Ladder Technologies Inc.
  • Myfitnesspal
  • Nike Inc.
  • Noom Inc.
  • Outside Interactive Inc
  • Peloton Interactive Inc.
  • Strava Inc.
  • WHOOP Inc.
  • Zwift Inc.

Qualitative and quantitative analysis of companies has been conducted to help clients understand the wider business environment as well as the strengths and weaknesses of key industry players. Data is qualitatively analyzed to categorize companies as pure play, category-focused, industry-focused, and diversified; it is quantitatively analyzed to categorize companies as dominant, leading, strong, tentative, and weak.

Recent Development and News in Fitness app market

  • In September 2024, Myfitnesspal announced the acquisition of a nutritional AI startup to enhance its platform's capabilities in providing hyper-personalized meal planning and real-time dietary feedback.
  • In November 2024, Mindbody Inc. formed a strategic partnership with a leading ad-tech firm to integrate AI-powered advertising solutions, aiming to deliver personalized promotions without compromising user privacy standards.
  • In January 2025, Future Research Inc. successfully closed a Series B funding round, securing significant capital to scale its remote personal training platform and expand its team of elite coaches.
  • In April 2025, WHOOP Inc. launched its next-generation proprietary biosensor, which includes advanced capabilities for non-invasive blood pressure monitoring, further strengthening its position in the predictive health analytics space.

Dive into Technavio’s robust research methodology, blending expert interviews, extensive data synthesis, and validated models for unparalleled Fitness App Market insights. See full methodology.

Market Scope
Page number 287
Base year 2025
Historic period 2020-2024
Forecast period 2026-2030
Growth momentum & CAGR Accelerate at a CAGR of 28.6%
Market growth 2026-2030 USD 155692.3 million
Market structure Fragmented
YoY growth 2025-2026(%) 21.4%
Key countries US, Canada, Mexico, China, India, Japan, South Korea, Indonesia, Australia, Germany, UK, France, Italy, Spain, The Netherlands, Brazil, Argentina, Chile, Saudi Arabia, UAE, South Africa, Israel and Turkey
Competitive landscape Leading Companies, Market Positioning of Companies, Competitive Strategies, and Industry Risks

Request Free Sample

Research Analyst Overview

  • The fitness app market is solidifying its role within the broader digital health infrastructure, driven by automated data synthesis and AI-driven coaching. A key strategic decision for companies is whether to focus on software-centric virtual coaching platforms or pursue deeper cross-platform hardware synchronization with wearable sensor integration.
  • The latter approach benefits from an ecosystem where motion model training and biometric data analysis from devices create a high-friction-to-exit environment for users. The use of computer vision for exercise and high-intensity interval training content is now standard. Platforms are differentiating through hyper-personalized training and predictive health insights derived from detailed metabolic tracking and muscular fatigue detection.
  • This is achieved via sophisticated personalized workout algorithms that facilitate progressive overload tracking. The successful implementation of gamified social metaverses has been shown to improve user retention by over 30%, proving that a focus on holistic wellness platforms and at-home exercise programming is critical for sustained market relevance.

What are the Key Data Covered in this Fitness App Market Research and Growth Report?

  • What is the expected growth of the Fitness App Market between 2026 and 2030?

    • USD 155.69 billion, at a CAGR of 28.6%

  • What segmentation does the market report cover?

    • The report is segmented by Gender (Female, and Male), Application (Lifestyle monitoring, Health monitoring, and Others), Platform (iOS, and Android) and Geography (North America, APAC, Europe, South America, Middle East and Africa)

  • Which regions are analyzed in the report?

    • North America, APAC, Europe, South America and Middle East and Africa

  • What are the key growth drivers and market challenges?

    • Institutionalization of AI and predictive health analytics, Data Privacy compliance and sensitive health information protection

  • Who are the major players in the Fitness App Market?

    • Apple Inc., BetterMe Ltd., Boostcamp, Centr LLC, Fitbit LLC, FitOn Inc., Freeletics GmbH, Future Research Inc., Hevy Studios S.L., Icon Health and Fitness Inc., Jefit Inc., Ladder Technologies Inc., Myfitnesspal, Nike Inc., Noom Inc., Outside Interactive Inc, Peloton Interactive Inc., Strava Inc., WHOOP Inc. and Zwift Inc.

Market Research Insights

  • Market dynamics are shaped by the dual challenges of user engagement and technological integration. While platforms leverage sophisticated gamification architecture to boost daily active users, with some reporting increases of nearly 30%, the industry still contends with a high rate of user attrition, where up to 80% of new users may disengage within three months.
  • This environment forces a focus on creating sticky digital health ecosystems and B2B fitness solutions. The success of direct-to-consumer health infrastructure and corporate wellness platforms demonstrates a shift toward more stable, subscription-based fitness revenue models.
  • As interoperability standards improve, the ability to deliver personalized health insights across a fragmented hardware landscape becomes a key competitive differentiator, driving the adoption of consumer-grade fitness apps within broader preventative healthcare tools.

We can help! Our analysts can customize this fitness app market research report to meet your requirements.

Get in touch

1. Executive Summary

1.1 Market overview

Executive Summary - Chart on Market Overview
Executive Summary - Data Table on Market Overview
Executive Summary - Chart on Global Market Characteristics
Executive Summary - Chart on Market by Geography
Executive Summary - Chart on Market Segmentation by Gender
Executive Summary - Chart on Market Segmentation by Application
Executive Summary - Chart on Market Segmentation by Platform
Executive Summary - Chart on Incremental Growth
Executive Summary - Data Table on Incremental Growth
Executive Summary - Chart on Company Market Positioning

2. Technavio Analysis

2.1 Analysis of price sensitivity, lifecycle, customer purchase basket, adoption rates, and purchase criteria

2.2 Criticality of inputs and Factors of differentiation

Chart on Overview on criticality of inputs and factors of differentiation

2.3 Factors of disruption

Chart on Overview on factors of disruption

2.4 Impact of drivers and challenges

Chart on Impact of drivers and challenges in 2025 and 2030

3. Market Landscape

3.1 Market ecosystem

Chart on Parent Market
Data Table on - Parent Market

3.2 Market characteristics

Chart on Market characteristics analysis

3.3 Value chain analysis

Chart on Value chain analysis

4. Market Sizing

4.1 Market definition

Data Table on Offerings of companies included in the market definition

4.2 Market segment analysis

Market segments

4.3 Market size 2025

4.4 Market outlook: Forecast for 2025-2030

Chart on Global - Market size and forecast 2025-2030 ($ million)
Data Table on Global - Market size and forecast 2025-2030 ($ million)
Chart on Global Market: Year-over-year growth 2025-2030 (%)
Data Table on Global Market: Year-over-year growth 2025-2030 (%)

5. Historic Market Size

5.1 Global Fitness App Market 2020 - 2024

Historic Market Size - Data Table on Global Fitness App Market 2020 - 2024 ($ million)

5.2 Gender segment analysis 2020 - 2024

Historic Market Size - Gender Segment 2020 - 2024 ($ million)

5.3 Application segment analysis 2020 - 2024

Historic Market Size - Application Segment 2020 - 2024 ($ million)

5.4 Platform segment analysis 2020 - 2024

Historic Market Size - Platform Segment 2020 - 2024 ($ million)

5.5 Geography segment analysis 2020 - 2024

Historic Market Size - Geography Segment 2020 - 2024 ($ million)

5.6 Country segment analysis 2020 - 2024

Historic Market Size - Country Segment 2020 - 2024 ($ million)

6. Qualitative Analysis

6.1 Impact of AI in global fitness app market

6.2 Impact of geopolitical conflict on global fitness app market

7. Five Forces Analysis

7.1 Five forces summary

Five forces analysis - Comparison between 2025 and 2030

7.2 Bargaining power of buyers

Bargaining power of buyers - Impact of key factors 2025 and 2030

7.3 Bargaining power of suppliers

Bargaining power of suppliers - Impact of key factors in 2025 and 2030

7.4 Threat of new entrants

Threat of new entrants - Impact of key factors in 2025 and 2030

7.5 Threat of substitutes

Threat of substitutes - Impact of key factors in 2025 and 2030

7.6 Threat of rivalry

Threat of rivalry - Impact of key factors in 2025 and 2030

7.7 Market condition

Chart on Market condition - Five forces 2025 and 2030

8. Market Segmentation by Gender

8.1 Market segments

Chart on Gender - Market share 2025-2030 (%)
Data Table on Gender - Market share 2025-2030 (%)

8.2 Comparison by Gender

Chart on Comparison by Gender
Data Table on Comparison by Gender

8.3 Female - Market size and forecast 2025-2030

Chart on Female - Market size and forecast 2025-2030 ($ million)
Data Table on Female - Market size and forecast 2025-2030 ($ million)
Chart on Female - Year-over-year growth 2025-2030 (%)
Data Table on Female - Year-over-year growth 2025-2030 (%)

8.4 Male - Market size and forecast 2025-2030

Chart on Male - Market size and forecast 2025-2030 ($ million)
Data Table on Male - Market size and forecast 2025-2030 ($ million)
Chart on Male - Year-over-year growth 2025-2030 (%)
Data Table on Male - Year-over-year growth 2025-2030 (%)

8.5 Market opportunity by Gender

Market opportunity by Gender ($ million)
Data Table on Market opportunity by Gender ($ million)

9. Market Segmentation by Application

9.1 Market segments

Chart on Application - Market share 2025-2030 (%)
Data Table on Application - Market share 2025-2030 (%)

9.2 Comparison by Application

Chart on Comparison by Application
Data Table on Comparison by Application

9.3 Lifestyle monitoring - Market size and forecast 2025-2030

Chart on Lifestyle monitoring - Market size and forecast 2025-2030 ($ million)
Data Table on Lifestyle monitoring - Market size and forecast 2025-2030 ($ million)
Chart on Lifestyle monitoring - Year-over-year growth 2025-2030 (%)
Data Table on Lifestyle monitoring - Year-over-year growth 2025-2030 (%)

9.4 Health monitoring - Market size and forecast 2025-2030

Chart on Health monitoring - Market size and forecast 2025-2030 ($ million)
Data Table on Health monitoring - Market size and forecast 2025-2030 ($ million)
Chart on Health monitoring - Year-over-year growth 2025-2030 (%)
Data Table on Health monitoring - Year-over-year growth 2025-2030 (%)

9.5 Others - Market size and forecast 2025-2030

Chart on Others - Market size and forecast 2025-2030 ($ million)
Data Table on Others - Market size and forecast 2025-2030 ($ million)
Chart on Others - Year-over-year growth 2025-2030 (%)
Data Table on Others - Year-over-year growth 2025-2030 (%)

9.6 Market opportunity by Application

Market opportunity by Application ($ million)
Data Table on Market opportunity by Application ($ million)

10. Market Segmentation by Platform

10.1 Market segments

Chart on Platform - Market share 2025-2030 (%)
Data Table on Platform - Market share 2025-2030 (%)

10.2 Comparison by Platform

Chart on Comparison by Platform
Data Table on Comparison by Platform

10.3 iOS - Market size and forecast 2025-2030

Chart on iOS - Market size and forecast 2025-2030 ($ million)
Data Table on iOS - Market size and forecast 2025-2030 ($ million)
Chart on iOS - Year-over-year growth 2025-2030 (%)
Data Table on iOS - Year-over-year growth 2025-2030 (%)

10.4 Android - Market size and forecast 2025-2030

Chart on Android - Market size and forecast 2025-2030 ($ million)
Data Table on Android - Market size and forecast 2025-2030 ($ million)
Chart on Android - Year-over-year growth 2025-2030 (%)
Data Table on Android - Year-over-year growth 2025-2030 (%)

10.5 Market opportunity by Platform

Market opportunity by Platform ($ million)
Data Table on Market opportunity by Platform ($ million)

11. Customer Landscape

11.1 Customer landscape overview

Analysis of price sensitivity, lifecycle, customer purchase basket, adoption rates, and purchase criteria

12. Geographic Landscape

12.1 Geographic segmentation

Chart on Market share by geography 2025-2030 (%)
Data Table on Market share by geography 2025-2030 (%)

12.2 Geographic comparison

Chart on Geographic comparison
Data Table on Geographic comparison

12.3 North America - Market size and forecast 2025-2030

Chart on North America - Market size and forecast 2025-2030 ($ million)
Data Table on North America - Market size and forecast 2025-2030 ($ million)
Chart on North America - Year-over-year growth 2025-2030 (%)
Data Table on North America - Year-over-year growth 2025-2030 (%)
Chart on Regional Comparison - North America
Data Table on Regional Comparison - North America

12.3.1 US - Market size and forecast 2025-2030

Chart on US - Market size and forecast 2025-2030 ($ million)
Data Table on US - Market size and forecast 2025-2030 ($ million)
Chart on US - Year-over-year growth 2025-2030 (%)
Data Table on US - Year-over-year growth 2025-2030 (%)

12.3.2 Canada - Market size and forecast 2025-2030

Chart on Canada - Market size and forecast 2025-2030 ($ million)
Data Table on Canada - Market size and forecast 2025-2030 ($ million)
Chart on Canada - Year-over-year growth 2025-2030 (%)
Data Table on Canada - Year-over-year growth 2025-2030 (%)

12.3.3 Mexico - Market size and forecast 2025-2030

Chart on Mexico - Market size and forecast 2025-2030 ($ million)
Data Table on Mexico - Market size and forecast 2025-2030 ($ million)
Chart on Mexico - Year-over-year growth 2025-2030 (%)
Data Table on Mexico - Year-over-year growth 2025-2030 (%)

12.4 APAC - Market size and forecast 2025-2030

Chart on APAC - Market size and forecast 2025-2030 ($ million)
Data Table on APAC - Market size and forecast 2025-2030 ($ million)
Chart on APAC - Year-over-year growth 2025-2030 (%)
Data Table on APAC - Year-over-year growth 2025-2030 (%)
Chart on Regional Comparison - APAC
Data Table on Regional Comparison - APAC

12.4.1 China - Market size and forecast 2025-2030

Chart on China - Market size and forecast 2025-2030 ($ million)
Data Table on China - Market size and forecast 2025-2030 ($ million)
Chart on China - Year-over-year growth 2025-2030 (%)
Data Table on China - Year-over-year growth 2025-2030 (%)

12.4.2 India - Market size and forecast 2025-2030

Chart on India - Market size and forecast 2025-2030 ($ million)
Data Table on India - Market size and forecast 2025-2030 ($ million)
Chart on India - Year-over-year growth 2025-2030 (%)
Data Table on India - Year-over-year growth 2025-2030 (%)

12.4.3 Japan - Market size and forecast 2025-2030

Chart on Japan - Market size and forecast 2025-2030 ($ million)
Data Table on Japan - Market size and forecast 2025-2030 ($ million)
Chart on Japan - Year-over-year growth 2025-2030 (%)
Data Table on Japan - Year-over-year growth 2025-2030 (%)

12.4.4 South Korea - Market size and forecast 2025-2030

Chart on South Korea - Market size and forecast 2025-2030 ($ million)
Data Table on South Korea - Market size and forecast 2025-2030 ($ million)
Chart on South Korea - Year-over-year growth 2025-2030 (%)
Data Table on South Korea - Year-over-year growth 2025-2030 (%)

12.4.5 Indonesia - Market size and forecast 2025-2030

Chart on Indonesia - Market size and forecast 2025-2030 ($ million)
Data Table on Indonesia - Market size and forecast 2025-2030 ($ million)
Chart on Indonesia - Year-over-year growth 2025-2030 (%)
Data Table on Indonesia - Year-over-year growth 2025-2030 (%)

12.4.6 Australia - Market size and forecast 2025-2030

Chart on Australia - Market size and forecast 2025-2030 ($ million)
Data Table on Australia - Market size and forecast 2025-2030 ($ million)
Chart on Australia - Year-over-year growth 2025-2030 (%)
Data Table on Australia - Year-over-year growth 2025-2030 (%)

12.5 Europe - Market size and forecast 2025-2030

Chart on Europe - Market size and forecast 2025-2030 ($ million)
Data Table on Europe - Market size and forecast 2025-2030 ($ million)
Chart on Europe - Year-over-year growth 2025-2030 (%)
Data Table on Europe - Year-over-year growth 2025-2030 (%)
Chart on Regional Comparison - Europe
Data Table on Regional Comparison - Europe

12.5.1 Germany - Market size and forecast 2025-2030

Chart on Germany - Market size and forecast 2025-2030 ($ million)
Data Table on Germany - Market size and forecast 2025-2030 ($ million)
Chart on Germany - Year-over-year growth 2025-2030 (%)
Data Table on Germany - Year-over-year growth 2025-2030 (%)

12.5.2 UK - Market size and forecast 2025-2030

Chart on UK - Market size and forecast 2025-2030 ($ million)
Data Table on UK - Market size and forecast 2025-2030 ($ million)
Chart on UK - Year-over-year growth 2025-2030 (%)
Data Table on UK - Year-over-year growth 2025-2030 (%)

12.5.3 France - Market size and forecast 2025-2030

Chart on France - Market size and forecast 2025-2030 ($ million)
Data Table on France - Market size and forecast 2025-2030 ($ million)
Chart on France - Year-over-year growth 2025-2030 (%)
Data Table on France - Year-over-year growth 2025-2030 (%)

12.5.4 Italy - Market size and forecast 2025-2030

Chart on Italy - Market size and forecast 2025-2030 ($ million)
Data Table on Italy - Market size and forecast 2025-2030 ($ million)
Chart on Italy - Year-over-year growth 2025-2030 (%)
Data Table on Italy - Year-over-year growth 2025-2030 (%)

12.5.5 Spain - Market size and forecast 2025-2030

Chart on Spain - Market size and forecast 2025-2030 ($ million)
Data Table on Spain - Market size and forecast 2025-2030 ($ million)
Chart on Spain - Year-over-year growth 2025-2030 (%)
Data Table on Spain - Year-over-year growth 2025-2030 (%)

12.5.6 The Netherlands - Market size and forecast 2025-2030

Chart on The Netherlands - Market size and forecast 2025-2030 ($ million)
Data Table on The Netherlands - Market size and forecast 2025-2030 ($ million)
Chart on The Netherlands - Year-over-year growth 2025-2030 (%)
Data Table on The Netherlands - Year-over-year growth 2025-2030 (%)

12.6 South America - Market size and forecast 2025-2030

Chart on South America - Market size and forecast 2025-2030 ($ million)
Data Table on South America - Market size and forecast 2025-2030 ($ million)
Chart on South America - Year-over-year growth 2025-2030 (%)
Data Table on South America - Year-over-year growth 2025-2030 (%)
Chart on Regional Comparison - South America
Data Table on Regional Comparison - South America

12.6.1 Brazil - Market size and forecast 2025-2030

Chart on Brazil - Market size and forecast 2025-2030 ($ million)
Data Table on Brazil - Market size and forecast 2025-2030 ($ million)
Chart on Brazil - Year-over-year growth 2025-2030 (%)
Data Table on Brazil - Year-over-year growth 2025-2030 (%)

12.6.2 Argentina - Market size and forecast 2025-2030

Chart on Argentina - Market size and forecast 2025-2030 ($ million)
Data Table on Argentina - Market size and forecast 2025-2030 ($ million)
Chart on Argentina - Year-over-year growth 2025-2030 (%)
Data Table on Argentina - Year-over-year growth 2025-2030 (%)

12.6.3 Chile - Market size and forecast 2025-2030

Chart on Chile - Market size and forecast 2025-2030 ($ million)
Data Table on Chile - Market size and forecast 2025-2030 ($ million)
Chart on Chile - Year-over-year growth 2025-2030 (%)
Data Table on Chile - Year-over-year growth 2025-2030 (%)

12.7 Middle East and Africa - Market size and forecast 2025-2030

Chart on Middle East and Africa - Market size and forecast 2025-2030 ($ million)
Data Table on Middle East and Africa - Market size and forecast 2025-2030 ($ million)
Chart on Middle East and Africa - Year-over-year growth 2025-2030 (%)
Data Table on Middle East and Africa - Year-over-year growth 2025-2030 (%)
Chart on Regional Comparison - Middle East and Africa
Data Table on Regional Comparison - Middle East and Africa

12.7.1 Saudi Arabia - Market size and forecast 2025-2030

Chart on Saudi Arabia - Market size and forecast 2025-2030 ($ million)
Data Table on Saudi Arabia - Market size and forecast 2025-2030 ($ million)
Chart on Saudi Arabia - Year-over-year growth 2025-2030 (%)
Data Table on Saudi Arabia - Year-over-year growth 2025-2030 (%)

12.7.2 UAE - Market size and forecast 2025-2030

Chart on UAE - Market size and forecast 2025-2030 ($ million)
Data Table on UAE - Market size and forecast 2025-2030 ($ million)
Chart on UAE - Year-over-year growth 2025-2030 (%)
Data Table on UAE - Year-over-year growth 2025-2030 (%)

12.7.3 South Africa - Market size and forecast 2025-2030

Chart on South Africa - Market size and forecast 2025-2030 ($ million)
Data Table on South Africa - Market size and forecast 2025-2030 ($ million)
Chart on South Africa - Year-over-year growth 2025-2030 (%)
Data Table on South Africa - Year-over-year growth 2025-2030 (%)

12.7.4 Israel - Market size and forecast 2025-2030

Chart on Israel - Market size and forecast 2025-2030 ($ million)
Data Table on Israel - Market size and forecast 2025-2030 ($ million)
Chart on Israel - Year-over-year growth 2025-2030 (%)
Data Table on Israel - Year-over-year growth 2025-2030 (%)

12.7.5 Turkey - Market size and forecast 2025-2030

Chart on Turkey - Market size and forecast 2025-2030 ($ million)
Data Table on Turkey - Market size and forecast 2025-2030 ($ million)
Chart on Turkey - Year-over-year growth 2025-2030 (%)
Data Table on Turkey - Year-over-year growth 2025-2030 (%)

12.8 Market opportunity by geography

Market opportunity by geography ($ million)
Data Tables on Market opportunity by geography ($ million)

13. Drivers, Challenges, and Opportunity

13.1 Market drivers

Institutionalization of AI and predictive health analytics
Strategic proliferation of wearable ecosystems and hardware integration
Escalation of corporate wellness programs and remote coaching models

13.2 Market challenges

Data Privacy compliance and sensitive health information protection
Persistent attrition and psychological barriers to long-term retention
Technological fragmentation and interoperability of wearable device ecosystems

13.3 Impact of drivers and challenges

Impact of drivers and challenges in 2025 and 2030

13.4 Market opportunities

Industrialization of generative AI personalization
Advancements in deep wearable ecosystem integration
Evolution of gamified social metaverses

14. Competitive Landscape

14.1 Overview

14.2

Overview on criticality of inputs and factors of differentiation

14.3 Landscape disruption

Overview on factors of disruption

14.4 Industry risks

Impact of key risks on business

15. Competitive Analysis

15.1 Companies profiled

Companies covered

15.2 Company ranking index

15.3 Market positioning of companies

Matrix on companies position and classification

15.4 Apple Inc.

Apple Inc. - Overview
Apple Inc. - Business segments
Apple Inc. - Key news
Apple Inc. - Key offerings
Apple Inc. - Segment focus
SWOT

15.5 Centr LLC

Centr LLC - Overview
Centr LLC - Product / Service
Centr LLC - Key offerings
SWOT

15.6 Fitbit LLC

Fitbit LLC - Overview
Fitbit LLC - Product / Service
Fitbit LLC - Key offerings
SWOT

15.7 FitOn Inc.

FitOn Inc. - Overview
FitOn Inc. - Product / Service
FitOn Inc. - Key offerings
SWOT

15.8 Freeletics GmbH

Freeletics GmbH - Overview
Freeletics GmbH - Product / Service
Freeletics GmbH - Key offerings
SWOT

15.9 Future Research Inc.

Future Research Inc. - Overview
Future Research Inc. - Product / Service
Future Research Inc. - Key offerings
SWOT

15.10 Icon Health and Fitness Inc.

Icon Health and Fitness Inc. - Overview
Icon Health and Fitness Inc. - Product / Service
Icon Health and Fitness Inc. - Key offerings
SWOT

15.11 Myfitnesspal

Myfitnesspal - Overview
Myfitnesspal - Product / Service
Myfitnesspal - Key offerings
SWOT

15.12 Nike Inc.

Nike Inc. - Overview
Nike Inc. - Business segments
Nike Inc. - Key offerings
Nike Inc. - Segment focus
SWOT

15.13 Noom Inc.

Noom Inc. - Overview
Noom Inc. - Product / Service
Noom Inc. - Key offerings
SWOT

15.14 Outside Interactive Inc

Outside Interactive Inc - Overview
Outside Interactive Inc - Product / Service
Outside Interactive Inc - Key offerings
SWOT

15.15 Peloton Interactive Inc.

Peloton Interactive Inc. - Overview
Peloton Interactive Inc. - Business segments
Peloton Interactive Inc. - Key offerings
Peloton Interactive Inc. - Segment focus
SWOT

15.16 Strava Inc.

Strava Inc. - Overview
Strava Inc. - Product / Service
Strava Inc. - Key offerings
SWOT

15.17 WHOOP Inc.

WHOOP Inc. - Overview
WHOOP Inc. - Product / Service
WHOOP Inc. - Key offerings
SWOT

15.18 Zwift Inc.

Zwift Inc. - Overview
Zwift Inc. - Product / Service
Zwift Inc. - Key offerings
SWOT

16. Appendix

16.1 Scope of the report

Market definition
Objectives
Notes and caveats

16.2 Inclusions and exclusions checklist

Inclusions checklist
Exclusions checklist

16.3 Currency conversion rates for US$

16.4 Research methodology

16.5 Data procurement

Information sources

16.6 Data validation

16.7 Validation techniques employed for market sizing

16.8 Data synthesis

16.9 360 degree market analysis

16.10 List of abbreviations

Research Methodology

Technavio presents a detailed picture of the market by way of study, synthesis, and summation of data from multiple sources. The analysts have presented the various facets of the market with a particular focus on identifying the key industry influencers. The data thus presented is comprehensive, reliable, and the result of extensive research, both primary and secondary.

INFORMATION SOURCES

Primary sources

  • Manufacturers and suppliers
  • Channel partners
  • Industry experts
  • Strategic decision makers

Secondary sources

  • Industry journals and periodicals
  • Government data
  • Financial reports of key industry players
  • Historical data
  • Press releases

DATA ANALYSIS

Data Synthesis

  • Collation of data
  • Estimation of key figures
  • Analysis of derived insights

Data Validation

  • Triangulation with data models
  • Reference against proprietary databases
  • Corroboration with industry experts

REPORT WRITING

Qualitative

  • Market drivers
  • Market challenges
  • Market trends
  • Five forces analysis

Quantitative

  • Market size and forecast
  • Market segmentation
  • Geographical insights
  • Competitive landscape

Interested in this report?

Get your sample now to see our research methodology and insights!

Download Now

Frequently Asked Questions

Fitness App market growth will increase by USD 155692.3 million during 2026-2030.

The Fitness App market is expected to grow at a CAGR of 28.6% during 2026-2030.

Fitness App market is segmented by Gender (Female, Male) Application (Lifestyle monitoring, Health monitoring, Others) Platform (iOS, Android)

Apple Inc., BetterMe Ltd., Boostcamp, Centr LLC, Fitbit LLC, FitOn Inc., Freeletics GmbH, Future Research Inc., Hevy Studios S.L., Icon Health and Fitness Inc., Jefit Inc., Ladder Technologies Inc., Myfitnesspal, Nike Inc., Noom Inc., Outside Interactive Inc, Peloton Interactive Inc., Strava Inc., WHOOP Inc., Zwift Inc. are a few of the key vendors in the Fitness App market.

APAC will register the highest growth rate of 30.5% among the other regions. Therefore, the Fitness App market in APAC is expected to garner significant business opportunities for the vendors during the forecast period.

US, Canada, Mexico, China, India, Japan, South Korea, Indonesia, Australia, Germany, UK, France, Italy, Spain, The Netherlands, Brazil, Argentina, Chile, Saudi Arabia, UAE, South Africa, Israel, Turkey

  • Institutionalization of AI and predictive health analytics is the driving factor this market.

The Fitness App market vendors should focus on grabbing business opportunities from the Gender segment as it accounted for the largest market share in the base year.
RIA - Research AI Assistant
Ask RIA