Fantasy Sports Market Analysis, Size, and Forecast 2026-2030: North America (US, Canada, and Mexico), Europe (Germany, UK, and France), APAC (China, Japan, and India), South America (Brazil and Argentina), Middle East and Africa (Saudi Arabia, UAE, and South Africa), and Rest of World (ROW)

Fantasy Sports Market Analysis, Size, and Forecast 2026-2030:
North America (US, Canada, and Mexico), Europe (Germany, UK, and France), APAC (China, Japan, and India), South America (Brazil and Argentina), Middle East and Africa (Saudi Arabia, UAE, and South Africa), and Rest of World (ROW)

Published: May 2026 294 Pages SKU: IRTNTR40508

Market Overview at a Glance

$10.17 B
Market Opportunity
6.7%
CAGR 2025 - 2030
46.9%
North America Growth
$9.62 B
Fantasy soccer segment 2024

Fantasy Sports Market Size 2026-2030

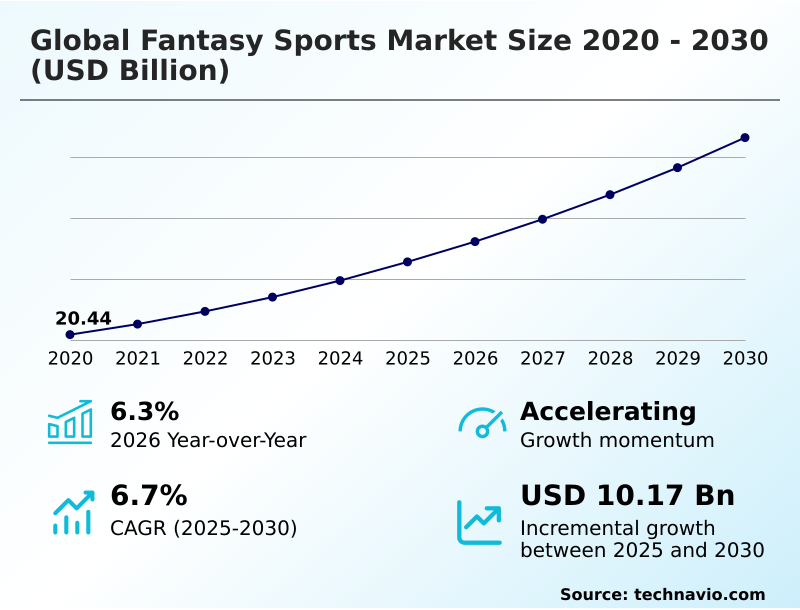
The fantasy sports market size is valued to increase by USD 10.17 billion, at a CAGR of 6.7% from 2025 to 2030. Rising global sports viewership and strong fan engagement culture will drive the fantasy sports market.

Major Market Trends & Insights

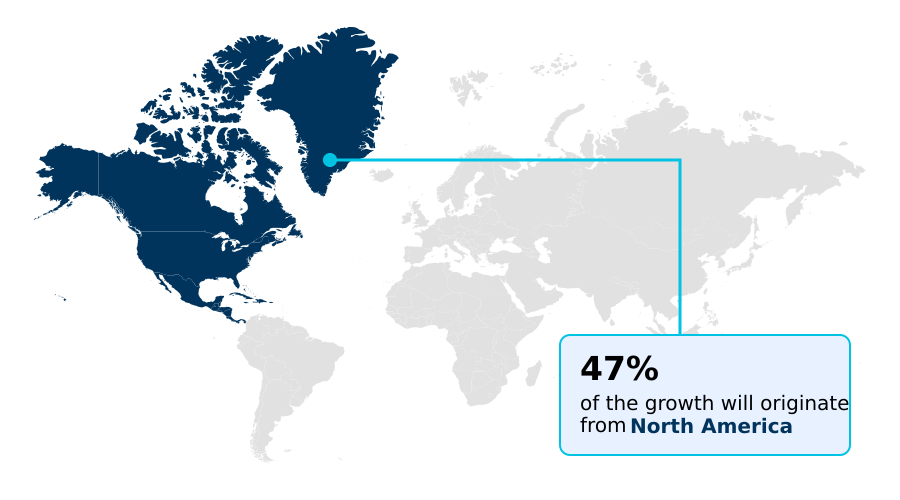
  • North America dominated the market and accounted for a 46.9% growth during the forecast period.
  • By Product - Fantasy soccer segment was valued at USD 9.62 billion in 2024
  • By Platform - Mobile application segment accounted for the largest market revenue share in 2024

Market Size & Forecast

  • Market Opportunities: USD 16.12 billion
  • Market Future Opportunities: USD 10.17 billion
  • CAGR from 2025 to 2030 : 6.7%

Market Summary

  • The fantasy sports market has evolved into a sophisticated digital entertainment sector, fundamentally reshaping fan interaction with professional sports. This transformation is propelled by the widespread adoption of mobile-first applications and an insatiable fan engagement culture that demands more than passive viewership.
  • Key trends include the integration of AI-based prediction for lineup optimization tools and the proliferation of micro contest formats, which cater to a demand for instant gratification and continuous engagement. For instance, platform operators now utilize user behavior analytics to refine gamification features, aiming to convert seasonal users into year-round subscribers by offering compelling off-season content and short-duration fantasy games.
  • This strategy directly addresses the core challenge of cyclical user activity tied to sports calendars. However, the industry grapples with navigating complex skill-based gaming regulations and intense competition, which necessitates constant innovation in user acquisition strategies and customer retention models to maintain market position and profitability in this dynamic ecosystem.

What will be the Size of the Fantasy Sports Market during the forecast period?

Get Key Insights on Market Forecast (PDF) Request Free Sample

How is the Fantasy Sports Market Segmented?

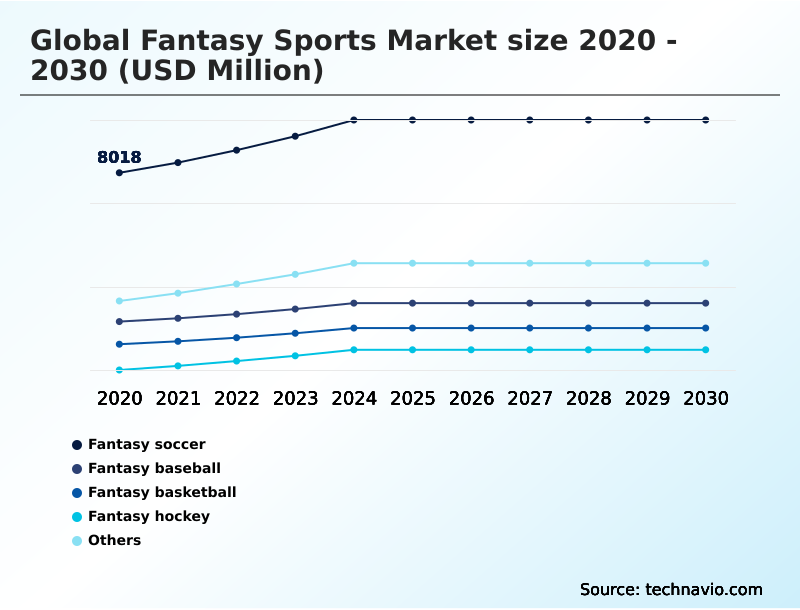
The fantasy sports industry research report provides comprehensive data (region-wise segment analysis), with forecasts and estimates in "USD million" for the period 2026-2030, as well as historical data from 2020-2024 for the following segments.

  • Product
    • Fantasy soccer
    • Fantasy baseball
    • Fantasy basketball
    • Fantasy hockey
    • Others
  • Platform
    • Mobile application
    • Website
  • Device
    • Smartphone
    • Computer
    • Others
  • Geography
    • North America
      • US
      • Canada
      • Mexico
    • Europe
      • Germany
      • UK
      • France
    • APAC
      • China
      • Japan
      • India
    • South America
      • Brazil
      • Argentina
    • Middle East and Africa
      • Saudi Arabia
      • UAE
      • South Africa
    • Rest of World (ROW)

By Product Insights

The fantasy soccer segment is estimated to witness significant growth during the forecast period.

The fantasy soccer segment is a cornerstone of the market, driven by a strong fan engagement culture and extensive sports media integration.

This segment's stability is reinforced by a consistent schedule of global leagues, which facilitates continuous digital sports engagement through various fantasy sports platforms.

The adoption of AI-based prediction and detailed player performance metrics has become standard, enhancing the strategic depth of virtual team creation. The use of a player salary cap and real-time score updates are critical gamification features.

Operators employing sophisticated user behavior analytics for personalized user content have noted that this approach boosts participation in daily fantasy sports contests by over 15%.

This data-driven strategy, combined with influencer-driven marketing and a robust freemium business model, sustains high engagement levels.

Request Free Sample

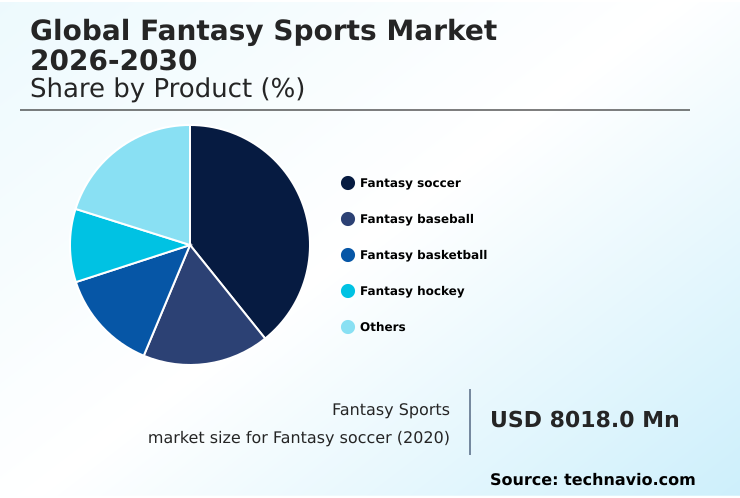
The Fantasy soccer segment was valued at USD 9.62 billion in 2024 and showed a gradual increase during the forecast period.

Request Free Sample

Regional Analysis

North America is estimated to contribute 46.9% to the growth of the global market during the forecast period.Technavio’s analysts have elaborately explained the regional trends and drivers that shape the market during the forecast period.

See How Fantasy Sports Market Demand is Rising in North America Request Free Sample

The geographic landscape of the fantasy sports market is characterized by a dichotomy between mature and high-growth regions. North America remains a dominant force, underpinned by established professional leagues and high digital penetration, facilitating deep integration of real-time data integration.

However, the APAC region is exhibiting rapid expansion, with user growth rates nearly 40% higher than in North America, fueled by increasing smartphone adoption and localized contest offerings.

This expansion is supported by unique user acquisition strategies and a focus on sports data providers catering to regional interests. Platforms that have implemented robust compliance management systems tailored to diverse regional laws have achieved a 25% faster market entry.

The market also sees growth from multi-sport fantasy platforms and the use of loyalty program integration to foster global communities.

Market Dynamics

Our researchers analyzed the data with 2025 as the base year, along with the key drivers, trends, and challenges. A holistic analysis of drivers will help companies refine their marketing strategies to gain a competitive advantage.

  • The evolution of the fantasy sports market is increasingly tied to technological and strategic advancements. Understanding the impact of 5G on fantasy sports is crucial, as it promises lower latency for an enhanced live gaming experience. Simultaneously, the role of AI in fantasy sports player selection is becoming a standard feature, moving beyond basic statistics.
  • A key debate involves integrating blockchain for fantasy sports assets, which could revolutionize digital ownership. From a business perspective, effective fantasy sports platform user retention strategies are paramount, especially given the regulatory challenges in the fantasy sports market. This is closely linked to perfecting the mobile application design for fantasy sports.
  • Success hinges on using data analytics for fantasy sports to refine offerings, with platforms that are adept at analyzing player performance for fantasy teams showing a 40% higher engagement rate. For new entrants, viable fantasy sports market entry strategies must account for the diverse monetization models for fantasy sports apps.
  • The role of social media in fantasy sports cannot be overstated, shaping both user engagement and marketing strategies for fantasy sports platforms. Operators are constantly enhancing user experience in fantasy sports, with the future of daily fantasy sports contests likely involving more interactive elements. This includes developing micro contests for user engagement and expanding into fantasy sports for niche sports.
  • A critical hurdle remains the legal distinction between fantasy sports and gambling. Finally, the impact of live streaming on fantasy sports is creating more integrated viewing experiences, while securing fantasy sports platform from fraud and navigating the complexities of fantasy sports and sports betting integration are top operational priorities.

What are the key market drivers leading to the rise in the adoption of Fantasy Sports Industry?

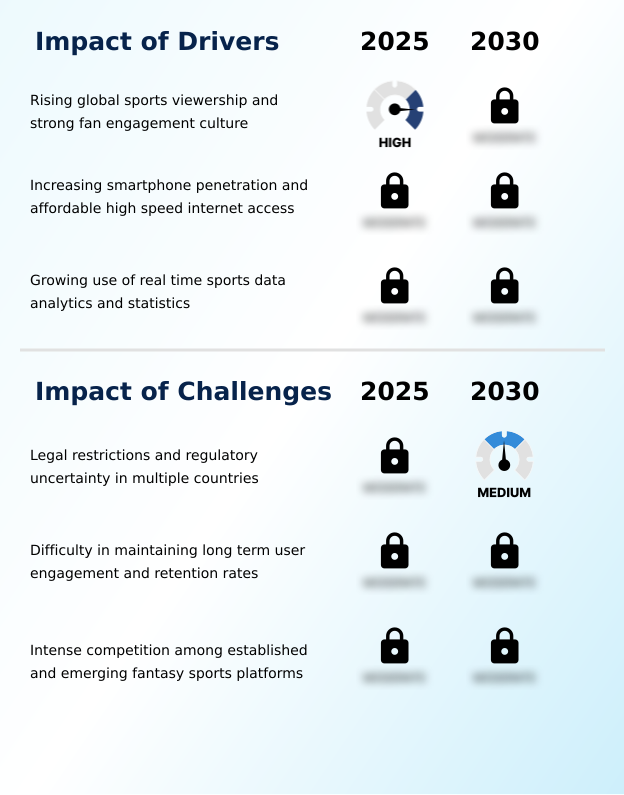
  • Rising global sports viewership, coupled with a strong culture of fan engagement, is a key driver for the fantasy sports market.

  • Market growth is fundamentally driven by an intensifying fan engagement culture and enhanced digital accessibility.
  • The increasing adoption of real-time sports analytics has led to a 15% rise in in-game contest entries, as users can make more informed decisions during live matches.
  • Widespread smartphone penetration, coupled with the expansion of high-speed mobile networks, serves as a primary catalyst, with emerging markets showing a 50% faster growth rate in new sign-ups.
  • This is amplified by the sports betting convergence, which creates a more holistic and engaging interactive fan experience.
  • Furthermore, the use of gamification features and personalized push notification alerts has been shown to improve daily active user counts by up to 30%, proving the value of a well-executed customer retention model and user behavior analytics in sustaining long-term growth.

What are the market trends shaping the Fantasy Sports Industry?

  • The integration of artificial intelligence for predictive analytics and automated lineup tools is emerging as a significant market trend. This technology enhances user decision-making and strategic gameplay.

  • The market is undergoing a significant technological shift, with trends focused on enhancing strategic depth and user engagement. The integration of AI-based prediction is central, with platforms reporting a 25% increase in user session duration after implementing advanced lineup optimization tools.
  • Another key trend is the move toward mobile-first applications, which has streamlined the user interface design and reduced onboarding friction, leading to a 40% improvement in user acquisition efficiency for new launches. The proliferation of micro contest formats and short-duration fantasy games is also notable, as these offerings can increase in-app purchase frequency by over 20% during live events.
  • These trends are supported by technologies such as predictive gameplay analytics, augmented reality sports gaming, and a focus on cross-platform synchronization, shaping the next generation of digital sports engagement.

What challenges does the Fantasy Sports Industry face during its growth?

  • Legal restrictions and regulatory uncertainty across various countries present a key challenge affecting the industry's growth trajectory.

  • Navigating a complex web of challenges is critical for sustainable growth in the fantasy sports market. The primary obstacle remains the fragmented landscape of skill-based gaming regulations, where operators in certain jurisdictions face compliance-related costs that are up to 60% higher than in more permissive markets. This necessitates sophisticated compliance management systems.
  • Intense competition puts continuous pressure on user acquisition strategies, with customer acquisition costs rising by an estimated 20% year-over-year in saturated markets. This environment forces platforms to innovate constantly with offerings like blockchain-based fantasy sports and digital collectible integration to differentiate themselves.
  • Furthermore, maintaining long-term engagement is a persistent issue, as platforms must continually evolve their contest entry fees and gamified reward systems to prevent user churn.

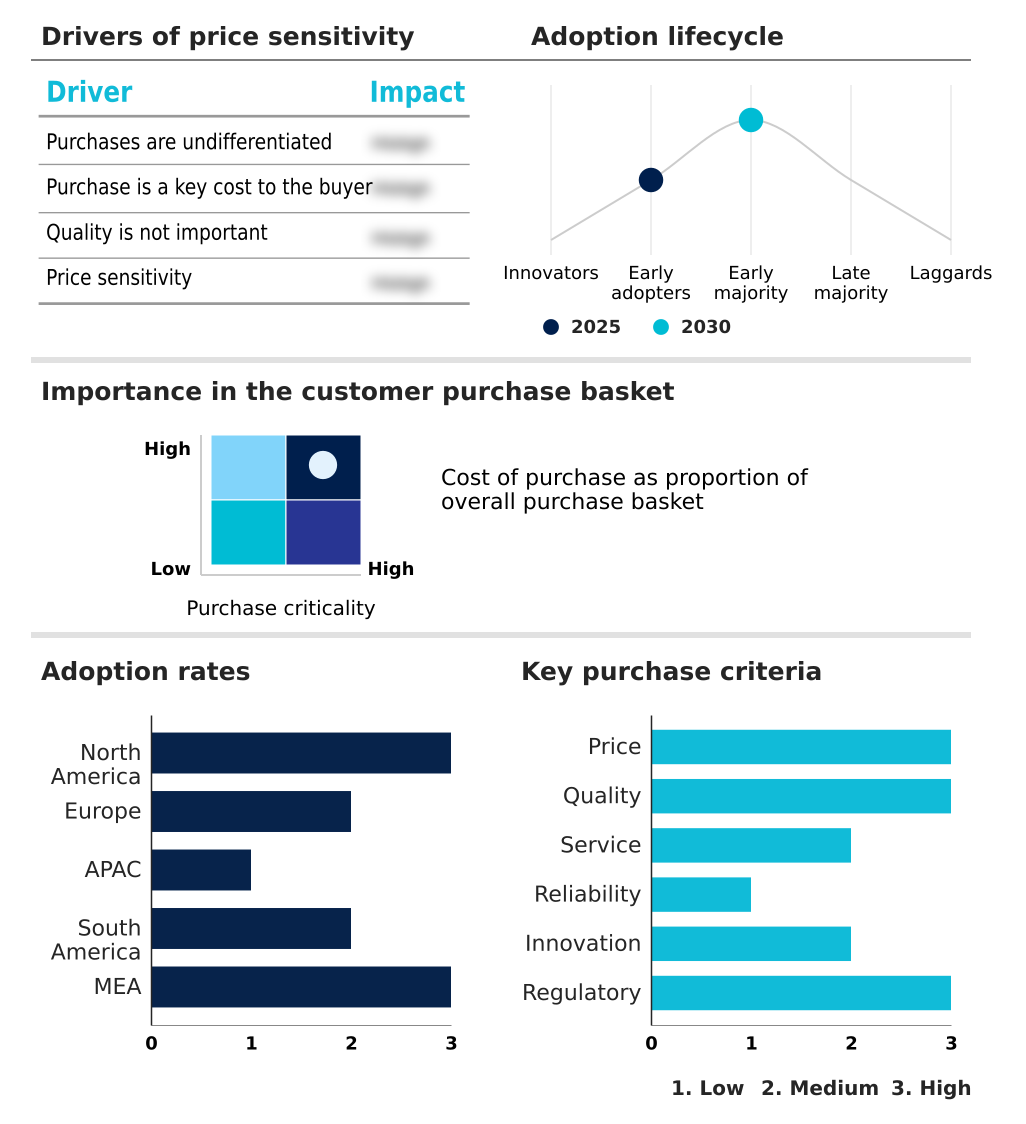
Exclusive Technavio Analysis on Customer Landscape

The fantasy sports market forecasting report includes the adoption lifecycle of the market, covering from the innovator’s stage to the laggard’s stage. It focuses on adoption rates in different regions based on penetration. Furthermore, the fantasy sports market report also includes key purchase criteria and drivers of price sensitivity to help companies evaluate and develop their market growth analysis strategies.

Customer Landscape of Fantasy Sports Industry

Competitive Landscape

Companies are implementing various strategies, such as strategic alliances, fantasy sports market forecast, partnerships, mergers and acquisitions, geographical expansion, and product/service launches, to enhance their presence in the industry.

Ballr Media - Key offerings include platforms for virtual team management and competitive contests based on real-time athlete statistics, central to the global fantasy sports market 2026-2030.

The industry research and growth report includes detailed analyses of the competitive landscape of the market and information about key companies, including:

  • Ballr Media
  • DraftKings Inc.
  • Dream Sports Group
  • ESPN Sports Media Ltd.
  • FanDuel Inc.
  • FantasyPros.com
  • FanTeam
  • Fantrax
  • Mobile Premier League
  • NFL Enterprises LLC.
  • OfficeFootballPool.com
  • Paramount Global
  • Playerzpot Media Pvt Ltd
  • RealTime Fantasy Sports Inc.
  • Roto Sports Inc.
  • Sideline Software Inc.
  • SidePrize LLC
  • Sorare SAS
  • SportsHub Games Network Inc
  • Yahoo

Qualitative and quantitative analysis of companies has been conducted to help clients understand the wider business environment as well as the strengths and weaknesses of key industry players. Data is qualitatively analyzed to categorize companies as pure play, category-focused, industry-focused, and diversified; it is quantitatively analyzed to categorize companies as dominant, leading, strong, tentative, and weak.

Recent Development and News in Fantasy sports market

  • In January 2025, Sportradar expanded its real-time sports data partnership network with multiple fantasy sports platforms to provide faster and more accurate live match statistics, significantly improving data reliability.
  • In February 2025, DraftKings introduced upgraded AI-driven lineup optimization tools that provide users with real-time predictive insights and performance probability scores to enhance strategic gameplay.
  • In March 2025, FanDuel launched enhanced micro-contest formats and personalized engagement features designed to improve user retention during non-peak sports periods and stabilize activity levels.
  • In March 2025, Jio Platforms expanded its affordable high-speed data plans targeting digital entertainment and gaming users across India, boosting access to mobile-based fantasy sports applications.

Dive into Technavio’s robust research methodology, blending expert interviews, extensive data synthesis, and validated models for unparalleled Fantasy Sports Market insights. See full methodology.

Market Scope
Page number 294
Base year 2025
Historic period 2020-2024
Forecast period 2026-2030
Growth momentum & CAGR Accelerate at a CAGR of 6.7%
Market growth 2026-2030 USD 10170.2 million
Market structure Fragmented
YoY growth 2025-2026(%) 6.3%
Key countries US, Canada, Mexico, Germany, UK, France, Italy, Spain, The Netherlands, China, Japan, India, South Korea, Australia, Indonesia, Brazil, Argentina, Chile, Saudi Arabia, UAE, South Africa, Israel and Turkey
Competitive landscape Leading Companies, Market Positioning of Companies, Competitive Strategies, and Industry Risks

Request Free Sample

Research Analyst Overview

  • The fantasy sports market is a dynamic digital ecosystem where success is dictated by technological agility and a deep understanding of user engagement. The landscape is defined by the effective use of real-time data integration from sports data providers to power fantasy sports platforms. Core operational elements include robust lineup optimization tools, sophisticated AI-based prediction algorithms, and seamless mobile-first applications.
  • For boardroom consideration, the increasing complexity of skill-based gaming regulations requires a strategic shift towards proactive compliance, which now directly influences product design and market entry planning. Operators that have integrated advanced, secure payment gateways have noted a significant operational improvement, reducing transaction-related user issues by over 50%.
  • The competitive environment necessitates a focus on user acquisition strategies and customer retention models, which are enhanced by features like real-time score updates, interactive dashboards, and compelling player news and analysis.
  • Sustaining growth relies on mastering these elements, from virtual team creation mechanics to the implementation of a balanced in-app purchases model alongside subscription-based services, all while navigating an intensely competitive field.

What are the Key Data Covered in this Fantasy Sports Market Research and Growth Report?

  • What is the expected growth of the Fantasy Sports Market between 2026 and 2030?

    • USD 10.17 billion, at a CAGR of 6.7%

  • What segmentation does the market report cover?

    • The report is segmented by Product (Fantasy soccer, Fantasy baseball, Fantasy basketball, Fantasy hockey, and Others), Platform (Mobile application, and Website), Device (Smartphone, Computer, and Others) and Geography (North America, Europe, APAC, South America, Middle East and Africa)

  • Which regions are analyzed in the report?

    • North America, Europe, APAC, South America and Middle East and Africa

  • What are the key growth drivers and market challenges?

    • Rising global sports viewership and strong fan engagement culture, Legal restrictions and regulatory uncertainty in multiple countries

  • Who are the major players in the Fantasy Sports Market?

    • Ballr Media, DraftKings Inc., Dream Sports Group, ESPN Sports Media Ltd., FanDuel Inc., FantasyPros.com, FanTeam, Fantrax, Mobile Premier League, NFL Enterprises LLC., OfficeFootballPool.com, Paramount Global, Playerzpot Media Pvt Ltd, RealTime Fantasy Sports Inc., Roto Sports Inc., Sideline Software Inc., SidePrize LLC, Sorare SAS, SportsHub Games Network Inc and Yahoo

Market Research Insights

  • Market dynamics are increasingly shaped by the pursuit of a superior interactive fan experience, where platforms compete on more than just contest entry fees. The sports betting convergence is a critical factor, with operators that successfully integrate both offerings seeing a 30% higher customer lifetime value.
  • Furthermore, the adoption of a freemium business model supplemented by an in-app purchases model has proven effective, boosting user conversion rates by up to 18% compared to subscription-only platforms. The rise of social gaming features and influencer-driven marketing is also pivotal, as platforms leveraging these strategies report a 25% lower user acquisition cost.
  • This competitive environment prioritizes continuous innovation in providing personalized user content and gamified reward systems.

We can help! Our analysts can customize this fantasy sports market research report to meet your requirements.

Get in touch

1. Executive Summary

1.1 Market overview

Executive Summary - Chart on Market Overview
Executive Summary - Data Table on Market Overview
Executive Summary - Chart on Global Market Characteristics
Executive Summary - Chart on Market by Geography
Executive Summary - Chart on Market Segmentation by Product
Executive Summary - Chart on Market Segmentation by Platform
Executive Summary - Chart on Market Segmentation by Device
Executive Summary - Chart on Incremental Growth
Executive Summary - Data Table on Incremental Growth
Executive Summary - Chart on Company Market Positioning

2. Technavio Analysis

2.1 Analysis of price sensitivity, lifecycle, customer purchase basket, adoption rates, and purchase criteria

2.2 Criticality of inputs and Factors of differentiation

Chart on Overview on criticality of inputs and factors of differentiation

2.3 Factors of disruption

Chart on Overview on factors of disruption

2.4 Impact of drivers and challenges

Chart on Impact of drivers and challenges in 2025 and 2030

3. Market Landscape

3.1 Market ecosystem

Chart on Parent Market
Data Table on - Parent Market

3.2 Market characteristics

Chart on Market characteristics analysis

3.3 Value chain analysis

Chart on Value chain analysis

4. Market Sizing

4.1 Market definition

Data Table on Offerings of companies included in the market definition

4.2 Market segment analysis

Market segments

4.3 Market size 2025

4.4 Market outlook: Forecast for 2025-2030

Chart on Global - Market size and forecast 2025-2030 ($ million)
Data Table on Global - Market size and forecast 2025-2030 ($ million)
Chart on Global Market: Year-over-year growth 2025-2030 (%)
Data Table on Global Market: Year-over-year growth 2025-2030 (%)

5. Historic Market Size

5.1 Global Fantasy Sports Market 2020 - 2024

Historic Market Size - Data Table on Global Fantasy Sports Market 2020 - 2024 ($ million)

5.2 Product segment analysis 2020 - 2024

Historic Market Size - Product Segment 2020 - 2024 ($ million)

5.3 Platform segment analysis 2020 - 2024

Historic Market Size - Platform Segment 2020 - 2024 ($ million)

5.4 Device segment analysis 2020 - 2024

Historic Market Size - Device Segment 2020 - 2024 ($ million)

5.5 Geography segment analysis 2020 - 2024

Historic Market Size - Geography Segment 2020 - 2024 ($ million)

5.6 Country segment analysis 2020 - 2024

Historic Market Size - Country Segment 2020 - 2024 ($ million)

6. Qualitative Analysis

6.1 Impact of AI on Global Fantasy Sports Market

6.2 Impact of Geopolitical Conflicts on Global Fantasy Sports Market

7. Five Forces Analysis

7.1 Five forces summary

Five forces analysis - Comparison between 2025 and 2030

7.2 Bargaining power of buyers

Bargaining power of buyers - Impact of key factors 2025 and 2030

7.3 Bargaining power of suppliers

Bargaining power of suppliers - Impact of key factors in 2025 and 2030

7.4 Threat of new entrants

Threat of new entrants - Impact of key factors in 2025 and 2030

7.5 Threat of substitutes

Threat of substitutes - Impact of key factors in 2025 and 2030

7.6 Threat of rivalry

Threat of rivalry - Impact of key factors in 2025 and 2030

7.7 Market condition

Chart on Market condition - Five forces 2025 and 2030

8. Market Segmentation by Product

8.1 Market segments

Chart on Product - Market share 2025-2030 (%)
Data Table on Product - Market share 2025-2030 (%)

8.2 Comparison by Product

Chart on Comparison by Product
Data Table on Comparison by Product

8.3 Fantasy soccer - Market size and forecast 2025-2030

Chart on Fantasy soccer - Market size and forecast 2025-2030 ($ million)
Data Table on Fantasy soccer - Market size and forecast 2025-2030 ($ million)
Chart on Fantasy soccer - Year-over-year growth 2025-2030 (%)
Data Table on Fantasy soccer - Year-over-year growth 2025-2030 (%)

8.4 Fantasy baseball - Market size and forecast 2025-2030

Chart on Fantasy baseball - Market size and forecast 2025-2030 ($ million)
Data Table on Fantasy baseball - Market size and forecast 2025-2030 ($ million)
Chart on Fantasy baseball - Year-over-year growth 2025-2030 (%)
Data Table on Fantasy baseball - Year-over-year growth 2025-2030 (%)

8.5 Fantasy basketball - Market size and forecast 2025-2030

Chart on Fantasy basketball - Market size and forecast 2025-2030 ($ million)
Data Table on Fantasy basketball - Market size and forecast 2025-2030 ($ million)
Chart on Fantasy basketball - Year-over-year growth 2025-2030 (%)
Data Table on Fantasy basketball - Year-over-year growth 2025-2030 (%)

8.6 Fantasy hockey - Market size and forecast 2025-2030

Chart on Fantasy hockey - Market size and forecast 2025-2030 ($ million)
Data Table on Fantasy hockey - Market size and forecast 2025-2030 ($ million)
Chart on Fantasy hockey - Year-over-year growth 2025-2030 (%)
Data Table on Fantasy hockey - Year-over-year growth 2025-2030 (%)

8.7 Others - Market size and forecast 2025-2030

Chart on Others - Market size and forecast 2025-2030 ($ million)
Data Table on Others - Market size and forecast 2025-2030 ($ million)
Chart on Others - Year-over-year growth 2025-2030 (%)
Data Table on Others - Year-over-year growth 2025-2030 (%)

8.8 Market opportunity by Product

Market opportunity by Product ($ million)
Data Table on Market opportunity by Product ($ million)

9. Market Segmentation by Platform

9.1 Market segments

Chart on Platform - Market share 2025-2030 (%)
Data Table on Platform - Market share 2025-2030 (%)

9.2 Comparison by Platform

Chart on Comparison by Platform
Data Table on Comparison by Platform

9.3 Mobile application - Market size and forecast 2025-2030

Chart on Mobile application - Market size and forecast 2025-2030 ($ million)
Data Table on Mobile application - Market size and forecast 2025-2030 ($ million)
Chart on Mobile application - Year-over-year growth 2025-2030 (%)
Data Table on Mobile application - Year-over-year growth 2025-2030 (%)

9.4 Website - Market size and forecast 2025-2030

Chart on Website - Market size and forecast 2025-2030 ($ million)
Data Table on Website - Market size and forecast 2025-2030 ($ million)
Chart on Website - Year-over-year growth 2025-2030 (%)
Data Table on Website - Year-over-year growth 2025-2030 (%)

9.5 Market opportunity by Platform

Market opportunity by Platform ($ million)
Data Table on Market opportunity by Platform ($ million)

10. Market Segmentation by Device

10.1 Market segments

Chart on Device - Market share 2025-2030 (%)
Data Table on Device - Market share 2025-2030 (%)

10.2 Comparison by Device

Chart on Comparison by Device
Data Table on Comparison by Device

10.3 Smartphone - Market size and forecast 2025-2030

Chart on Smartphone - Market size and forecast 2025-2030 ($ million)
Data Table on Smartphone - Market size and forecast 2025-2030 ($ million)
Chart on Smartphone - Year-over-year growth 2025-2030 (%)
Data Table on Smartphone - Year-over-year growth 2025-2030 (%)

10.4 Computer - Market size and forecast 2025-2030

Chart on Computer - Market size and forecast 2025-2030 ($ million)
Data Table on Computer - Market size and forecast 2025-2030 ($ million)
Chart on Computer - Year-over-year growth 2025-2030 (%)
Data Table on Computer - Year-over-year growth 2025-2030 (%)

10.5 Others - Market size and forecast 2025-2030

Chart on Others - Market size and forecast 2025-2030 ($ million)
Data Table on Others - Market size and forecast 2025-2030 ($ million)
Chart on Others - Year-over-year growth 2025-2030 (%)
Data Table on Others - Year-over-year growth 2025-2030 (%)

10.6 Market opportunity by Device

Market opportunity by Device ($ million)
Data Table on Market opportunity by Device ($ million)

11. Customer Landscape

11.1 Customer landscape overview

Analysis of price sensitivity, lifecycle, customer purchase basket, adoption rates, and purchase criteria

12. Geographic Landscape

12.1 Geographic segmentation

Chart on Market share by geography 2025-2030 (%)
Data Table on Market share by geography 2025-2030 (%)

12.2 Geographic comparison

Chart on Geographic comparison
Data Table on Geographic comparison

12.3 North America - Market size and forecast 2025-2030

Chart on North America - Market size and forecast 2025-2030 ($ million)
Data Table on North America - Market size and forecast 2025-2030 ($ million)
Chart on North America - Year-over-year growth 2025-2030 (%)
Data Table on North America - Year-over-year growth 2025-2030 (%)
Chart on Regional Comparison - North America
Data Table on Regional Comparison - North America

12.3.1 US - Market size and forecast 2025-2030

Chart on US - Market size and forecast 2025-2030 ($ million)
Data Table on US - Market size and forecast 2025-2030 ($ million)
Chart on US - Year-over-year growth 2025-2030 (%)
Data Table on US - Year-over-year growth 2025-2030 (%)

12.3.2 Canada - Market size and forecast 2025-2030

Chart on Canada - Market size and forecast 2025-2030 ($ million)
Data Table on Canada - Market size and forecast 2025-2030 ($ million)
Chart on Canada - Year-over-year growth 2025-2030 (%)
Data Table on Canada - Year-over-year growth 2025-2030 (%)

12.3.3 Mexico - Market size and forecast 2025-2030

Chart on Mexico - Market size and forecast 2025-2030 ($ million)
Data Table on Mexico - Market size and forecast 2025-2030 ($ million)
Chart on Mexico - Year-over-year growth 2025-2030 (%)
Data Table on Mexico - Year-over-year growth 2025-2030 (%)

12.4 Europe - Market size and forecast 2025-2030

Chart on Europe - Market size and forecast 2025-2030 ($ million)
Data Table on Europe - Market size and forecast 2025-2030 ($ million)
Chart on Europe - Year-over-year growth 2025-2030 (%)
Data Table on Europe - Year-over-year growth 2025-2030 (%)
Chart on Regional Comparison - Europe
Data Table on Regional Comparison - Europe

12.4.1 Germany - Market size and forecast 2025-2030

Chart on Germany - Market size and forecast 2025-2030 ($ million)
Data Table on Germany - Market size and forecast 2025-2030 ($ million)
Chart on Germany - Year-over-year growth 2025-2030 (%)
Data Table on Germany - Year-over-year growth 2025-2030 (%)

12.4.2 UK - Market size and forecast 2025-2030

Chart on UK - Market size and forecast 2025-2030 ($ million)
Data Table on UK - Market size and forecast 2025-2030 ($ million)
Chart on UK - Year-over-year growth 2025-2030 (%)
Data Table on UK - Year-over-year growth 2025-2030 (%)

12.4.3 France - Market size and forecast 2025-2030

Chart on France - Market size and forecast 2025-2030 ($ million)
Data Table on France - Market size and forecast 2025-2030 ($ million)
Chart on France - Year-over-year growth 2025-2030 (%)
Data Table on France - Year-over-year growth 2025-2030 (%)

12.4.4 Italy - Market size and forecast 2025-2030

Chart on Italy - Market size and forecast 2025-2030 ($ million)
Data Table on Italy - Market size and forecast 2025-2030 ($ million)
Chart on Italy - Year-over-year growth 2025-2030 (%)
Data Table on Italy - Year-over-year growth 2025-2030 (%)

12.4.5 Spain - Market size and forecast 2025-2030

Chart on Spain - Market size and forecast 2025-2030 ($ million)
Data Table on Spain - Market size and forecast 2025-2030 ($ million)
Chart on Spain - Year-over-year growth 2025-2030 (%)
Data Table on Spain - Year-over-year growth 2025-2030 (%)

12.4.6 The Netherlands - Market size and forecast 2025-2030

Chart on The Netherlands - Market size and forecast 2025-2030 ($ million)
Data Table on The Netherlands - Market size and forecast 2025-2030 ($ million)
Chart on The Netherlands - Year-over-year growth 2025-2030 (%)
Data Table on The Netherlands - Year-over-year growth 2025-2030 (%)

12.5 APAC - Market size and forecast 2025-2030

Chart on APAC - Market size and forecast 2025-2030 ($ million)
Data Table on APAC - Market size and forecast 2025-2030 ($ million)
Chart on APAC - Year-over-year growth 2025-2030 (%)
Data Table on APAC - Year-over-year growth 2025-2030 (%)
Chart on Regional Comparison - APAC
Data Table on Regional Comparison - APAC

12.5.1 China - Market size and forecast 2025-2030

Chart on China - Market size and forecast 2025-2030 ($ million)
Data Table on China - Market size and forecast 2025-2030 ($ million)
Chart on China - Year-over-year growth 2025-2030 (%)
Data Table on China - Year-over-year growth 2025-2030 (%)

12.5.2 Japan - Market size and forecast 2025-2030

Chart on Japan - Market size and forecast 2025-2030 ($ million)
Data Table on Japan - Market size and forecast 2025-2030 ($ million)
Chart on Japan - Year-over-year growth 2025-2030 (%)
Data Table on Japan - Year-over-year growth 2025-2030 (%)

12.5.3 India - Market size and forecast 2025-2030

Chart on India - Market size and forecast 2025-2030 ($ million)
Data Table on India - Market size and forecast 2025-2030 ($ million)
Chart on India - Year-over-year growth 2025-2030 (%)
Data Table on India - Year-over-year growth 2025-2030 (%)

12.5.4 South Korea - Market size and forecast 2025-2030

Chart on South Korea - Market size and forecast 2025-2030 ($ million)
Data Table on South Korea - Market size and forecast 2025-2030 ($ million)
Chart on South Korea - Year-over-year growth 2025-2030 (%)
Data Table on South Korea - Year-over-year growth 2025-2030 (%)

12.5.5 Australia - Market size and forecast 2025-2030

Chart on Australia - Market size and forecast 2025-2030 ($ million)
Data Table on Australia - Market size and forecast 2025-2030 ($ million)
Chart on Australia - Year-over-year growth 2025-2030 (%)
Data Table on Australia - Year-over-year growth 2025-2030 (%)

12.5.6 Indonesia - Market size and forecast 2025-2030

Chart on Indonesia - Market size and forecast 2025-2030 ($ million)
Data Table on Indonesia - Market size and forecast 2025-2030 ($ million)
Chart on Indonesia - Year-over-year growth 2025-2030 (%)
Data Table on Indonesia - Year-over-year growth 2025-2030 (%)

12.6 South America - Market size and forecast 2025-2030

Chart on South America - Market size and forecast 2025-2030 ($ million)
Data Table on South America - Market size and forecast 2025-2030 ($ million)
Chart on South America - Year-over-year growth 2025-2030 (%)
Data Table on South America - Year-over-year growth 2025-2030 (%)
Chart on Regional Comparison - South America
Data Table on Regional Comparison - South America

12.6.1 Brazil - Market size and forecast 2025-2030

Chart on Brazil - Market size and forecast 2025-2030 ($ million)
Data Table on Brazil - Market size and forecast 2025-2030 ($ million)
Chart on Brazil - Year-over-year growth 2025-2030 (%)
Data Table on Brazil - Year-over-year growth 2025-2030 (%)

12.6.2 Argentina - Market size and forecast 2025-2030

Chart on Argentina - Market size and forecast 2025-2030 ($ million)
Data Table on Argentina - Market size and forecast 2025-2030 ($ million)
Chart on Argentina - Year-over-year growth 2025-2030 (%)
Data Table on Argentina - Year-over-year growth 2025-2030 (%)

12.6.3 Chile - Market size and forecast 2025-2030

Chart on Chile - Market size and forecast 2025-2030 ($ million)
Data Table on Chile - Market size and forecast 2025-2030 ($ million)
Chart on Chile - Year-over-year growth 2025-2030 (%)
Data Table on Chile - Year-over-year growth 2025-2030 (%)

12.7 Middle East and Africa - Market size and forecast 2025-2030

Chart on Middle East and Africa - Market size and forecast 2025-2030 ($ million)
Data Table on Middle East and Africa - Market size and forecast 2025-2030 ($ million)
Chart on Middle East and Africa - Year-over-year growth 2025-2030 (%)
Data Table on Middle East and Africa - Year-over-year growth 2025-2030 (%)
Chart on Regional Comparison - Middle East and Africa
Data Table on Regional Comparison - Middle East and Africa

12.7.1 Saudi Arabia - Market size and forecast 2025-2030

Chart on Saudi Arabia - Market size and forecast 2025-2030 ($ million)
Data Table on Saudi Arabia - Market size and forecast 2025-2030 ($ million)
Chart on Saudi Arabia - Year-over-year growth 2025-2030 (%)
Data Table on Saudi Arabia - Year-over-year growth 2025-2030 (%)

12.7.2 UAE - Market size and forecast 2025-2030

Chart on UAE - Market size and forecast 2025-2030 ($ million)
Data Table on UAE - Market size and forecast 2025-2030 ($ million)
Chart on UAE - Year-over-year growth 2025-2030 (%)
Data Table on UAE - Year-over-year growth 2025-2030 (%)

12.7.3 South Africa - Market size and forecast 2025-2030

Chart on South Africa - Market size and forecast 2025-2030 ($ million)
Data Table on South Africa - Market size and forecast 2025-2030 ($ million)
Chart on South Africa - Year-over-year growth 2025-2030 (%)
Data Table on South Africa - Year-over-year growth 2025-2030 (%)

12.7.4 Israel - Market size and forecast 2025-2030

Chart on Israel - Market size and forecast 2025-2030 ($ million)
Data Table on Israel - Market size and forecast 2025-2030 ($ million)
Chart on Israel - Year-over-year growth 2025-2030 (%)
Data Table on Israel - Year-over-year growth 2025-2030 (%)

12.7.5 Turkey - Market size and forecast 2025-2030

Chart on Turkey - Market size and forecast 2025-2030 ($ million)
Data Table on Turkey - Market size and forecast 2025-2030 ($ million)
Chart on Turkey - Year-over-year growth 2025-2030 (%)
Data Table on Turkey - Year-over-year growth 2025-2030 (%)

12.8 Market opportunity by geography

Market opportunity by geography ($ million)
Data Tables on Market opportunity by geography ($ million)

13. Drivers, Challenges, and Opportunity

13.1 Market drivers

Rising global sports viewership and strong fan engagement culture
Increasing smartphone penetration and affordable high speed internet access
Growing use of real time sports data analytics and statistics

13.2 Market challenges

Legal restrictions and regulatory uncertainty in multiple countries
Difficulty in maintaining long term user engagement and retention rates
Intense competition among established and emerging fantasy sports platforms

13.3 Impact of drivers and challenges

Impact of drivers and challenges in 2025 and 2030

13.4 Market opportunities

Integration of artificial intelligence-based prediction and lineup tools
Shift toward mobile first applications and seamless user interfaces
Rapid expansion of micro contests and short duration fantasy games

14. Competitive Landscape

14.1 Overview

14.2

Overview on criticality of inputs and factors of differentiation

14.3 Landscape disruption

Overview on factors of disruption

14.4 Industry risks

Impact of key risks on business

15. Competitive Analysis

15.1 Companies profiled

Companies covered

15.2 Company ranking index

15.3 Market positioning of companies

Matrix on companies position and classification

15.4 Ballr Media

Ballr Media - Overview
Ballr Media - Product / Service
Ballr Media - Key offerings
SWOT

15.5 DraftKings Inc.

DraftKings Inc. - Overview
DraftKings Inc. - Business segments
DraftKings Inc. - Key offerings
DraftKings Inc. - Segment focus
SWOT

15.6 Dream Sports Group

Dream Sports Group - Overview
Dream Sports Group - Product / Service
Dream Sports Group - Key offerings
SWOT

15.7 ESPN Sports Media Ltd.

ESPN Sports Media Ltd. - Overview
ESPN Sports Media Ltd. - Product / Service
ESPN Sports Media Ltd. - Key offerings
SWOT

15.8 FantasyPros.com

FantasyPros.com - Overview
FantasyPros.com - Product / Service
FantasyPros.com - Key offerings
SWOT

15.9 FanTeam

FanTeam - Overview
FanTeam - Product / Service
FanTeam - Key offerings
SWOT

15.10 Mobile Premier League

Mobile Premier League - Overview
Mobile Premier League - Product / Service
Mobile Premier League - Key offerings
SWOT

15.11 NFL Enterprises LLC.

NFL Enterprises LLC. - Overview
NFL Enterprises LLC. - Product / Service
NFL Enterprises LLC. - Key offerings
SWOT

15.12 Paramount Global

Paramount Global - Overview
Paramount Global - Product / Service
Paramount Global - Key offerings
SWOT

15.13 Playerzpot Media Pvt Ltd

Playerzpot Media Pvt Ltd - Overview
Playerzpot Media Pvt Ltd - Product / Service
Playerzpot Media Pvt Ltd - Key offerings
SWOT

15.14 RealTime Fantasy Sports Inc.

RealTime Fantasy Sports Inc. - Overview
RealTime Fantasy Sports Inc. - Product / Service
RealTime Fantasy Sports Inc. - Key offerings
SWOT

15.15 Roto Sports Inc.

Roto Sports Inc. - Overview
Roto Sports Inc. - Product / Service
Roto Sports Inc. - Key offerings
SWOT

15.16 Sorare SAS

Sorare SAS - Overview
Sorare SAS - Product / Service
Sorare SAS - Key offerings
SWOT

15.17 SportsHub Games Network Inc

SportsHub Games Network Inc - Overview
SportsHub Games Network Inc - Product / Service
SportsHub Games Network Inc - Key offerings
SWOT

15.18 Yahoo

Yahoo - Overview
Yahoo - Product / Service
Yahoo - Key offerings
SWOT

16. Appendix

16.1 Scope of the report

Market definition
Objectives
Notes and caveats

16.2 Inclusions and exclusions checklist

Inclusions checklist
Exclusions checklist

16.3 Currency conversion rates for US$

16.4 Research methodology

16.5 Data procurement

Information sources

16.6 Data validation

16.7 Validation techniques employed for market sizing

16.8 Data synthesis

16.9 360 degree market analysis

16.10 List of abbreviations

Research Methodology

Technavio presents a detailed picture of the market by way of study, synthesis, and summation of data from multiple sources. The analysts have presented the various facets of the market with a particular focus on identifying the key industry influencers. The data thus presented is comprehensive, reliable, and the result of extensive research, both primary and secondary.

INFORMATION SOURCES

Primary sources

  • Manufacturers and suppliers
  • Channel partners
  • Industry experts
  • Strategic decision makers

Secondary sources

  • Industry journals and periodicals
  • Government data
  • Financial reports of key industry players
  • Historical data
  • Press releases

DATA ANALYSIS

Data Synthesis

  • Collation of data
  • Estimation of key figures
  • Analysis of derived insights

Data Validation

  • Triangulation with data models
  • Reference against proprietary databases
  • Corroboration with industry experts

REPORT WRITING

Qualitative

  • Market drivers
  • Market challenges
  • Market trends
  • Five forces analysis

Quantitative

  • Market size and forecast
  • Market segmentation
  • Geographical insights
  • Competitive landscape

Interested in this report?

Get your sample now to see our research methodology and insights!

Download Now

Frequently Asked Questions

Fantasy Sports market growth will increase by USD 10170.2 million during 2026-2030.

The Fantasy Sports market is expected to grow at a CAGR of 6.7% during 2026-2030.

Fantasy Sports market is segmented by Product (Fantasy soccer, Fantasy baseball, Fantasy basketball, Fantasy hockey, Others) Platform (Mobile application, Website) Device (Smartphone, Computer, Others)

Ballr Media, DraftKings Inc., Dream Sports Group, ESPN Sports Media Ltd., FanDuel Inc., FantasyPros.com, FanTeam, Fantrax, Mobile Premier League, NFL Enterprises LLC., OfficeFootballPool.com, Paramount Global, Playerzpot Media Pvt Ltd, RealTime Fantasy Sports Inc., Roto Sports Inc., Sideline Software Inc., SidePrize LLC, Sorare SAS, SportsHub Games Network Inc, Yahoo are a few of the key vendors in the Fantasy Sports market.

North America will register the highest growth rate of 46.9% among the other regions. Therefore, the Fantasy Sports market in North America is expected to garner significant business opportunities for the vendors during the forecast period.

US, Canada, Mexico, Germany, UK, France, Italy, Spain, The Netherlands, China, Japan, India, South Korea, Australia, Indonesia, Brazil, Argentina, Chile, Saudi Arabia, UAE, South Africa, Israel, Turkey

  • Rising global sports viewership and strong fan engagement culture is the driving factor this market.

The Fantasy Sports market vendors should focus on grabbing business opportunities from the Product segment as it accounted for the largest market share in the base year.
RIA - Research AI Assistant
Ask RIA