Face Mask Market Analysis, Size, and Forecast 2026-2030: APAC (China, Japan, and India), North America (US, Canada, and Mexico), Europe (Germany, UK, and France), Middle East and Africa (Saudi Arabia, UAE, and Turkey), South America (Brazil and Argentina), and Rest of World (ROW)

Face Mask Market Analysis, Size, and Forecast 2026-2030:
APAC (China, Japan, and India), North America (US, Canada, and Mexico), Europe (Germany, UK, and France), Middle East and Africa (Saudi Arabia, UAE, and Turkey), South America (Brazil and Argentina), and Rest of World (ROW)

Published: Apr 2026 281 Pages SKU: IRTNTR76070

Market Overview at a Glance

$4.56 B
Market Opportunity
6%
CAGR 2025 - 2030
49.8%
APAC Growth
$5.70 B
Surgical mask segment 2024

Face Mask Market Size 2026-2030

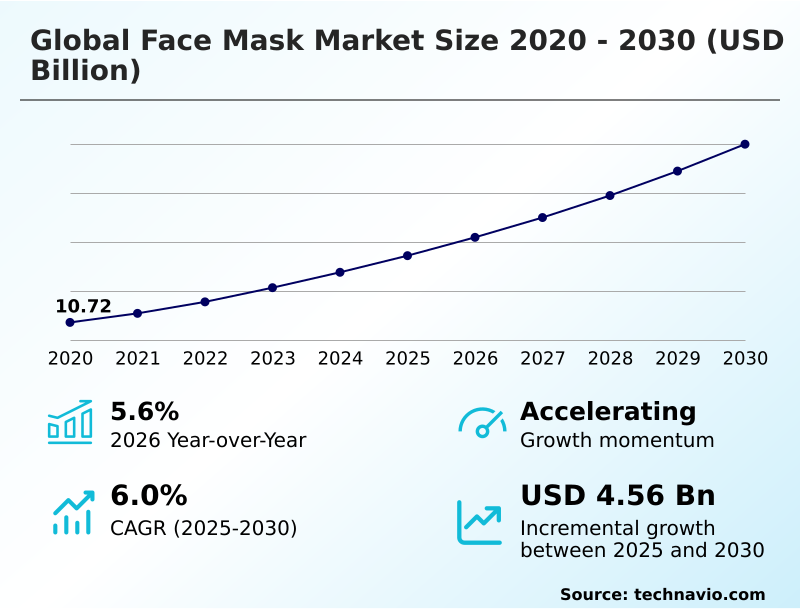
The face mask market size is valued to increase by USD 4.56 billion, at a CAGR of 6% from 2025 to 2030. Escalating occupational safety mandates across industrial and construction will drive the face mask market.

Major Market Trends & Insights

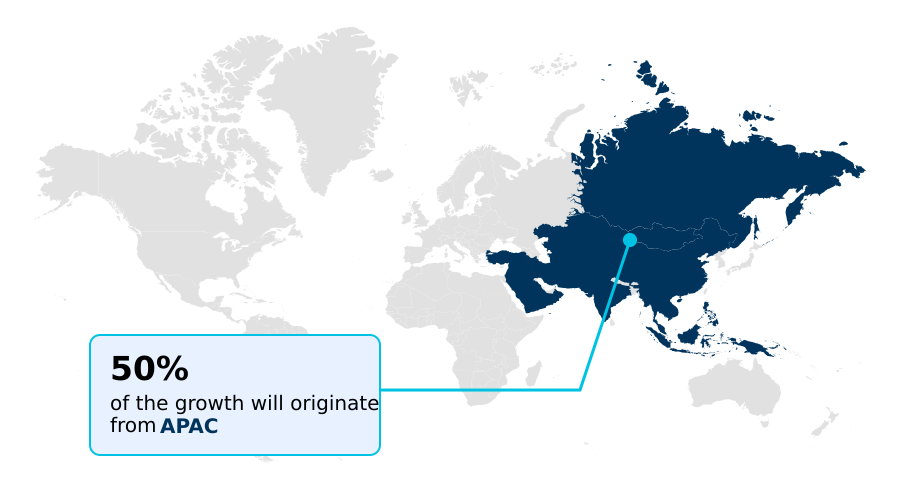
  • APAC dominated the market and accounted for a 49.8% growth during the forecast period.
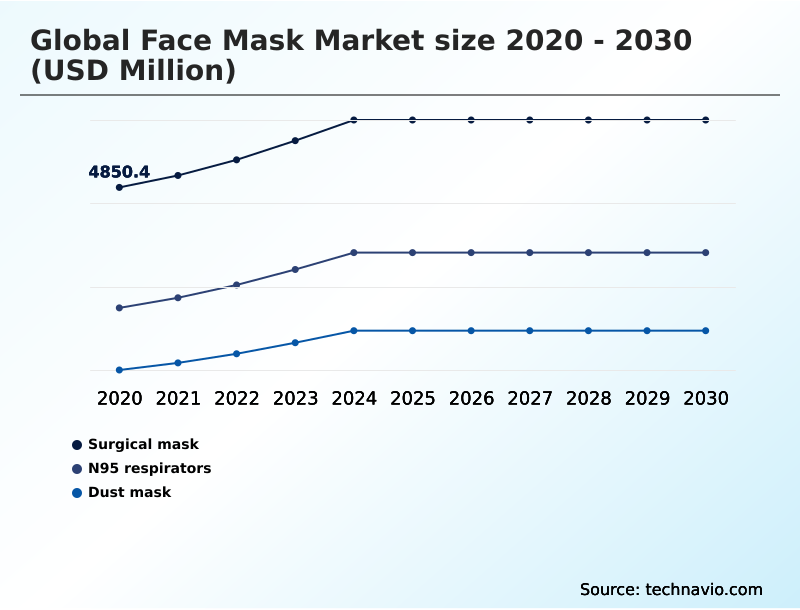
  • By Type - Surgical mask segment was valued at USD 5.70 billion in 2024
  • By Channel - Offline segment accounted for the largest market revenue share in 2024

Market Size & Forecast

  • Market Opportunities: USD 7.30 billion
  • Market Future Opportunities: USD 4.56 billion
  • CAGR from 2025 to 2030 : 6%

Market Summary

  • The face mask market is evolving from a crisis-response footing to one defined by sustainable innovation and specialized applications. Growth is underpinned by stringent occupational safety regulations and enduring public health awareness, which mandate the use of products meeting high respiratory protection standards for airborne pathogen defense.
  • Core to the industry is the production of devices like N95 respirators and FFP2 respirators, which rely on materials such as melt-blown non-woven polypropylene for effective particulate matter filtration. A key business scenario involves manufacturers balancing the cost of incorporating advanced features like antimicrobial coatings or activated carbon filters against the need to maintain supply chain resilience.
  • This dynamic pushes the industry beyond basic surgical masks toward high-value solutions for industrial dust protection and daily wellness, compelling firms to innovate on material science and functionality to maintain a competitive edge in a crowded field. The normalization of mask usage for infection control protocols continues to provide a stable demand floor.

What will be the Size of the Face Mask Market during the forecast period?

Get Key Insights on Market Forecast (PDF) Request Free Sample

How is the Face Mask Market Segmented?

The face mask industry research report provides comprehensive data (region-wise segment analysis), with forecasts and estimates in "USD million" for the period 2026-2030, as well as historical data from 2020-2024 for the following segments.

  • Type
    • Surgical mask
    • N95 respirators
    • Dust mask
  • Channel
    • Offline
    • Online
  • Usage
    • Disposable
    • Reusable
  • Geography
    • APAC
      • China
      • Japan
      • India
    • North America
      • US
      • Canada
      • Mexico
    • Europe
      • Germany
      • UK
      • France
    • Middle East and Africa
      • Saudi Arabia
      • UAE
      • Turkey
    • South America
      • Brazil
      • Argentina
    • Rest of World (ROW)

By Type Insights

The surgical mask segment is estimated to witness significant growth during the forecast period.

The surgical mask segment is foundational to the market, driven by strict infection control protocols and a culture of public health hygiene.

These single-use medical devices, essential for healthcare worker safety, are manufactured in a sterile manufacturing environment, often using ultrasonic welding construction. Composed of multiple spunbond layers, their design focuses on meeting a high bacterial filtration efficiency (BFE) and fluid resistance benchmark.

Recent innovations prioritize ergonomic fit design and the use of hypoallergenic materials to improve comfort during extended wear.

Adherence to ethical manufacturing practices has become a key differentiator, with manufacturers achieving a 15% reduction in skin irritation complaints through improved material selection, reinforcing their commitment to user well-being.

Request Free Sample

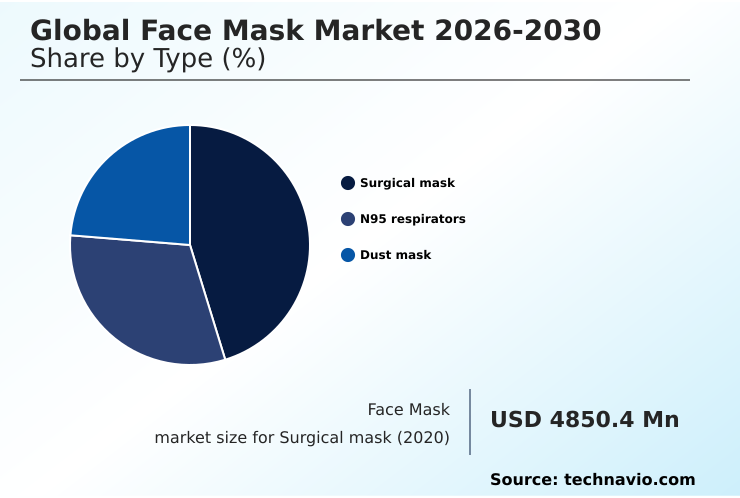
The Surgical mask segment was valued at USD 5.70 billion in 2024 and showed a gradual increase during the forecast period.

Request Free Sample

Regional Analysis

APAC is estimated to contribute 49.8% to the growth of the global market during the forecast period.Technavio’s analysts have elaborately explained the regional trends and drivers that shape the market during the forecast period.

See How Face Mask Market Demand is Rising in APAC Request Free Sample

The geographic landscape is led by the APAC region, where persistent air quality monitoring data drives consistent demand for personal protective equipment (PPE).

This region's market is growing approximately 18% faster than Europe's, fueled by strong manufacturing capabilities and established infection control protocols. While demand for airborne pathogen defense is universal, regional preferences vary.

In APAC, there is also a significant market for cosmetic skincare application and dermatological enhancement. In contrast, North America and Europe see stronger demand for industrial-grade elastomeric half-mask respirator and full facepiece respirator models.

Features like an adjustable nose clip and latex-free elastic straps are becoming standard globally to improve both fit and viral filtration efficiency (VFE).

Market Dynamics

Our researchers analyzed the data with 2025 as the base year, along with the key drivers, trends, and challenges. A holistic analysis of drivers will help companies refine their marketing strategies to gain a competitive advantage.

  • Strategic planning in the sector now requires a deep dive into nuanced technical and operational challenges. A key consideration is the cost of biodegradable vs synthetic masks, a debate central to adopting circular economy in PPE manufacturing and addressing the environmental impact of polypropylene masks. Simultaneously, material science for lower breathing resistance is crucial for enhancing breathability in N95 respirators.
  • Supply chain challenges for melt-blown fabric persist, complicating production. On the regulatory front, understanding the certification requirements for medical face masks and the filtration efficiency standards for FFP2 masks is critical for market access. This intersects with occupational safety standards for industrial respirators, especially concerning PPE for volatile organic compound protection.
  • Innovation is paramount, with a focus on the impact of nanotechnology on filter efficiency and the role of antimicrobial coatings in infection control. As the industry moves forward, strategic focus must be on innovations in reusable mask filtration technology and advancements in electrostatic filter media.
  • For smart devices, the development of smart PPE for monitoring filter lifespan is a key differentiator.
  • Firms addressing these issues in tandem, such as improving fluid resistance in surgical masks while also solving the challenges of recycling single-use face masks and navigating regulations for disposable medical devices waste, can improve their market standing by over 10% compared to those focusing on single issues.
  • The push for developments in bio-based mask materials and better ergonomic design for extended respirator wear will define the next generation of products.

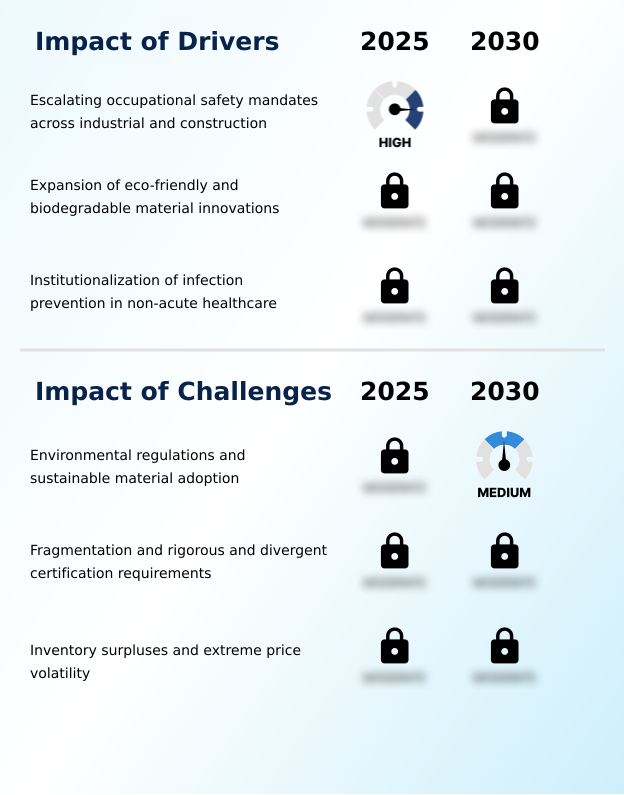
What are the key market drivers leading to the rise in the adoption of Face Mask Industry?

  • Escalating occupational safety mandates across industrial and construction sectors are a key driver stimulating demand for certified respiratory protection.

  • Strict occupational safety regulations and industrial safety mandates are compelling the adoption of high-performance respirators. Compliance with respiratory protection standards for particulate matter filtration is non-negotiable for workplace hazard mitigation.
  • This drives demand for certified N95 respirators and FFP2 respirators, which must demonstrate superior particulate filtration efficiency (PFE). For environments with higher contaminant concentrations, more robust solutions like an air-purifying respirator (APR) or powered air-purifying respirator (PAPR) are required.
  • Designs now focus on user endurance, with an improved exhalation valve design reducing breathing resistance by up to 25%. This focus ensures that devices for industrial dust protection are both effective and tolerable for long shifts.

What are the market trends shaping the Face Mask Industry?

  • A significant market trend is emerging with the integration of environmentally sustainable and circular materials. This shift is influencing product design and manufacturing toward greater ecological responsibility.

  • Market evolution is defined by a pivot towards sustainable ppe solutions and advanced textile innovation. There is a growing adoption of bio-based compostable alternatives and biodegradable single-use options, reflecting a commitment to circular economy principles.
  • Innovations in nanofiber filtration and breathable fabric technology are enhancing performance, with some reusable filtration systems improving particulate capture by over 20% compared to previous models. Concurrently, smart PPE integration is gaining traction; sensor-integrated PPE now provides real-time performance data.
  • The scope is also broadening to include consumer wellness products featuring antimicrobial coatings or cosmetic hydrogel and clay-based formulations, indicating a market diversification beyond traditional protection.

What challenges does the Face Mask Industry face during its growth?

  • A primary market challenge involves balancing compliance with stringent environmental regulations against the technical and financial complexities of adopting sustainable materials.

  • A key challenge is achieving environmental impact reduction while maintaining performance standards for disposable protective apparel. The industry relies heavily on melt-blown non-woven polypropylene and electrostatic non-woven fabric, whose disposal creates ecological pressure. Establishing domestic manufacturing capacity is critical for supply chain resilience and avoiding emergency procurement cycles.
  • However, transitioning to new materials is complex for regulatory compliance management, as any new medical-grade polymer must meet stringent metrics like synthetic blood penetration resistance and a low differential pressure (delta p) for breathability.
  • Innovations in material science are essential, as alternative materials often increase production costs by 30% and may not initially meet the filtration efficacy required for cleanroom certified masks.

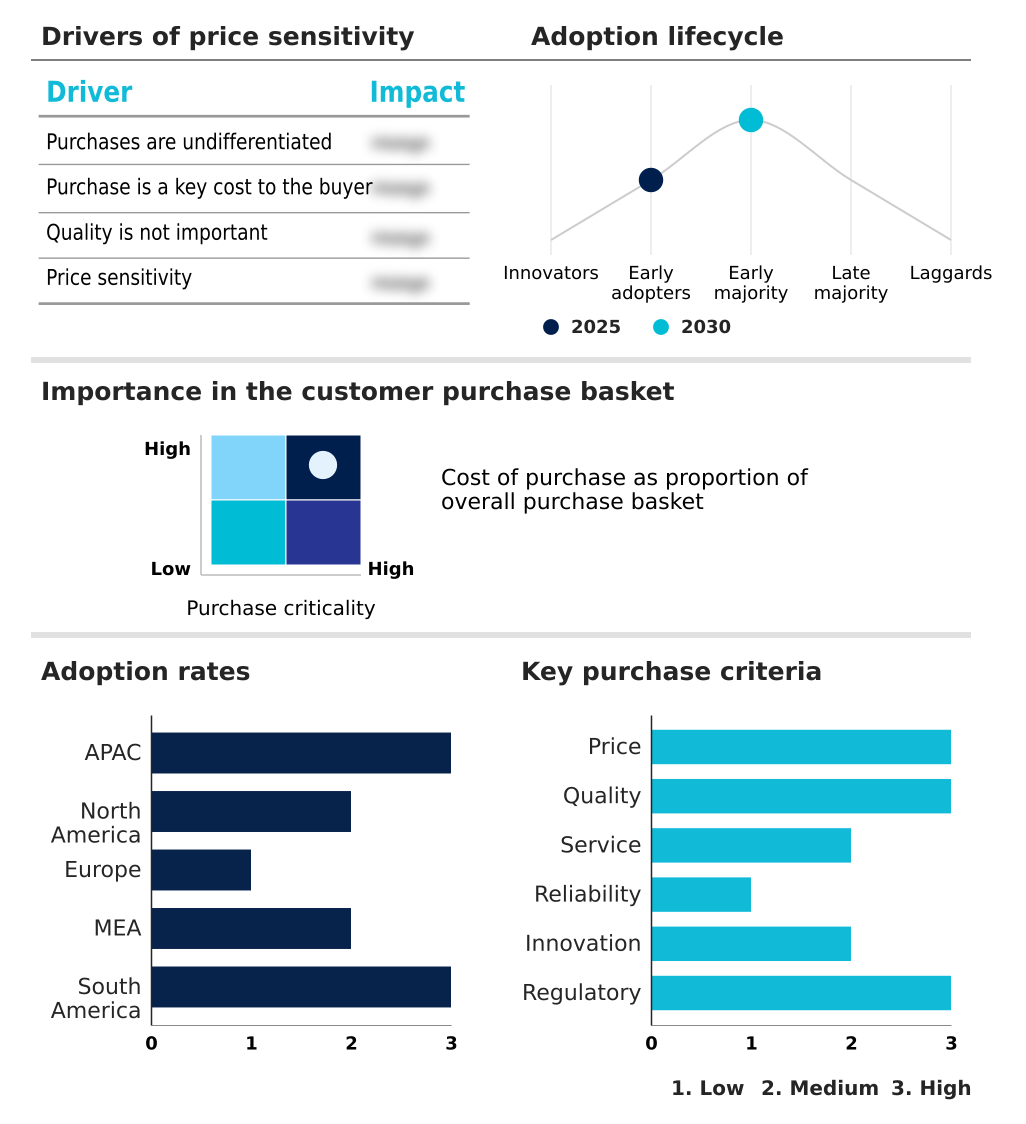
Exclusive Technavio Analysis on Customer Landscape

The face mask market forecasting report includes the adoption lifecycle of the market, covering from the innovator’s stage to the laggard’s stage. It focuses on adoption rates in different regions based on penetration. Furthermore, the face mask market report also includes key purchase criteria and drivers of price sensitivity to help companies evaluate and develop their market growth analysis strategies.

Customer Landscape of Face Mask Industry

Competitive Landscape

Companies are implementing various strategies, such as strategic alliances, face mask market forecast, partnerships, mergers and acquisitions, geographical expansion, and product/service launches, to enhance their presence in the industry.

3M Co. - Offerings are centered on advanced respiratory protection, including certified filtration devices and specialized barriers designed for critical safety, industrial, and healthcare applications.

The industry research and growth report includes detailed analyses of the competitive landscape of the market and information about key companies, including:

  • 3M Co.
  • Alpha Pro Tech Ltd.
  • Ansell Ltd.
  • BYD Co. Ltd.
  • Cardinal Health Inc.
  • Dragerwerk AG and Co. KGaA
  • Dynarex Corp.
  • Honeywell International Inc.
  • Kimberly Clark Corp.
  • Makrite
  • Medline Inc.
  • Molnlycke Health Care AB
  • O2 Canada
  • Ohlone Press LLC
  • Prestige Medical Ltd
  • Respro UK Ltd.
  • RZ Mask
  • Unicharm Corp.
  • UVEX GmbH and Co. KG
  • Winner Medical Co. Ltd.

Qualitative and quantitative analysis of companies has been conducted to help clients understand the wider business environment as well as the strengths and weaknesses of key industry players. Data is qualitatively analyzed to categorize companies as pure play, category-focused, industry-focused, and diversified; it is quantitatively analyzed to categorize companies as dominant, leading, strong, tentative, and weak.

Recent Development and News in Face mask market

  • In September 2024, 3M Co. announced a strategic partnership with a European textile innovator to commercialize a new nanofiber filter technology derived from recycled ocean plastics, aiming to enhance both filtration efficiency and sustainability.
  • In December 2024, Honeywell International Inc. launched a new line of smart respirators featuring integrated sensors to monitor filter life and ensure proper facial seal, targeting industrial and healthcare sectors.
  • In February 2025, Kimberly Clark Corp. received regulatory approval for a new line of surgical masks incorporating advanced anti-fog and fluid-resistant coatings designed for high-intensity clinical environments.
  • In May 2025, Ansell Ltd. announced the acquisition of a specialized firm in bio-based polymers to accelerate its transition toward manufacturing biodegradable single-use protective gloves and masks.

Dive into Technavio’s robust research methodology, blending expert interviews, extensive data synthesis, and validated models for unparalleled Face Mask Market insights. See full methodology.

Market Scope
Page number 281
Base year 2025
Historic period 2020-2024
Forecast period 2026-2030
Growth momentum & CAGR Accelerate at a CAGR of 6%
Market growth 2026-2030 USD 4563.7 million
Market structure Fragmented
YoY growth 2025-2026(%) 5.6%
Key countries China, Japan, India, South Korea, Indonesia, Australia, US, Canada, Mexico, Germany, UK, France, Italy, Spain, The Netherlands, Saudi Arabia, UAE, Turkey, South Africa, Israel, Brazil, Argentina and Chile
Competitive landscape Leading Companies, Market Positioning of Companies, Competitive Strategies, and Industry Risks

Request Free Sample

Research Analyst Overview

  • The market is undergoing a critical transformation from commoditized personal protective equipment (PPE) to a sector driven by material science. Boardroom decisions now weigh the strategic value of investing in breathable fabric technology and nanofiber filtration against scaling production of conventional surgical masks made from melt-blown non-woven polypropylene.
  • Advanced R&D has led to products with a 25% lower differential pressure (delta p), significantly enhancing user comfort. The landscape includes a wide array of devices, from N95 respirators and FFP2 respirators for industrial dust protection to cleanroom certified masks. Innovations include antimicrobial coatings and activated carbon filters, alongside specialized hydrogel and clay-based formulations for cosmetic use.
  • The development of bio-based compostable alternatives and biodegradable single-use options addresses sustainability concerns. Performance is benchmarked by viral filtration efficiency (VFE), particulate filtration efficiency (PFE), and synthetic blood penetration resistance, meeting a strict fluid resistance benchmark.
  • Form factors range from disposable protective apparel to reusable filtration systems like an air-purifying respirator (APR), powered air-purifying respirator (PAPR), elastomeric half-mask respirator, and full facepiece respirator, all featuring ergonomic fit design with an adjustable nose clip, latex-free elastic straps, improved exhalation valve design, and hypoallergenic materials, all assembled with ultrasonic welding construction from medical-grade polymer.

What are the Key Data Covered in this Face Mask Market Research and Growth Report?

  • What is the expected growth of the Face Mask Market between 2026 and 2030?

    • USD 4.56 billion, at a CAGR of 6%

  • What segmentation does the market report cover?

    • The report is segmented by Type (Surgical mask, N95 respirators, and Dust mask), Channel (Offline, and Online), Usage (Disposable, and Reusable) and Geography (APAC, North America, Europe, Middle East and Africa, South America)

  • Which regions are analyzed in the report?

    • APAC, North America, Europe, Middle East and Africa and South America

  • What are the key growth drivers and market challenges?

    • Escalating occupational safety mandates across industrial and construction, Environmental regulations and sustainable material adoption

  • Who are the major players in the Face Mask Market?

    • 3M Co., Alpha Pro Tech Ltd., Ansell Ltd., BYD Co. Ltd., Cardinal Health Inc., Dragerwerk AG and Co. KGaA, Dynarex Corp., Honeywell International Inc., Kimberly Clark Corp., Makrite, Medline Inc., Molnlycke Health Care AB, O2 Canada, Ohlone Press LLC, Prestige Medical Ltd, Respro UK Ltd., RZ Mask, Unicharm Corp., UVEX GmbH and Co. KG and Winner Medical Co. Ltd.

Market Research Insights

  • Market dynamics are increasingly shaped by data-driven decisions and a focus on specialized performance. For instance, the integration of air quality monitoring data with supply chains has enabled a 20% improvement in demand forecasting accuracy for consumer wellness products.
  • Investment in domestic manufacturing capacity is rising, with facilities implementing new processes that reduce waste by up to 15%, contributing to environmental impact reduction goals. Smart PPE integration is another key dynamic; new connected devices have been shown to improve compliance with safety protocols for healthcare worker safety by over 30%.
  • This shift toward measurable outcomes is redefining competitive advantages, moving the focus from volume production to quantifiable value in safety and efficiency.

We can help! Our analysts can customize this face mask market research report to meet your requirements.

Get in touch

1. Executive Summary

1.1 Market overview

Executive Summary - Chart on Market Overview
Executive Summary - Data Table on Market Overview
Executive Summary - Chart on Global Market Characteristics
Executive Summary - Chart on Market by Geography
Executive Summary - Chart on Market Segmentation by Type
Executive Summary - Chart on Market Segmentation by Channel
Executive Summary - Chart on Market Segmentation by Usage
Executive Summary - Chart on Incremental Growth
Executive Summary - Data Table on Incremental Growth
Executive Summary - Chart on Company Market Positioning

2. Technavio Analysis

2.1 Analysis of price sensitivity, lifecycle, customer purchase basket, adoption rates, and purchase criteria

2.2 Criticality of inputs and Factors of differentiation

Chart on Overview on criticality of inputs and factors of differentiation

2.3 Factors of disruption

Chart on Overview on factors of disruption

2.4 Impact of drivers and challenges

Chart on Impact of drivers and challenges in 2025 and 2030

3. Market Landscape

3.1 Market ecosystem

Chart on Parent Market
Data Table on - Parent Market

3.2 Market characteristics

Chart on Market characteristics analysis

3.3 Value chain analysis

Chart on Value chain analysis

4. Market Sizing

4.1 Market definition

Data Table on Offerings of companies included in the market definition

4.2 Market segment analysis

Market segments

4.3 Market size 2025

4.4 Market outlook: Forecast for 2025-2030

Chart on Global - Market size and forecast 2025-2030 ($ million)
Data Table on Global - Market size and forecast 2025-2030 ($ million)
Chart on Global Market: Year-over-year growth 2025-2030 (%)
Data Table on Global Market: Year-over-year growth 2025-2030 (%)

5. Historic Market Size

5.1 Global Face Mask Market 2020 - 2024

Historic Market Size - Data Table on Global Face Mask Market 2020 - 2024 ($ million)

5.2 Type segment analysis 2020 - 2024

Historic Market Size - Type Segment 2020 - 2024 ($ million)

5.3 Channel segment analysis 2020 - 2024

Historic Market Size - Channel Segment 2020 - 2024 ($ million)

5.4 Usage segment analysis 2020 - 2024

Historic Market Size - Usage Segment 2020 - 2024 ($ million)

5.5 Geography segment analysis 2020 - 2024

Historic Market Size - Geography Segment 2020 - 2024 ($ million)

5.6 Country segment analysis 2020 - 2024

Historic Market Size - Country Segment 2020 - 2024 ($ million)

6. Qualitative Analysis

6.1 Impact of AI in global face mask market

6.2 Impact of geopolitical conflict for global face mask market

7. Five Forces Analysis

7.1 Five forces summary

Five forces analysis - Comparison between 2025 and 2030

7.2 Bargaining power of buyers

Bargaining power of buyers - Impact of key factors 2025 and 2030

7.3 Bargaining power of suppliers

Bargaining power of suppliers - Impact of key factors in 2025 and 2030

7.4 Threat of new entrants

Threat of new entrants - Impact of key factors in 2025 and 2030

7.5 Threat of substitutes

Threat of substitutes - Impact of key factors in 2025 and 2030

7.6 Threat of rivalry

Threat of rivalry - Impact of key factors in 2025 and 2030

7.7 Market condition

Chart on Market condition - Five forces 2025 and 2030

8. Market Segmentation by Type

8.1 Market segments

Chart on Type - Market share 2025-2030 (%)
Data Table on Type - Market share 2025-2030 (%)

8.2 Comparison by Type

Chart on Comparison by Type
Data Table on Comparison by Type

8.3 Surgical mask - Market size and forecast 2025-2030

Chart on Surgical mask - Market size and forecast 2025-2030 ($ million)
Data Table on Surgical mask - Market size and forecast 2025-2030 ($ million)
Chart on Surgical mask - Year-over-year growth 2025-2030 (%)
Data Table on Surgical mask - Year-over-year growth 2025-2030 (%)

8.4 N95 respirators - Market size and forecast 2025-2030

Chart on N95 respirators - Market size and forecast 2025-2030 ($ million)
Data Table on N95 respirators - Market size and forecast 2025-2030 ($ million)
Chart on N95 respirators - Year-over-year growth 2025-2030 (%)
Data Table on N95 respirators - Year-over-year growth 2025-2030 (%)

8.5 Dust mask - Market size and forecast 2025-2030

Chart on Dust mask - Market size and forecast 2025-2030 ($ million)
Data Table on Dust mask - Market size and forecast 2025-2030 ($ million)
Chart on Dust mask - Year-over-year growth 2025-2030 (%)
Data Table on Dust mask - Year-over-year growth 2025-2030 (%)

8.6 Market opportunity by Type

Market opportunity by Type ($ million)
Data Table on Market opportunity by Type ($ million)

9. Market Segmentation by Channel

9.1 Market segments

Chart on Channel - Market share 2025-2030 (%)
Data Table on Channel - Market share 2025-2030 (%)

9.2 Comparison by Channel

Chart on Comparison by Channel
Data Table on Comparison by Channel

9.3 Offline - Market size and forecast 2025-2030

Chart on Offline - Market size and forecast 2025-2030 ($ million)
Data Table on Offline - Market size and forecast 2025-2030 ($ million)
Chart on Offline - Year-over-year growth 2025-2030 (%)
Data Table on Offline - Year-over-year growth 2025-2030 (%)

9.4 Online - Market size and forecast 2025-2030

Chart on Online - Market size and forecast 2025-2030 ($ million)
Data Table on Online - Market size and forecast 2025-2030 ($ million)
Chart on Online - Year-over-year growth 2025-2030 (%)
Data Table on Online - Year-over-year growth 2025-2030 (%)

9.5 Market opportunity by Channel

Market opportunity by Channel ($ million)
Data Table on Market opportunity by Channel ($ million)

10. Market Segmentation by Usage

10.1 Market segments

Chart on Usage - Market share 2025-2030 (%)
Data Table on Usage - Market share 2025-2030 (%)

10.2 Comparison by Usage

Chart on Comparison by Usage
Data Table on Comparison by Usage

10.3 Disposable - Market size and forecast 2025-2030

Chart on Disposable - Market size and forecast 2025-2030 ($ million)
Data Table on Disposable - Market size and forecast 2025-2030 ($ million)
Chart on Disposable - Year-over-year growth 2025-2030 (%)
Data Table on Disposable - Year-over-year growth 2025-2030 (%)

10.4 Reusable - Market size and forecast 2025-2030

Chart on Reusable - Market size and forecast 2025-2030 ($ million)
Data Table on Reusable - Market size and forecast 2025-2030 ($ million)
Chart on Reusable - Year-over-year growth 2025-2030 (%)
Data Table on Reusable - Year-over-year growth 2025-2030 (%)

10.5 Market opportunity by Usage

Market opportunity by Usage ($ million)
Data Table on Market opportunity by Usage ($ million)

11. Customer Landscape

11.1 Customer landscape overview

Analysis of price sensitivity, lifecycle, customer purchase basket, adoption rates, and purchase criteria

12. Geographic Landscape

12.1 Geographic segmentation

Chart on Market share by geography 2025-2030 (%)
Data Table on Market share by geography 2025-2030 (%)

12.2 Geographic comparison

Chart on Geographic comparison
Data Table on Geographic comparison

12.3 APAC - Market size and forecast 2025-2030

Chart on APAC - Market size and forecast 2025-2030 ($ million)
Data Table on APAC - Market size and forecast 2025-2030 ($ million)
Chart on APAC - Year-over-year growth 2025-2030 (%)
Data Table on APAC - Year-over-year growth 2025-2030 (%)
Chart on Regional Comparison - APAC
Data Table on Regional Comparison - APAC

12.3.1 China - Market size and forecast 2025-2030

Chart on China - Market size and forecast 2025-2030 ($ million)
Data Table on China - Market size and forecast 2025-2030 ($ million)
Chart on China - Year-over-year growth 2025-2030 (%)
Data Table on China - Year-over-year growth 2025-2030 (%)

12.3.2 Japan - Market size and forecast 2025-2030

Chart on Japan - Market size and forecast 2025-2030 ($ million)
Data Table on Japan - Market size and forecast 2025-2030 ($ million)
Chart on Japan - Year-over-year growth 2025-2030 (%)
Data Table on Japan - Year-over-year growth 2025-2030 (%)

12.3.3 India - Market size and forecast 2025-2030

Chart on India - Market size and forecast 2025-2030 ($ million)
Data Table on India - Market size and forecast 2025-2030 ($ million)
Chart on India - Year-over-year growth 2025-2030 (%)
Data Table on India - Year-over-year growth 2025-2030 (%)

12.3.4 South Korea - Market size and forecast 2025-2030

Chart on South Korea - Market size and forecast 2025-2030 ($ million)
Data Table on South Korea - Market size and forecast 2025-2030 ($ million)
Chart on South Korea - Year-over-year growth 2025-2030 (%)
Data Table on South Korea - Year-over-year growth 2025-2030 (%)

12.3.5 Indonesia - Market size and forecast 2025-2030

Chart on Indonesia - Market size and forecast 2025-2030 ($ million)
Data Table on Indonesia - Market size and forecast 2025-2030 ($ million)
Chart on Indonesia - Year-over-year growth 2025-2030 (%)
Data Table on Indonesia - Year-over-year growth 2025-2030 (%)

12.3.6 Australia - Market size and forecast 2025-2030

Chart on Australia - Market size and forecast 2025-2030 ($ million)
Data Table on Australia - Market size and forecast 2025-2030 ($ million)
Chart on Australia - Year-over-year growth 2025-2030 (%)
Data Table on Australia - Year-over-year growth 2025-2030 (%)

12.4 North America - Market size and forecast 2025-2030

Chart on North America - Market size and forecast 2025-2030 ($ million)
Data Table on North America - Market size and forecast 2025-2030 ($ million)
Chart on North America - Year-over-year growth 2025-2030 (%)
Data Table on North America - Year-over-year growth 2025-2030 (%)
Chart on Regional Comparison - North America
Data Table on Regional Comparison - North America

12.4.1 US - Market size and forecast 2025-2030

Chart on US - Market size and forecast 2025-2030 ($ million)
Data Table on US - Market size and forecast 2025-2030 ($ million)
Chart on US - Year-over-year growth 2025-2030 (%)
Data Table on US - Year-over-year growth 2025-2030 (%)

12.4.2 Canada - Market size and forecast 2025-2030

Chart on Canada - Market size and forecast 2025-2030 ($ million)
Data Table on Canada - Market size and forecast 2025-2030 ($ million)
Chart on Canada - Year-over-year growth 2025-2030 (%)
Data Table on Canada - Year-over-year growth 2025-2030 (%)

12.4.3 Mexico - Market size and forecast 2025-2030

Chart on Mexico - Market size and forecast 2025-2030 ($ million)
Data Table on Mexico - Market size and forecast 2025-2030 ($ million)
Chart on Mexico - Year-over-year growth 2025-2030 (%)
Data Table on Mexico - Year-over-year growth 2025-2030 (%)

12.5 Europe - Market size and forecast 2025-2030

Chart on Europe - Market size and forecast 2025-2030 ($ million)
Data Table on Europe - Market size and forecast 2025-2030 ($ million)
Chart on Europe - Year-over-year growth 2025-2030 (%)
Data Table on Europe - Year-over-year growth 2025-2030 (%)
Chart on Regional Comparison - Europe
Data Table on Regional Comparison - Europe

12.5.1 Germany - Market size and forecast 2025-2030

Chart on Germany - Market size and forecast 2025-2030 ($ million)
Data Table on Germany - Market size and forecast 2025-2030 ($ million)
Chart on Germany - Year-over-year growth 2025-2030 (%)
Data Table on Germany - Year-over-year growth 2025-2030 (%)

12.5.2 UK - Market size and forecast 2025-2030

Chart on UK - Market size and forecast 2025-2030 ($ million)
Data Table on UK - Market size and forecast 2025-2030 ($ million)
Chart on UK - Year-over-year growth 2025-2030 (%)
Data Table on UK - Year-over-year growth 2025-2030 (%)

12.5.3 France - Market size and forecast 2025-2030

Chart on France - Market size and forecast 2025-2030 ($ million)
Data Table on France - Market size and forecast 2025-2030 ($ million)
Chart on France - Year-over-year growth 2025-2030 (%)
Data Table on France - Year-over-year growth 2025-2030 (%)

12.5.4 Italy - Market size and forecast 2025-2030

Chart on Italy - Market size and forecast 2025-2030 ($ million)
Data Table on Italy - Market size and forecast 2025-2030 ($ million)
Chart on Italy - Year-over-year growth 2025-2030 (%)
Data Table on Italy - Year-over-year growth 2025-2030 (%)

12.5.5 Spain - Market size and forecast 2025-2030

Chart on Spain - Market size and forecast 2025-2030 ($ million)
Data Table on Spain - Market size and forecast 2025-2030 ($ million)
Chart on Spain - Year-over-year growth 2025-2030 (%)
Data Table on Spain - Year-over-year growth 2025-2030 (%)

12.5.6 The Netherlands - Market size and forecast 2025-2030

Chart on The Netherlands - Market size and forecast 2025-2030 ($ million)
Data Table on The Netherlands - Market size and forecast 2025-2030 ($ million)
Chart on The Netherlands - Year-over-year growth 2025-2030 (%)
Data Table on The Netherlands - Year-over-year growth 2025-2030 (%)

12.6 Middle East and Africa - Market size and forecast 2025-2030

Chart on Middle East and Africa - Market size and forecast 2025-2030 ($ million)
Data Table on Middle East and Africa - Market size and forecast 2025-2030 ($ million)
Chart on Middle East and Africa - Year-over-year growth 2025-2030 (%)
Data Table on Middle East and Africa - Year-over-year growth 2025-2030 (%)
Chart on Regional Comparison - Middle East and Africa
Data Table on Regional Comparison - Middle East and Africa

12.6.1 Saudi Arabia - Market size and forecast 2025-2030

Chart on Saudi Arabia - Market size and forecast 2025-2030 ($ million)
Data Table on Saudi Arabia - Market size and forecast 2025-2030 ($ million)
Chart on Saudi Arabia - Year-over-year growth 2025-2030 (%)
Data Table on Saudi Arabia - Year-over-year growth 2025-2030 (%)

12.6.2 UAE - Market size and forecast 2025-2030

Chart on UAE - Market size and forecast 2025-2030 ($ million)
Data Table on UAE - Market size and forecast 2025-2030 ($ million)
Chart on UAE - Year-over-year growth 2025-2030 (%)
Data Table on UAE - Year-over-year growth 2025-2030 (%)

12.6.3 Turkey - Market size and forecast 2025-2030

Chart on Turkey - Market size and forecast 2025-2030 ($ million)
Data Table on Turkey - Market size and forecast 2025-2030 ($ million)
Chart on Turkey - Year-over-year growth 2025-2030 (%)
Data Table on Turkey - Year-over-year growth 2025-2030 (%)

12.6.4 South Africa - Market size and forecast 2025-2030

Chart on South Africa - Market size and forecast 2025-2030 ($ million)
Data Table on South Africa - Market size and forecast 2025-2030 ($ million)
Chart on South Africa - Year-over-year growth 2025-2030 (%)
Data Table on South Africa - Year-over-year growth 2025-2030 (%)

12.6.5 Israel - Market size and forecast 2025-2030

Chart on Israel - Market size and forecast 2025-2030 ($ million)
Data Table on Israel - Market size and forecast 2025-2030 ($ million)
Chart on Israel - Year-over-year growth 2025-2030 (%)
Data Table on Israel - Year-over-year growth 2025-2030 (%)

12.7 South America - Market size and forecast 2025-2030

Chart on South America - Market size and forecast 2025-2030 ($ million)
Data Table on South America - Market size and forecast 2025-2030 ($ million)
Chart on South America - Year-over-year growth 2025-2030 (%)
Data Table on South America - Year-over-year growth 2025-2030 (%)
Chart on Regional Comparison - South America
Data Table on Regional Comparison - South America

12.7.1 Brazil - Market size and forecast 2025-2030

Chart on Brazil - Market size and forecast 2025-2030 ($ million)
Data Table on Brazil - Market size and forecast 2025-2030 ($ million)
Chart on Brazil - Year-over-year growth 2025-2030 (%)
Data Table on Brazil - Year-over-year growth 2025-2030 (%)

12.7.2 Argentina - Market size and forecast 2025-2030

Chart on Argentina - Market size and forecast 2025-2030 ($ million)
Data Table on Argentina - Market size and forecast 2025-2030 ($ million)
Chart on Argentina - Year-over-year growth 2025-2030 (%)
Data Table on Argentina - Year-over-year growth 2025-2030 (%)

12.7.3 Chile - Market size and forecast 2025-2030

Chart on Chile - Market size and forecast 2025-2030 ($ million)
Data Table on Chile - Market size and forecast 2025-2030 ($ million)
Chart on Chile - Year-over-year growth 2025-2030 (%)
Data Table on Chile - Year-over-year growth 2025-2030 (%)

12.8 Market opportunity by geography

Market opportunity by geography ($ million)
Data Tables on Market opportunity by geography ($ million)

13. Drivers, Challenges, and Opportunity

13.1 Market drivers

Escalating occupational safety mandates across industrial and construction
Expansion of eco-friendly and biodegradable material innovations
Institutionalization of infection prevention in non-acute healthcare

13.2 Market challenges

Environmental regulations and sustainable material adoption
Fragmentation and rigorous and divergent certification requirements
Inventory surpluses and extreme price volatility

13.3 Impact of drivers and challenges

Impact of drivers and challenges in 2025 and 2030

13.4 Market opportunities

Integration of environmentally sustainable and circular materials
Normalization of functional aesthetics and customization designs
Technological advancements in smart and sensor-integrated PPE

14. Competitive Landscape

14.1 Overview

14.2

Overview on criticality of inputs and factors of differentiation

14.3 Landscape disruption

Overview on factors of disruption

14.4 Industry risks

Impact of key risks on business

15. Competitive Analysis

15.1 Companies profiled

Companies covered

15.2 Company ranking index

15.3 Market positioning of companies

Matrix on companies position and classification

15.4 3M Co.

3M Co. - Overview
3M Co. - Business segments
3M Co. - Key news
3M Co. - Key offerings
3M Co. - Segment focus
SWOT

15.5 Ansell Ltd.

Ansell Ltd. - Overview
Ansell Ltd. - Business segments
Ansell Ltd. - Key offerings
Ansell Ltd. - Segment focus
SWOT

15.6 BYD Co. Ltd.

BYD Co. Ltd. - Overview
BYD Co. Ltd. - Business segments
BYD Co. Ltd. - Key news
BYD Co. Ltd. - Key offerings
BYD Co. Ltd. - Segment focus
SWOT

15.7 Cardinal Health Inc.

Cardinal Health Inc. - Overview
Cardinal Health Inc. - Business segments
Cardinal Health Inc. - Key offerings
Cardinal Health Inc. - Segment focus
SWOT

15.8 Dragerwerk AG and Co. KGaA

Dragerwerk AG and Co. KGaA - Overview
Dragerwerk AG and Co. KGaA - Business segments
Dragerwerk AG and Co. KGaA - Key offerings
Dragerwerk AG and Co. KGaA - Segment focus
SWOT

15.9 Honeywell International Inc.

Honeywell International Inc. - Overview
Honeywell International Inc. - Business segments
Honeywell International Inc. - Key news
Honeywell International Inc. - Key offerings
Honeywell International Inc. - Segment focus
SWOT

15.10 Kimberly Clark Corp.

Kimberly Clark Corp. - Overview
Kimberly Clark Corp. - Business segments
Kimberly Clark Corp. - Key news
Kimberly Clark Corp. - Key offerings
Kimberly Clark Corp. - Segment focus
SWOT

15.11 Makrite

Makrite - Overview
Makrite - Product / Service
Makrite - Key offerings
SWOT

15.12 Medline Inc.

Medline Inc. - Overview
Medline Inc. - Product / Service
Medline Inc. - Key offerings
SWOT

15.13 Molnlycke Health Care AB

Molnlycke Health Care AB - Overview
Molnlycke Health Care AB - Product / Service
Molnlycke Health Care AB - Key offerings
SWOT

15.14 O2 Canada

O2 Canada - Overview
O2 Canada - Product / Service
O2 Canada - Key offerings
SWOT

15.15 Prestige Medical Ltd

Prestige Medical Ltd - Overview
Prestige Medical Ltd - Product / Service
Prestige Medical Ltd - Key offerings
SWOT

15.16 Unicharm Corp.

Unicharm Corp. - Overview
Unicharm Corp. - Business segments
Unicharm Corp. - Key offerings
Unicharm Corp. - Segment focus
SWOT

15.17 UVEX GmbH and Co. KG

UVEX GmbH and Co. KG - Overview
UVEX GmbH and Co. KG - Product / Service
UVEX GmbH and Co. KG - Key offerings
SWOT

15.18 Winner Medical Co. Ltd.

Winner Medical Co. Ltd. - Overview
Winner Medical Co. Ltd. - Product / Service
Winner Medical Co. Ltd. - Key offerings
SWOT

16. Appendix

16.1 Scope of the report

Market definition
Objectives
Notes and caveats

16.2 Inclusions and exclusions checklist

Inclusions checklist
Exclusions checklist

16.3 Currency conversion rates for US$

16.4 Research methodology

16.5 Data procurement

Information sources

16.6 Data validation

16.7 Validation techniques employed for market sizing

16.8 Data synthesis

16.9 360 degree market analysis

16.10 List of abbreviations

Research Methodology

Technavio presents a detailed picture of the market by way of study, synthesis, and summation of data from multiple sources. The analysts have presented the various facets of the market with a particular focus on identifying the key industry influencers. The data thus presented is comprehensive, reliable, and the result of extensive research, both primary and secondary.

INFORMATION SOURCES

Primary sources

  • Manufacturers and suppliers
  • Channel partners
  • Industry experts
  • Strategic decision makers

Secondary sources

  • Industry journals and periodicals
  • Government data
  • Financial reports of key industry players
  • Historical data
  • Press releases

DATA ANALYSIS

Data Synthesis

  • Collation of data
  • Estimation of key figures
  • Analysis of derived insights

Data Validation

  • Triangulation with data models
  • Reference against proprietary databases
  • Corroboration with industry experts

REPORT WRITING

Qualitative

  • Market drivers
  • Market challenges
  • Market trends
  • Five forces analysis

Quantitative

  • Market size and forecast
  • Market segmentation
  • Geographical insights
  • Competitive landscape

Interested in this report?

Get your sample now to see our research methodology and insights!

Download Now

Frequently Asked Questions

Face Mask market growth will increase by USD 4563.7 million during 2026-2030.

The Face Mask market is expected to grow at a CAGR of 6% during 2026-2030.

Face Mask market is segmented by Type (Surgical mask, N95 respirators, Dust mask) Channel (Offline, Online) Usage (Disposable, Reusable)

3M Co., Alpha Pro Tech Ltd., Ansell Ltd., BYD Co. Ltd., Cardinal Health Inc., Dragerwerk AG and Co. KGaA, Dynarex Corp., Honeywell International Inc., Kimberly Clark Corp., Makrite, Medline Inc., Molnlycke Health Care AB, O2 Canada, Ohlone Press LLC, Prestige Medical Ltd, Respro UK Ltd., RZ Mask, Unicharm Corp., UVEX GmbH and Co. KG, Winner Medical Co. Ltd. are a few of the key vendors in the Face Mask market.

APAC will register the highest growth rate of 49.8% among the other regions. Therefore, the Face Mask market in APAC is expected to garner significant business opportunities for the vendors during the forecast period.

China, Japan, India, South Korea, Indonesia, Australia, US, Canada, Mexico, Germany, UK, France, Italy, Spain, The Netherlands, Saudi Arabia, UAE, Turkey, South Africa, Israel, Brazil, Argentina, Chile

  • Escalating occupational safety mandates across industrial and construction is the driving factor this market.

The Face Mask market vendors should focus on grabbing business opportunities from the Type segment as it accounted for the largest market share in the base year.
RIA - Research AI Assistant
Ask RIA