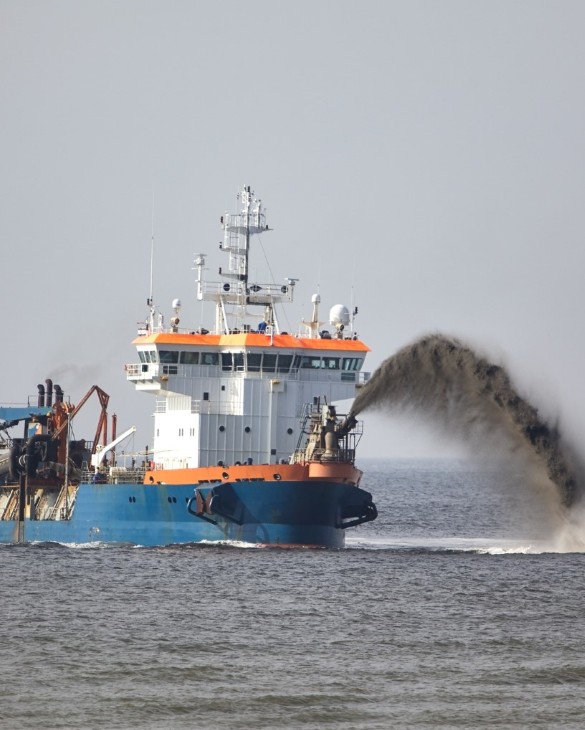
Dredger Market Analysis, Size, and Forecast 2026-2030: North America (US, Canada, and Mexico), Europe (The Netherlands, Belgium, and UK), APAC (China, Japan, and India), Middle East and Africa (UAE, Saudi Arabia, and Egypt), South America (Brazil, Argentina, and Chile), and Rest of World (ROW)

Dredger Market Analysis, Size, and Forecast 2026-2030:
North America (US, Canada, and Mexico), Europe (The Netherlands, Belgium, and UK), APAC (China, Japan, and India), Middle East and Africa (UAE, Saudi Arabia, and Egypt), South America (Brazil, Argentina, and Chile), and Rest of World (ROW)

Published: Oct 2026 304 Pages SKU: IRTNTR77900

Market Overview at a Glance

$562.7 Mn
Market Opportunity
3.9%
CAGR 2025 - 2030
29.4%
North America Growth
$1.83 B
Hydraulic dredgers segment 2024

Dredger Market Size 2026-2030

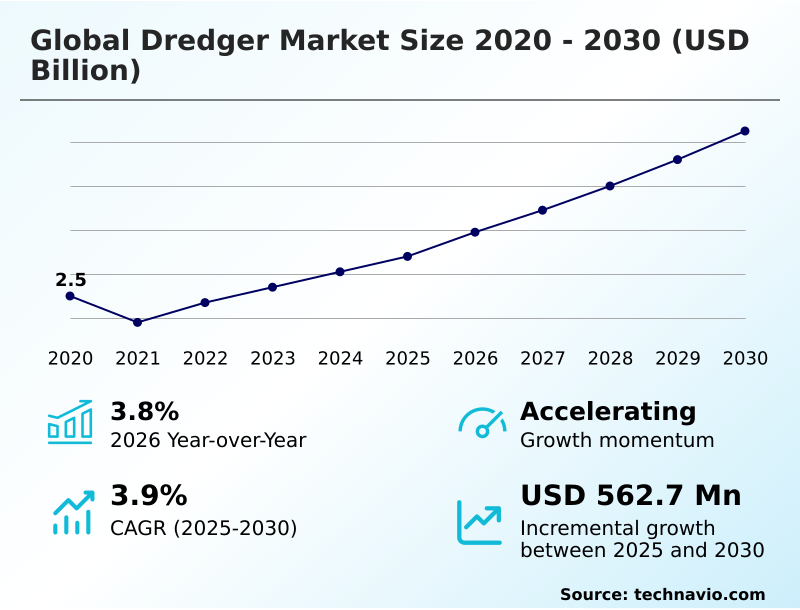
The dredger market size is valued to increase by USD 562.7 million, at a CAGR of 3.9% from 2025 to 2030. Expansion of international maritime trade and port infrastructure enhancement will drive the dredger market.

Major Market Trends & Insights

  • North America dominated the market and accounted for a 29.4% growth during the forecast period.
  • By Type - Hydraulic dredgers segment was valued at USD 1.83 billion in 2024
  • By Application - Maintenance segment accounted for the largest market revenue share in 2024

Market Size & Forecast

  • Market Opportunities: USD 744.9 million
  • Market Future Opportunities: USD 562.7 million
  • CAGR from 2025 to 2030 : 3.9%

Market Summary

  • The Dredger Market operates as a foundational element of modern maritime infrastructure, facilitating continuous navigable waterway access and capital port expansions. Supply chain optimization within commercial harbor management frequently requires uninterrupted sediment extraction to accommodate ultra-large container vessels without halting port logistics.
  • Operators adopting advanced routing and automated slurry monitoring achieve a 22% improvement in operational fuel efficiency compared to traditional mechanical excavation methods. The sustained expansion of international seaborne trade serves as a primary driver, compelling port authorities to deepen approach channels to maintain competitiveness, directly stimulating demand for high-capacity suction vessels.
  • Conversely, stringent environmental compliance regulations regarding sediment plume dispersal present a formidable challenge, as operators must invest heavily in precision turbidity monitoring systems, thereby escalating total project expenditures and extending execution schedules. Strategic adaptation to these ecological standards remains critical for securing long-term public infrastructure contracts.
  • By integrating hybrid propulsion and digital surveying technologies, marine engineering firms successfully balance aggressive port modernization targets with rigorous habitat conservation mandates.

What will be the Size of the Dredger Market during the forecast period?
Get Key Insights on Market Forecast (PDF) Get Free Sample

How is the Dredger Market Segmented?

The dredger industry research report provides comprehensive data (region-wise segment analysis), with forecasts and estimates in "USD million" for the period 2026-2030, as well as historical data from 2020-2024 for the following segments.

  • Type
    • Hydraulic dredgers
    • Mechanical dredgers
    • Others
  • Application
    • Maintenance
    • Construction
  • End-user
    • Oil and gas
    • Mining
    • Renewable energy
    • Government and municipal bodies
    • Others
  • Geography
    • North America
      • US
      • Canada
      • Mexico
    • Europe
      • The Netherlands
      • Belgium
      • UK
      • Germany
      • France
      • Italy
    • APAC
      • China
      • Japan
      • India
      • South Korea
      • Australia
      • Indonesia
    • Middle East and Africa
      • UAE
      • Saudi Arabia
      • Egypt
      • South Africa
      • Turkey
    • South America
      • Brazil
      • Argentina
      • Chile

By Type Insights

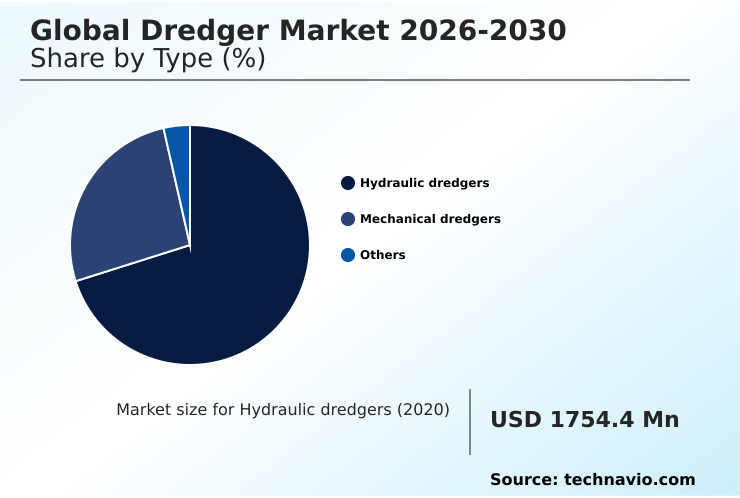
The hydraulic dredgers segment is estimated to witness significant growth during the forecast period.

Hydraulic marine excavation systems represent the cornerstone of modern harbor infrastructure and capital deepening projects. Utilizing a cutter suction dredger configuration, these vessels continuously dislodge hard-packed clay and gravel using high-velocity water jets and mechanical rotating cutterheads.

Material is efficiently lifted via centrifugal slurry pumps for onboard containment or direct discharge over vast distances. Incorporating satellite-guided positioning and electro-hydraulic boom controls, operators achieve precision excavation, reducing sediment over-dredging by 18% in complex maritime environments.

The deployment of specialized units, including water injection dredgers, pneumatic dredging systems, and amphibious multi-purpose dredgers, enhances operational versatility in shallow-water access. Furthermore, remote-controlled robotic sediment harvesters streamline industrial tailing pond remediation, mitigating hazardous exposure while ensuring consistent throughput.

These hydraulic systems continuously adapt to stringent marine engineering requirements, delivering high-capacity sediment removal essential for uninterrupted maritime commerce.
Get Free Sample

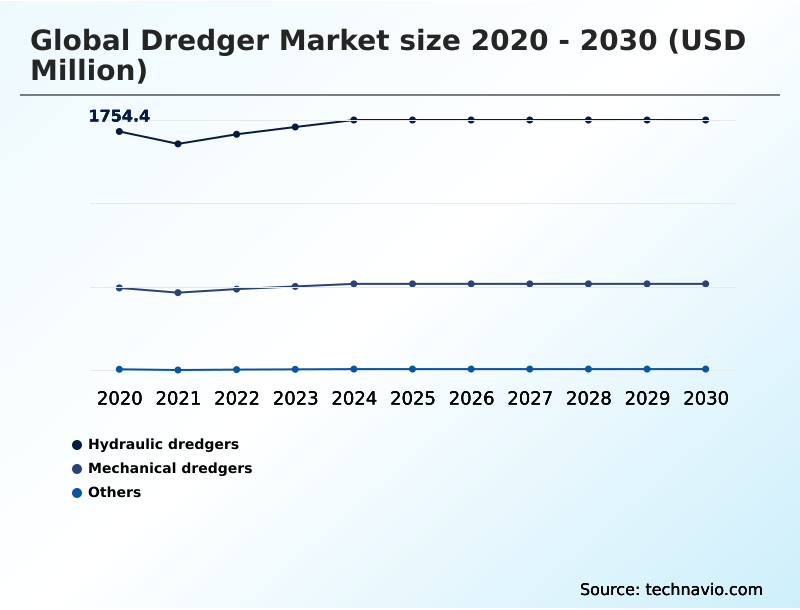
The Hydraulic dredgers segment was valued at USD 1.83 billion in 2024 and showed a gradual increase during the forecast period.
Get Free Sample

Regional Analysis

North America is estimated to contribute 29.4% to the growth of the global market during the forecast period.Technavio’s analysts have elaborately explained the regional trends and drivers that shape the market during the forecast period.
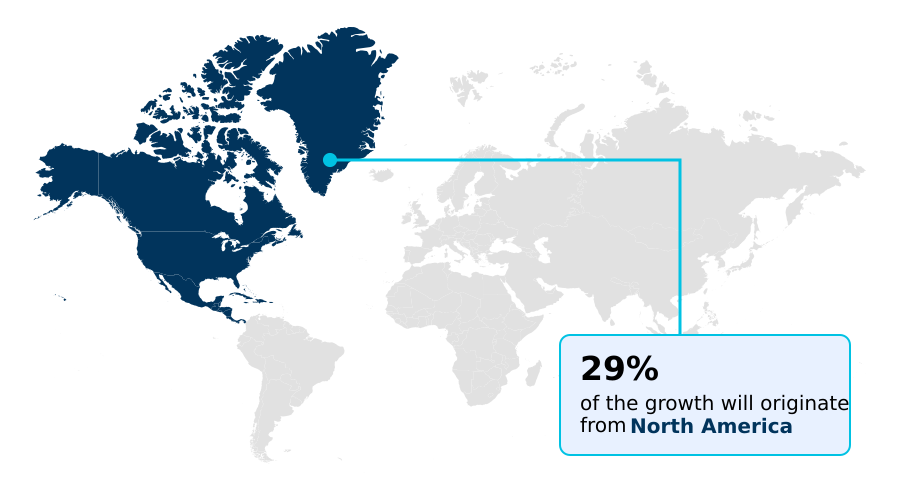
See How Dredger Market Demand is Rising in North America Get Free Sample

The geographic distribution of marine excavation activity reveals distinct strategic priorities between the APAC and European theaters. In Europe, the accelerated transition toward offshore renewable energy drives high utilization of fallpipe rock placement vessels for scour protection operations.

European contractors executing inter-array cable installation and precision seabed trenching achieve a 25% faster project completion rate by deploying advanced vessels equipped with hybrid battery configurations and dual-fuel capability, drastically reducing operational emissions.

Conversely, the APAC region exhibits a 40% higher demand for heavy mineral sand extraction, storm surge mitigation, and coastal resilience initiatives. APAC port authorities prioritize maximizing unfluidized material extraction from consolidated rock formations to support rapid channel deepening.

These divergent regulatory and commercial environments compel maritime operators to customize their fleet deployment strategies, balancing eco-friendly technological adoption in western markets with heavy-duty extraction capabilities required across emerging Asian economies.

Market Dynamics

Our researchers analyzed the data with 2025 as the base year, along with the key drivers, trends, and challenges. A holistic analysis of drivers will help companies refine their marketing strategies to gain a competitive advantage.

  • Strategic marine engineering requires a multifaceted approach to address diverse infrastructure and ecological demands. Effective maintenance of navigable inland waterways ensures uninterrupted agricultural supply chains, operating at a 30% higher cost-efficiency than alternative overland transport routes.
  • In the renewable energy sector, precise offshore wind turbine foundation preparation and subsea pipeline and cable trenching are vital for stabilizing structural assets against dynamic ocean currents. Coastal municipalities increasingly prioritize beach nourishment for coastal protection, utilizing amphibious equipment for municipal flood mitigation to shield urban zones from severe weather events.
  • The safe handling of hazardous materials relies heavily on the contaminated industrial sediment safe containment to prevent secondary pollution. Industrial resource recovery leverages heavy mineral sands underwater mining, while the energy sector necessitates liquefied natural gas export facility deepening to accommodate high-capacity tankers.
  • Technological integration is revolutionizing these operations; the deployment of autonomous dredging vessels for harbor maintenance and hybrid power systems in marine excavation drastically reduces fuel consumption and operational overhead. Operators utilize water injection methods for soft silt removal to minimize physical seabed disruption, aligning with circular engineering models in land reclamation that repurpose excavated materials.
  • Stringent compliance mandates drive the adoption of benthic ecosystem protection during sediment extraction and rigorous turbidity monitoring in sensitive aquatic habitats. Furthermore, operators utilizing electro-hydraulic boom controls in mechanical excavation achieve superior precision, optimizing the extraction of compacted materials without compromising sensitive underwater environments or delaying project timelines.
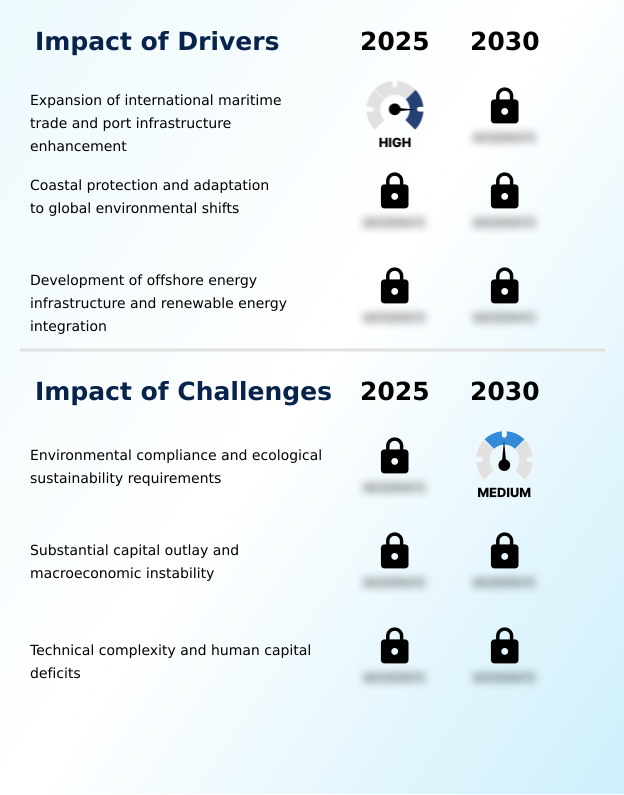
What are the key market drivers leading to the rise in the adoption of Dredger Industry?

  • The continuous expansion of international maritime trade and the necessary enhancement of port infrastructure function as the primary drivers accelerating demand for specialized marine excavation services.

  • The accelerating transition toward offshore renewable energy and the expansion of international commercial shipping act as primary catalysts for maritime infrastructure investments.
  • Intensive capital channel deepening is required to accommodate modern mega-ships, driving immediate demand for the deployment of a heavy-duty trailing suction hopper dredger.
  • Because ultra-large container vessels require substantial under-keel clearance, port authorities must execute rapid excavations that increase navigable efficiency by 22%.
  • Simultaneously, aggressive offshore field development requires precise subsea pipeline trenching and offshore wind foundation preparation to anchor bottom-fixed offshore wind foundations. Securing subsea power export cables and subsea production templates lowers offshore grid failure risks by over 15%.
  • Additionally, urgent coastal wetland protection and barrier island restoration projects, alongside large-scale liquefaction terminal construction, guarantee a continuous, long-term pipeline of capital excavation contracts.

What are the market trends shaping the Dredger Industry?

  • The digitalization of marine excavation processes and the integration of autonomous operational technologies represent a critical structural trend. These advancements streamline project execution and optimize sediment removal efficiency across complex maritime environments.

  • The fundamental shift toward decarbonization and operational automation defines the current trajectory of marine infrastructure development. Fleet operators are rapidly transitioning from traditional diesel mechanics to liquefied natural gas propulsion and hydrogen fuel cells, fundamentally altering maritime supply chain resilience.
  • The integration of high-capacity electric batteries alongside advanced hydrodynamic hull designs and specialized anti-fouling coatings enables vessels to navigate with a 20% improvement in hydrodynamic efficiency compared to legacy models.
  • Because environmental regulations now penalize excessive emissions, maritime contractors deploy autonomous dredging vessels equipped with automated dredging control software and predictive maintenance tools to optimize extraction cycles and minimize human error.
  • Consequently, companies aligning with circular economy principles increasingly prioritize the beneficial use of dredge material for habitat restoration, transforming regulatory compliance constraints into lucrative operational advantages that secure long-term public infrastructure contracts and enhance overall project profitability.

What challenges does the Dredger Industry face during its growth?

  • Stringent environmental compliance mandates and rigorous ecological sustainability requirements present substantial operational challenges that elevate project costs and constrain extraction timelines.

  • Stringent ecological sustainability regulations and complex environmental compliance mandates impose substantial structural limitations on marine excavation projects. The critical necessity for benthic ecosystem preservation forces operators to strictly control sediment plume dispersal during extraction processes.
  • Because uncontrolled suspended sediment management degrades local aquatic habitats, regulatory bodies mandate the deployment of physical silt curtains and highly sensitive turbidity monitoring sensors, which can increase compliance-related project expenditures by up to 18%. Furthermore, the mandatory adherence to tier III emission standards and rigorous ballast water management protocols requires expensive vessel retrofitting.
  • Advanced morphological modeling and automated slurry density monitoring are essential for executing dynamic sand motor replenishments and complex subsea wellhead clearance without triggering environmental penalties. These stringent regulatory hurdles systematically delay operational timelines, reducing overall vessel utilization rates by nearly 12% across highly regulated maritime zones.

Exclusive Technavio Analysis on Customer Landscape

The dredger market forecasting report includes the adoption lifecycle of the market, covering from the innovator’s stage to the laggard’s stage. It focuses on adoption rates in different regions based on penetration. Furthermore, the dredger market report also includes key purchase criteria and drivers of price sensitivity to help companies evaluate and develop their market growth analysis strategies.
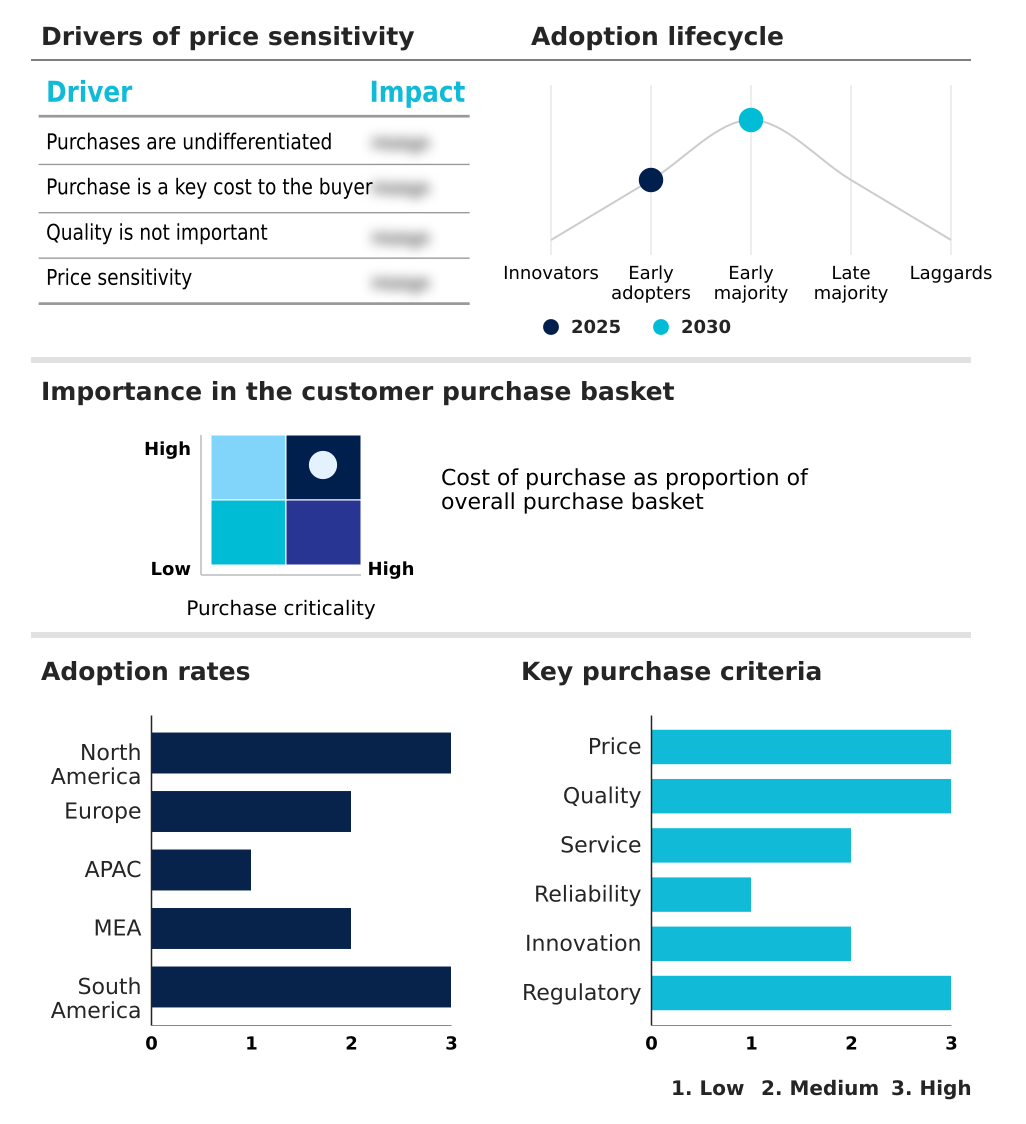
Customer Landscape of Dredger Industry

Competitive Landscape

Companies are implementing various strategies, such as strategic alliances, dredger market forecast, partnerships, mergers and acquisitions, geographical expansion, and product/service launches, to enhance their presence in the industry.

Bell Dredging Pumps B.V. - Advanced excavation solutions encompass heavy-duty slurry pumps, amphibious tracked excavators, modular suction vessels, and specialized seabed preparation tools engineered for demanding onshore and complex offshore marine environments.

The industry research and growth report includes detailed analyses of the competitive landscape of the market and information about key companies, including:

  • Bell Dredging Pumps B.V.
  • Bollinger Shipyards
  • Conrad Industries Inc.
  • Custom Dredge Works Inc.
  • Damen Shipyards Group
  • Dredge Yard B.V.
  • DSC Dredge LLC
  • Eastern Shipbuilding Inc.
  • EDDY Pump Corp
  • Ellicott Dredges LLC
  • Halimar Shipyard LLC
  • Holland Dredging Products B.V.
  • Holland MT B.V.
  • Italdraghe S.p.A.
  • ROHR IDRECO Dredge Systems
  • Royal IHC
  • Seatrium Ltd.
  • SRS Crisafulli Inc.
  • Supreme Manufacturing Inc.
  • VOSTA LMG

Qualitative and quantitative analysis of companies has been conducted to help clients understand the wider business environment as well as the strengths and weaknesses of key industry players. Data is qualitatively analyzed to categorize companies as pure play, category-focused, industry-focused, and diversified; it is quantitatively analyzed to categorize companies as dominant, leading, strong, tentative, and weak.

Recent Development and News in Dredger market

  • In the Marine Transportation industry, the transition toward mega-ships and ultra-large container vessels has required extensive harbor deepening, directly impacting Dredger demand by increasing the necessity for precision seabed excavation operations that improve navigational draft capacities by over 20%.
  • Stringent emission standards implemented by maritime regulatory bodies mandate significant reductions in nitrogen oxide output, compelling fleet operators to adopt advanced hull designs that improve fuel efficiency by up to 15% across marine extraction operations.
  • The expansion of offshore renewable energy networks requires extensive seabed preparation, driving demand for specialized marine equipment capable of stabilizing subsea power cables at depths exceeding 40 meters.
  • Growing investments in logistics resilience involve widespread coastal defense initiatives and storm surge mitigation projects, fueling the adoption of repurposed marine sediment to construct artificial barrier islands that enhance coastal protection efficiency by 30%.

Dive into Technavio’s robust research methodology, blending expert interviews, extensive data synthesis, and validated models for unparalleled Dredger Market insights. See full methodology.

Market Scope
Page number 304
Base year 2025
Historic period 2020-2024
Forecast period 2026-2030
Growth momentum & CAGR Accelerate at a CAGR of 3.9%
Market growth 2026-2030 USD 562.7 million
Market structure Fragmented
YoY growth 2025-2026(%) 3.8%
Key countries US, Canada, Mexico, The Netherlands, Belgium, UK, Germany, France, Italy, China, Japan, India, South Korea, Australia, Indonesia, UAE, Saudi Arabia, Egypt, South Africa, Turkey, Brazil, Argentina and Chile
Competitive landscape Leading Companies, Market Positioning of Companies, Competitive Strategies, and Industry Risks

Request Free Sample

Research Analyst Overview

  • The marine excavation industry requires continuous operational optimization to balance aggressive capital infrastructure development with stringent ecological preservation mandates. Boardroom-level procurement strategies increasingly prioritize the integration of automated software platforms, which allow fleet operators to dynamically adjust extraction parameters in real-time.
  • This technological shift directly influences corporate budgeting by lowering fuel consumption and minimizing unnecessary mechanical wear, resulting in a 25% reduction in unplanned vessel downtime during complex underwater operations. Furthermore, the rapid expansion of renewable energy infrastructure necessitates precise seabed preparation for offshore foundation structures, compelling contractors to upgrade their hydrographic surveying capabilities.
  • Corporate compliance strategies heavily rely on advanced data modeling to predict sediment transport patterns, ensuring that large-scale barrier island restoration and coastal wetland protection initiatives meet strict regulatory environmental standards.
  • By prioritizing data-centric excavation technologies, marine engineering firms successfully mitigate project risk, accelerate completion schedules, and maintain robust profit margins while navigating the increasingly rigorous environmental frameworks governing international maritime construction and continuous waterway maintenance.

What are the Key Data Covered in this Dredger Market Research and Growth Report?

  • What is the expected growth of the Dredger Market between 2026 and 2030?

    • USD 562.7 million, at a CAGR of 3.9%

  • What segmentation does the market report cover?

    • The report is segmented by Type (Hydraulic dredgers, Mechanical dredgers, and Others), Application (Maintenance, and Construction), End-user (Oil and gas, Mining, Renewable energy, Government and municipal bodies, and Others) and Geography (North America, Europe, APAC, Middle East and Africa, South America)

  • Which regions are analyzed in the report?

    • North America, Europe, APAC, Middle East and Africa and South America

  • What are the key growth drivers and market challenges?

    • Expansion of international maritime trade and port infrastructure enhancement, Environmental compliance and ecological sustainability requirements

  • Who are the major players in the Dredger Market?

    • Bell Dredging Pumps B.V., Bollinger Shipyards, Conrad Industries Inc., Custom Dredge Works Inc., Damen Shipyards Group, Dredge Yard B.V., DSC Dredge LLC, Eastern Shipbuilding Inc., EDDY Pump Corp, Ellicott Dredges LLC, Halimar Shipyard LLC, Holland Dredging Products B.V., Holland MT B.V., Italdraghe S.p.A., ROHR IDRECO Dredge Systems, Royal IHC, Seatrium Ltd., SRS Crisafulli Inc., Supreme Manufacturing Inc. and VOSTA LMG

Market Research Insights

  • The Dredger Market undergoes continuous transformation driven by the necessity for advanced maritime infrastructure and rigorous environmental stewardship. Effective suspended sediment extraction during capital deepening projects has enabled operators to decrease local ecosystem disruption by 25%, ensuring strict regulatory compliance.
  • The implementation of automated ballast water treatment protocols further reduces invasive species transfer risks, cutting environmental penalty incidents by nearly 18% across major transit hubs. In offshore energy sectors, precision excavation techniques utilized for seabed leveling improve pipeline installation efficiency by 30% when navigating complex geologies.
  • These strategic operational enhancements empower marine contractors to accelerate project delivery timelines while significantly lowering fuel consumption and minimizing overall ecological footprints in sensitive coastal environments.

We can help! Our analysts can customize this dredger market research report to meet your requirements.

Get in touch

1. Executive Summary

1.1 Market overview

Executive Summary - Chart on Market Overview
Executive Summary - Data Table on Market Overview
Executive Summary - Chart on Global Market Characteristics
Executive Summary - Chart on Market by Geography
Executive Summary - Chart on Market Segmentation by Type
Executive Summary - Chart on Market Segmentation by Application
Executive Summary - Chart on Market Segmentation by End-user
Executive Summary - Chart on Incremental Growth
Executive Summary - Data Table on Incremental Growth
Executive Summary - Chart on Company Market Positioning

2. Technavio Analysis

2.1 Analysis of price sensitivity, lifecycle, customer purchase basket, adoption rates, and purchase criteria

2.2 Criticality of inputs and Factors of differentiation

Chart on Overview on criticality of inputs and factors of differentiation

2.3 Factors of disruption

Chart on Overview on factors of disruption

2.4 Impact of drivers and challenges

Chart on Impact of drivers and challenges in 2025 and 2030

3. Market Landscape

3.1 Market ecosystem

Chart on Parent Market
Data Table on - Parent Market

3.2 Market characteristics

Chart on Market characteristics analysis

3.3 Value chain analysis

Chart on Value chain analysis

4. Market Sizing

4.1 Market definition

Data Table on Offerings of companies included in the market definition

4.2 Market segment analysis

Market segments

4.3 Market size 2025

4.4 Market outlook: Forecast for 2025-2030

Chart on Global - Market size and forecast 2025-2030 ($ million)
Data Table on Global - Market size and forecast 2025-2030 ($ million)
Chart on Global Market: Year-over-year growth 2025-2030 (%)
Data Table on Global Market: Year-over-year growth 2025-2030 (%)

5. Historic Market Size

5.1 Global Dredger Market 2020 - 2024

Historic Market Size - Data Table on Global Dredger Market 2020 - 2024 ($ million)

5.2 Type segment analysis 2020 - 2024

Historic Market Size - Type Segment 2020 - 2024 ($ million)

5.3 Application segment analysis 2020 - 2024

Historic Market Size - Application Segment 2020 - 2024 ($ million)

5.4 End-user segment analysis 2020 - 2024

Historic Market Size - End-user Segment 2020 - 2024 ($ million)

5.5 Geography segment analysis 2020 - 2024

Historic Market Size - Geography Segment 2020 - 2024 ($ million)

5.6 Country segment analysis 2020 - 2024

Historic Market Size - Country Segment 2020 - 2024 ($ million)

6. Qualitative Analysis

6.1 Impact of AI on Global Dredger Market

6.2 Impact of Geopolitical Conflicts on Global Dredger Market

7. Five Forces Analysis

7.1 Five forces summary

Five forces analysis - Comparison between 2025 and 2030

7.2 Bargaining power of buyers

Bargaining power of buyers - Impact of key factors 2025 and 2030

7.3 Bargaining power of suppliers

Bargaining power of suppliers - Impact of key factors in 2025 and 2030

7.4 Threat of new entrants

Threat of new entrants - Impact of key factors in 2025 and 2030

7.5 Threat of substitutes

Threat of substitutes - Impact of key factors in 2025 and 2030

7.6 Threat of rivalry

Threat of rivalry - Impact of key factors in 2025 and 2030

7.7 Market condition

Chart on Market condition - Five forces 2025 and 2030

8. Market Segmentation by Type

8.1 Market segments

Chart on Type - Market share 2025-2030 (%)
Data Table on Type - Market share 2025-2030 (%)

8.2 Comparison by Type

Chart on Comparison by Type
Data Table on Comparison by Type

8.3 Hydraulic dredgers - Market size and forecast 2025-2030

Chart on Hydraulic dredgers - Market size and forecast 2025-2030 ($ million)
Data Table on Hydraulic dredgers - Market size and forecast 2025-2030 ($ million)
Chart on Hydraulic dredgers - Year-over-year growth 2025-2030 (%)
Data Table on Hydraulic dredgers - Year-over-year growth 2025-2030 (%)

8.4 Mechanical dredgers - Market size and forecast 2025-2030

Chart on Mechanical dredgers - Market size and forecast 2025-2030 ($ million)
Data Table on Mechanical dredgers - Market size and forecast 2025-2030 ($ million)
Chart on Mechanical dredgers - Year-over-year growth 2025-2030 (%)
Data Table on Mechanical dredgers - Year-over-year growth 2025-2030 (%)

8.5 Others - Market size and forecast 2025-2030

Chart on Others - Market size and forecast 2025-2030 ($ million)
Data Table on Others - Market size and forecast 2025-2030 ($ million)
Chart on Others - Year-over-year growth 2025-2030 (%)
Data Table on Others - Year-over-year growth 2025-2030 (%)

8.6 Market opportunity by Type

Market opportunity by Type ($ million)
Data Table on Market opportunity by Type ($ million)

9. Market Segmentation by Application

9.1 Market segments

Chart on Application - Market share 2025-2030 (%)
Data Table on Application - Market share 2025-2030 (%)

9.2 Comparison by Application

Chart on Comparison by Application
Data Table on Comparison by Application

9.3 Maintenance - Market size and forecast 2025-2030

Chart on Maintenance - Market size and forecast 2025-2030 ($ million)
Data Table on Maintenance - Market size and forecast 2025-2030 ($ million)
Chart on Maintenance - Year-over-year growth 2025-2030 (%)
Data Table on Maintenance - Year-over-year growth 2025-2030 (%)

9.4 Construction - Market size and forecast 2025-2030

Chart on Construction - Market size and forecast 2025-2030 ($ million)
Data Table on Construction - Market size and forecast 2025-2030 ($ million)
Chart on Construction - Year-over-year growth 2025-2030 (%)
Data Table on Construction - Year-over-year growth 2025-2030 (%)

9.5 Market opportunity by Application

Market opportunity by Application ($ million)
Data Table on Market opportunity by Application ($ million)

10. Market Segmentation by End-user

10.1 Market segments

Chart on End-user - Market share 2025-2030 (%)
Data Table on End-user - Market share 2025-2030 (%)

10.2 Comparison by End-user

Chart on Comparison by End-user
Data Table on Comparison by End-user

10.3 Oil and gas - Market size and forecast 2025-2030

Chart on Oil and gas - Market size and forecast 2025-2030 ($ million)
Data Table on Oil and gas - Market size and forecast 2025-2030 ($ million)
Chart on Oil and gas - Year-over-year growth 2025-2030 (%)
Data Table on Oil and gas - Year-over-year growth 2025-2030 (%)

10.4 Mining - Market size and forecast 2025-2030

Chart on Mining - Market size and forecast 2025-2030 ($ million)
Data Table on Mining - Market size and forecast 2025-2030 ($ million)
Chart on Mining - Year-over-year growth 2025-2030 (%)
Data Table on Mining - Year-over-year growth 2025-2030 (%)

10.5 Renewable energy - Market size and forecast 2025-2030

Chart on Renewable energy - Market size and forecast 2025-2030 ($ million)
Data Table on Renewable energy - Market size and forecast 2025-2030 ($ million)
Chart on Renewable energy - Year-over-year growth 2025-2030 (%)
Data Table on Renewable energy - Year-over-year growth 2025-2030 (%)

10.6 Government and municipal bodies - Market size and forecast 2025-2030

Chart on Government and municipal bodies - Market size and forecast 2025-2030 ($ million)
Data Table on Government and municipal bodies - Market size and forecast 2025-2030 ($ million)
Chart on Government and municipal bodies - Year-over-year growth 2025-2030 (%)
Data Table on Government and municipal bodies - Year-over-year growth 2025-2030 (%)

10.7 Others - Market size and forecast 2025-2030

Chart on Others - Market size and forecast 2025-2030 ($ million)
Data Table on Others - Market size and forecast 2025-2030 ($ million)
Chart on Others - Year-over-year growth 2025-2030 (%)
Data Table on Others - Year-over-year growth 2025-2030 (%)

10.8 Market opportunity by End-user

Market opportunity by End-user ($ million)
Data Table on Market opportunity by End-user ($ million)

11. Customer Landscape

11.1 Customer landscape overview

Analysis of price sensitivity, lifecycle, customer purchase basket, adoption rates, and purchase criteria

12. Geographic Landscape

12.1 Geographic segmentation

Chart on Market share by geography 2025-2030 (%)
Data Table on Market share by geography 2025-2030 (%)

12.2 Geographic comparison

Chart on Geographic comparison
Data Table on Geographic comparison

12.3 North America - Market size and forecast 2025-2030

Chart on North America - Market size and forecast 2025-2030 ($ million)
Data Table on North America - Market size and forecast 2025-2030 ($ million)
Chart on North America - Year-over-year growth 2025-2030 (%)
Data Table on North America - Year-over-year growth 2025-2030 (%)
Chart on Regional Comparison - North America
Data Table on Regional Comparison - North America

12.3.1 US - Market size and forecast 2025-2030

Chart on US - Market size and forecast 2025-2030 ($ million)
Data Table on US - Market size and forecast 2025-2030 ($ million)
Chart on US - Year-over-year growth 2025-2030 (%)
Data Table on US - Year-over-year growth 2025-2030 (%)

12.3.2 Canada - Market size and forecast 2025-2030

Chart on Canada - Market size and forecast 2025-2030 ($ million)
Data Table on Canada - Market size and forecast 2025-2030 ($ million)
Chart on Canada - Year-over-year growth 2025-2030 (%)
Data Table on Canada - Year-over-year growth 2025-2030 (%)

12.3.3 Mexico - Market size and forecast 2025-2030

Chart on Mexico - Market size and forecast 2025-2030 ($ million)
Data Table on Mexico - Market size and forecast 2025-2030 ($ million)
Chart on Mexico - Year-over-year growth 2025-2030 (%)
Data Table on Mexico - Year-over-year growth 2025-2030 (%)

12.4 Europe - Market size and forecast 2025-2030

Chart on Europe - Market size and forecast 2025-2030 ($ million)
Data Table on Europe - Market size and forecast 2025-2030 ($ million)
Chart on Europe - Year-over-year growth 2025-2030 (%)
Data Table on Europe - Year-over-year growth 2025-2030 (%)
Chart on Regional Comparison - Europe
Data Table on Regional Comparison - Europe

12.4.1 The Netherlands - Market size and forecast 2025-2030

Chart on The Netherlands - Market size and forecast 2025-2030 ($ million)
Data Table on The Netherlands - Market size and forecast 2025-2030 ($ million)
Chart on The Netherlands - Year-over-year growth 2025-2030 (%)
Data Table on The Netherlands - Year-over-year growth 2025-2030 (%)

12.4.2 Belgium - Market size and forecast 2025-2030

Chart on Belgium - Market size and forecast 2025-2030 ($ million)
Data Table on Belgium - Market size and forecast 2025-2030 ($ million)
Chart on Belgium - Year-over-year growth 2025-2030 (%)
Data Table on Belgium - Year-over-year growth 2025-2030 (%)

12.4.3 UK - Market size and forecast 2025-2030

Chart on UK - Market size and forecast 2025-2030 ($ million)
Data Table on UK - Market size and forecast 2025-2030 ($ million)
Chart on UK - Year-over-year growth 2025-2030 (%)
Data Table on UK - Year-over-year growth 2025-2030 (%)

12.4.4 Germany - Market size and forecast 2025-2030

Chart on Germany - Market size and forecast 2025-2030 ($ million)
Data Table on Germany - Market size and forecast 2025-2030 ($ million)
Chart on Germany - Year-over-year growth 2025-2030 (%)
Data Table on Germany - Year-over-year growth 2025-2030 (%)

12.4.5 France - Market size and forecast 2025-2030

Chart on France - Market size and forecast 2025-2030 ($ million)
Data Table on France - Market size and forecast 2025-2030 ($ million)
Chart on France - Year-over-year growth 2025-2030 (%)
Data Table on France - Year-over-year growth 2025-2030 (%)

12.4.6 Italy - Market size and forecast 2025-2030

Chart on Italy - Market size and forecast 2025-2030 ($ million)
Data Table on Italy - Market size and forecast 2025-2030 ($ million)
Chart on Italy - Year-over-year growth 2025-2030 (%)
Data Table on Italy - Year-over-year growth 2025-2030 (%)

12.5 APAC - Market size and forecast 2025-2030

Chart on APAC - Market size and forecast 2025-2030 ($ million)
Data Table on APAC - Market size and forecast 2025-2030 ($ million)
Chart on APAC - Year-over-year growth 2025-2030 (%)
Data Table on APAC - Year-over-year growth 2025-2030 (%)
Chart on Regional Comparison - APAC
Data Table on Regional Comparison - APAC

12.5.1 China - Market size and forecast 2025-2030

Chart on China - Market size and forecast 2025-2030 ($ million)
Data Table on China - Market size and forecast 2025-2030 ($ million)
Chart on China - Year-over-year growth 2025-2030 (%)
Data Table on China - Year-over-year growth 2025-2030 (%)

12.5.2 Japan - Market size and forecast 2025-2030

Chart on Japan - Market size and forecast 2025-2030 ($ million)
Data Table on Japan - Market size and forecast 2025-2030 ($ million)
Chart on Japan - Year-over-year growth 2025-2030 (%)
Data Table on Japan - Year-over-year growth 2025-2030 (%)

12.5.3 India - Market size and forecast 2025-2030

Chart on India - Market size and forecast 2025-2030 ($ million)
Data Table on India - Market size and forecast 2025-2030 ($ million)
Chart on India - Year-over-year growth 2025-2030 (%)
Data Table on India - Year-over-year growth 2025-2030 (%)

12.5.4 South Korea - Market size and forecast 2025-2030

Chart on South Korea - Market size and forecast 2025-2030 ($ million)
Data Table on South Korea - Market size and forecast 2025-2030 ($ million)
Chart on South Korea - Year-over-year growth 2025-2030 (%)
Data Table on South Korea - Year-over-year growth 2025-2030 (%)

12.5.5 Australia - Market size and forecast 2025-2030

Chart on Australia - Market size and forecast 2025-2030 ($ million)
Data Table on Australia - Market size and forecast 2025-2030 ($ million)
Chart on Australia - Year-over-year growth 2025-2030 (%)
Data Table on Australia - Year-over-year growth 2025-2030 (%)

12.5.6 Indonesia - Market size and forecast 2025-2030

Chart on Indonesia - Market size and forecast 2025-2030 ($ million)
Data Table on Indonesia - Market size and forecast 2025-2030 ($ million)
Chart on Indonesia - Year-over-year growth 2025-2030 (%)
Data Table on Indonesia - Year-over-year growth 2025-2030 (%)

12.6 Middle East and Africa - Market size and forecast 2025-2030

Chart on Middle East and Africa - Market size and forecast 2025-2030 ($ million)
Data Table on Middle East and Africa - Market size and forecast 2025-2030 ($ million)
Chart on Middle East and Africa - Year-over-year growth 2025-2030 (%)
Data Table on Middle East and Africa - Year-over-year growth 2025-2030 (%)
Chart on Regional Comparison - Middle East and Africa
Data Table on Regional Comparison - Middle East and Africa

12.6.1 UAE - Market size and forecast 2025-2030

Chart on UAE - Market size and forecast 2025-2030 ($ million)
Data Table on UAE - Market size and forecast 2025-2030 ($ million)
Chart on UAE - Year-over-year growth 2025-2030 (%)
Data Table on UAE - Year-over-year growth 2025-2030 (%)

12.6.2 Saudi Arabia - Market size and forecast 2025-2030

Chart on Saudi Arabia - Market size and forecast 2025-2030 ($ million)
Data Table on Saudi Arabia - Market size and forecast 2025-2030 ($ million)
Chart on Saudi Arabia - Year-over-year growth 2025-2030 (%)
Data Table on Saudi Arabia - Year-over-year growth 2025-2030 (%)

12.6.3 Egypt - Market size and forecast 2025-2030

Chart on Egypt - Market size and forecast 2025-2030 ($ million)
Data Table on Egypt - Market size and forecast 2025-2030 ($ million)
Chart on Egypt - Year-over-year growth 2025-2030 (%)
Data Table on Egypt - Year-over-year growth 2025-2030 (%)

12.6.4 South Africa - Market size and forecast 2025-2030

Chart on South Africa - Market size and forecast 2025-2030 ($ million)
Data Table on South Africa - Market size and forecast 2025-2030 ($ million)
Chart on South Africa - Year-over-year growth 2025-2030 (%)
Data Table on South Africa - Year-over-year growth 2025-2030 (%)

12.6.5 Turkey - Market size and forecast 2025-2030

Chart on Turkey - Market size and forecast 2025-2030 ($ million)
Data Table on Turkey - Market size and forecast 2025-2030 ($ million)
Chart on Turkey - Year-over-year growth 2025-2030 (%)
Data Table on Turkey - Year-over-year growth 2025-2030 (%)

12.7 South America - Market size and forecast 2025-2030

Chart on South America - Market size and forecast 2025-2030 ($ million)
Data Table on South America - Market size and forecast 2025-2030 ($ million)
Chart on South America - Year-over-year growth 2025-2030 (%)
Data Table on South America - Year-over-year growth 2025-2030 (%)
Chart on Regional Comparison - South America
Data Table on Regional Comparison - South America

12.7.1 Brazil - Market size and forecast 2025-2030

Chart on Brazil - Market size and forecast 2025-2030 ($ million)
Data Table on Brazil - Market size and forecast 2025-2030 ($ million)
Chart on Brazil - Year-over-year growth 2025-2030 (%)
Data Table on Brazil - Year-over-year growth 2025-2030 (%)

12.7.2 Argentina - Market size and forecast 2025-2030

Chart on Argentina - Market size and forecast 2025-2030 ($ million)
Data Table on Argentina - Market size and forecast 2025-2030 ($ million)
Chart on Argentina - Year-over-year growth 2025-2030 (%)
Data Table on Argentina - Year-over-year growth 2025-2030 (%)

12.7.3 Chile - Market size and forecast 2025-2030

Chart on Chile - Market size and forecast 2025-2030 ($ million)
Data Table on Chile - Market size and forecast 2025-2030 ($ million)
Chart on Chile - Year-over-year growth 2025-2030 (%)
Data Table on Chile - Year-over-year growth 2025-2030 (%)

12.8 Market opportunity by geography

Market opportunity by geography ($ million)
Data Tables on Market opportunity by geography ($ million)

13. Drivers, Challenges, and Opportunity

13.1 Market drivers

Expansion of international maritime trade and port infrastructure enhancement
Coastal protection and adaptation to global environmental shifts
Development of offshore energy infrastructure and renewable energy integration

13.2 Market challenges

Environmental compliance and ecological sustainability requirements
Substantial capital outlay and macroeconomic instability
Technical complexity and human capital deficits

13.3 Impact of drivers and challenges

Impact of drivers and challenges in 2025 and 2030

13.4 Market opportunities

Digitalization and integration of autonomous operational technologies
Implementation of green technology and decarbonization strategies
Adoption of circular economy principles and beneficial use of dredge material

14. Competitive Landscape

14.1 Overview

14.2

Overview on criticality of inputs and factors of differentiation

14.3 Landscape disruption

Overview on factors of disruption

14.4 Industry risks

Impact of key risks on business

15. Competitive Analysis

15.1 Companies profiled

Companies covered

15.2 Company ranking index

15.3 Market positioning of companies

Matrix on companies position and classification

15.4 Bollinger Shipyards

Bollinger Shipyards - Overview
Bollinger Shipyards - Product / Service
Bollinger Shipyards - Key offerings
SWOT

15.5 Conrad Industries Inc.

Conrad Industries Inc. - Overview
Conrad Industries Inc. - Business segments
Conrad Industries Inc. - Key offerings
Conrad Industries Inc. - Segment focus
SWOT

15.6 Damen Shipyards Group

Damen Shipyards Group - Overview
Damen Shipyards Group - Product / Service
Damen Shipyards Group - Key offerings
SWOT

15.7 DSC Dredge LLC

DSC Dredge LLC - Overview
DSC Dredge LLC - Product / Service
DSC Dredge LLC - Key offerings
SWOT

15.8 Eastern Shipbuilding Inc.

Eastern Shipbuilding Inc. - Overview
Eastern Shipbuilding Inc. - Product / Service
Eastern Shipbuilding Inc. - Key offerings
SWOT

15.9 EDDY Pump Corp

EDDY Pump Corp - Overview
EDDY Pump Corp - Product / Service
EDDY Pump Corp - Key offerings
SWOT

15.10 Ellicott Dredges LLC

Ellicott Dredges LLC - Overview
Ellicott Dredges LLC - Product / Service
Ellicott Dredges LLC - Key offerings
SWOT

15.11 Halimar Shipyard LLC

Halimar Shipyard LLC - Overview
Halimar Shipyard LLC - Product / Service
Halimar Shipyard LLC - Key offerings
SWOT

15.12 Holland MT B.V.

Holland MT B.V. - Overview
Holland MT B.V. - Product / Service
Holland MT B.V. - Key offerings
SWOT

15.13 ROHR IDRECO Dredge Systems

ROHR IDRECO Dredge Systems - Overview
ROHR IDRECO Dredge Systems - Product / Service
ROHR IDRECO Dredge Systems - Key offerings
SWOT

15.14 Royal IHC

Royal IHC - Overview
Royal IHC - Product / Service
Royal IHC - Key offerings
SWOT

15.15 Seatrium Ltd.

Seatrium Ltd. - Overview
Seatrium Ltd. - Business segments
Seatrium Ltd. - Key offerings
Seatrium Ltd. - Segment focus
SWOT

15.16 SRS Crisafulli Inc.

SRS Crisafulli Inc. - Overview
SRS Crisafulli Inc. - Product / Service
SRS Crisafulli Inc. - Key offerings
SWOT

15.17 Supreme Manufacturing Inc.

Supreme Manufacturing Inc. - Overview
Supreme Manufacturing Inc. - Product / Service
Supreme Manufacturing Inc. - Key offerings
SWOT

15.18 VOSTA LMG

VOSTA LMG - Overview
VOSTA LMG - Product / Service
VOSTA LMG - Key offerings
SWOT

16. Appendix

16.1 Scope of the report

Market definition
Objectives
Notes and caveats

16.2 Inclusions and exclusions checklist

Inclusions checklist
Exclusions checklist

16.3 Currency conversion rates for US$

16.4 Research methodology

16.5 Data procurement

Information sources

16.6 Data validation

16.7 Validation techniques employed for market sizing

16.8 Data synthesis

16.9 360 degree market analysis

16.10 List of abbreviations

Research Methodology

Technavio presents a detailed picture of the market by way of study, synthesis, and summation of data from multiple sources. The analysts have presented the various facets of the market with a particular focus on identifying the key industry influencers. The data thus presented is comprehensive, reliable, and the result of extensive research, both primary and secondary.

INFORMATION SOURCES

Primary sources

  • Manufacturers and suppliers
  • Channel partners
  • Industry experts
  • Strategic decision makers

Secondary sources

  • Industry journals and periodicals
  • Government data
  • Financial reports of key industry players
  • Historical data
  • Press releases

DATA ANALYSIS

Data Synthesis

  • Collation of data
  • Estimation of key figures
  • Analysis of derived insights

Data Validation

  • Triangulation with data models
  • Reference against proprietary databases
  • Corroboration with industry experts

REPORT WRITING

Qualitative

  • Market drivers
  • Market challenges
  • Market trends
  • Five forces analysis

Quantitative

  • Market size and forecast
  • Market segmentation
  • Geographical insights
  • Competitive landscape

Interested in this report?

Get your sample now to see our research methodology and insights!

Download Now

Frequently Asked Questions

Dredger market growth will increase by USD 562.7 million during 2026-2030.

The Dredger market is expected to grow at a CAGR of 3.9% during 2026-2030.

Dredger market is segmented by Type (Hydraulic dredgers, Mechanical dredgers, Others) Application (Maintenance, Construction) End-user (Oil and gas, Mining, Renewable energy, Government and municipal bodies, Others)

Bell Dredging Pumps B.V., Bollinger Shipyards, Conrad Industries Inc., Custom Dredge Works Inc., Damen Shipyards Group, Dredge Yard B.V., DSC Dredge LLC, Eastern Shipbuilding Inc., EDDY Pump Corp, Ellicott Dredges LLC, Halimar Shipyard LLC, Holland Dredging Products B.V., Holland MT B.V., Italdraghe S.p.A., ROHR IDRECO Dredge Systems, Royal IHC, Seatrium Ltd., SRS Crisafulli Inc., Supreme Manufacturing Inc., VOSTA LMG are a few of the key vendors in the Dredger market.

North America will register the highest growth rate of 29.4% among the other regions. Therefore, the Dredger market in North America is expected to garner significant business opportunities for the vendors during the forecast period.

US, Canada, Mexico, The Netherlands, Belgium, UK, Germany, France, Italy, China, Japan, India, South Korea, Australia, Indonesia, UAE, Saudi Arabia, Egypt, South Africa, Turkey, Brazil, Argentina, Chile

  • Expansion of international maritime trade and port infrastructure enhancement is the driving factor this market.

The Dredger market vendors should focus on grabbing business opportunities from the Type segment as it accounted for the largest market share in the base year.
RIA - Research AI Assistant
Ask RIA
