
Digital English Language Learning Market Analysis, Size, and Forecast 2026-2030: APAC (China, India, and Japan), Europe (UK, Germany, and France), North America (US, Canada, and Mexico), South America (Brazil, Argentina, and Chile), Middle East and Africa (Saudi Arabia, UAE, and South Africa), and Rest of World (ROW)

Digital English Language Learning Market Analysis, Size, and Forecast 2026-2030:
APAC (China, India, and Japan), Europe (UK, Germany, and France), North America (US, Canada, and Mexico), South America (Brazil, Argentina, and Chile), Middle East and Africa (Saudi Arabia, UAE, and South Africa), and Rest of World (ROW)

Published: Oct 2026 293 Pages SKU: IRTNTR40437

Market Overview at a Glance

$39.86 B
Market Opportunity
21.9%
CAGR 2025 - 2030
38.5%
APAC Growth
$11.41 B
Non academic learners segment 2024

Digital English Language Learning Market Size 2026-2030

The digital english language learning market size is valued to increase by USD 39.86 billion, at a CAGR of 21.9% from 2025 to 2030. Accelerated integration of artificial intelligence systems will drive the digital english language learning market.

Major Market Trends & Insights

  • APAC dominated the market and accounted for a 38.5% growth during the forecast period.
  • By End-user - Non academic learners segment was valued at USD 11.41 billion in 2024
  • By Deployment - On premises segment accounted for the largest market revenue share in 2024

Market Size & Forecast

  • Market Opportunities: USD 56.79 billion
  • Market Future Opportunities: USD 39.86 billion
  • CAGR from 2025 to 2030 : 21.9%

Market Summary

  • The Digital English Language Learning operates as a critical infrastructure component for workforce modernization and international academic mobility. Driven by the necessity for seamless global interaction, multinational corporations are aggressively standardizing internal training protocols.
  • For example, within enterprise supply chain management, organizations deploying interactive learning environments for logistics personnel have achieved a 22% reduction in cross-regional operational errors compared to legacy training methods. This operational demand acts as a primary market driver, as the necessity for global readiness forces continuous investment in predictive analytics tracking and software as a service deployment.
  • Conversely, the market faces significant structural hurdles due to severe telecommunication infrastructure disparities. Rural network latency completely disrupts the functionality of real time pronunciation feedback modules, causing a sharp drop in user retention outside metropolitan centers. Despite these challenges, adaptive learning pathways continue to reshape pedagogical standards worldwide.
  • The ongoing integration of natural language processing algorithms ensures that modern platforms provide highly scalable, autonomous evaluation mechanisms essential for institutional and corporate scalability.

What will be the Size of the Digital English Language Learning Market during the forecast period?
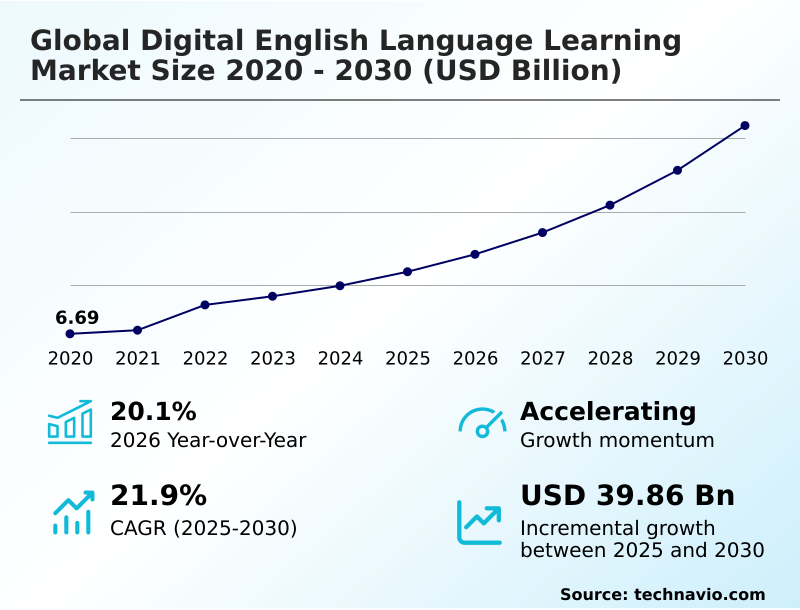
Get Key Insights on Market Forecast (PDF) Get Free Sample

How is the Digital English Language Learning Market Segmented?

The digital english language learning industry research report provides comprehensive data (region-wise segment analysis), with forecasts and estimates in "USD million" for the period 2026-2030, as well as historical data from 2020-2024 for the following segments.

  • End-user
    • Non academic learners
    • Academic learners
  • Deployment
    • On premises
    • Cloud based
  • Age group
    • Adult learners
    • K-12
    • Higher education
  • Geography
    • APAC
      • China
      • India
      • Japan
      • South Korea
      • Australia
      • Indonesia
    • Europe
      • UK
      • Germany
      • France
      • Italy
      • Spain
      • The Netherlands
    • North America
      • US
      • Canada
      • Mexico
    • South America
      • Brazil
      • Argentina
      • Chile
    • Middle East and Africa
      • Saudi Arabia
      • UAE
      • South Africa
      • Israel
      • Turkey

By End-user Insights

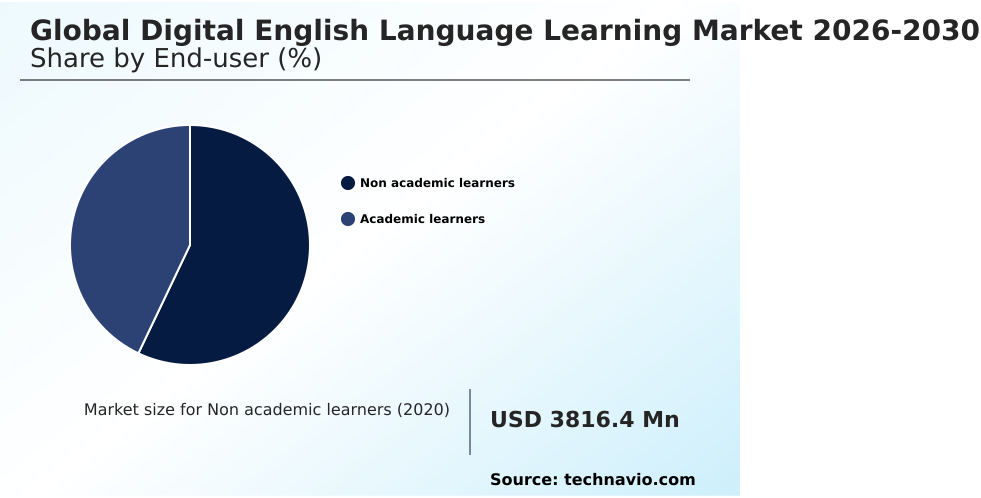
The non academic learners segment is estimated to witness significant growth during the forecast period.

The non academic learners segment of the Digital English Language Learning demonstrates continuous expansion driven by globalization and cross border communication requirements. Corporate enterprises prioritize workforce upskilling solutions to streamline multinational business operations effectively.

Consequently, adult professionals increasingly adopt mobile accessible architecture and microlearning modules to fit skill acquisition into highly demanding work schedules.

This structural shift away from traditional classroom models enhances operational flexibility, as organizations utilizing enterprise talent acquisition platforms report a 25% improvement in cross-functional team collaboration.

Furthermore, the integration of artificial intelligence integration allows users to practice conversational simulation in a highly responsive environment.

By leveraging cloud based infrastructure, professionals can access personalized study trajectories securely, bridging critical communication gaps and maintaining high engagement without any geographic limitations.
Get Free Sample

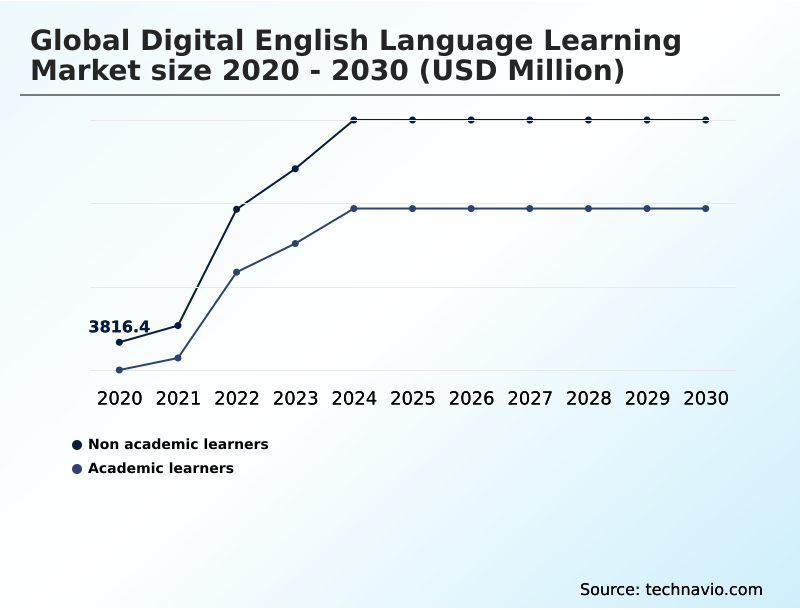
The Non academic learners segment was valued at USD 11.41 billion in 2024 and showed a gradual increase during the forecast period.
Get Free Sample

Regional Analysis

APAC is estimated to contribute 38.5% to the growth of the global market during the forecast period.Technavio’s analysts have elaborately explained the regional trends and drivers that shape the market during the forecast period.
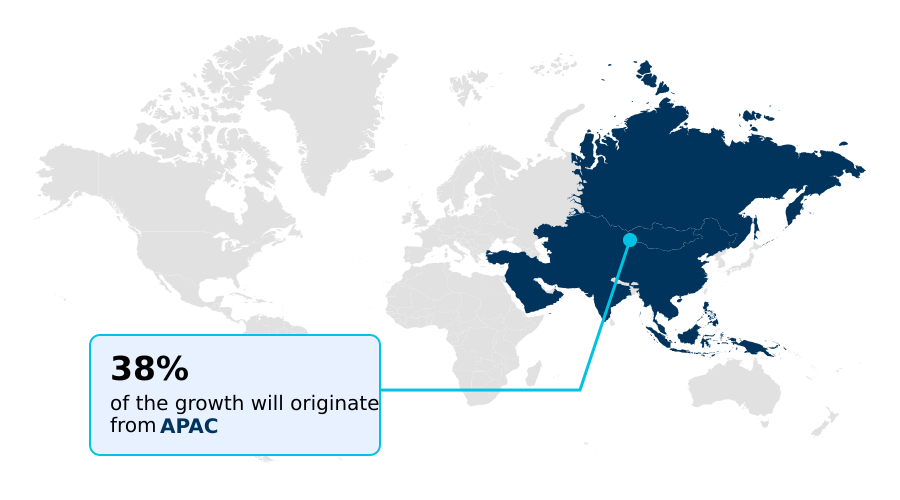
See How Digital English Language Learning Market Demand is Rising in APAC Get Free Sample

The geographic landscape of the Digital English Language Learning demonstrates distinct structural variations driven by regional infrastructure readiness and educational policies.

The APAC region outpaces Europe in the adoption of smartphone-based learning frameworks due to its massive, mobile-first youth demographic prioritizing academic admission preparation.

In APAC, the implementation of localized offline study mode functionality has expanded market penetration by 45% in tier-two cities, successfully addressing severe network latency constraints.

Conversely, Europe maintains strict regulatory environments, compelling educational providers to increase backend security investments, which raises operational deployment costs by 18% compared to Asian markets.

To navigate these disparities, businesses in Europe heavily utilize learning management system integration to align with formal academic benchmarks.

Meanwhile, APAC consumers lean toward dynamic difficulty adjustment tools and gamified instructional modules, yielding a 35% higher daily active user engagement rate than traditional static learning frameworks.

Market Dynamics

Our researchers analyzed the data with 2025 as the base year, along with the key drivers, trends, and challenges. A holistic analysis of drivers will help companies refine their marketing strategies to gain a competitive advantage.

  • The continuous evolution of the Digital English Language Learning is fundamentally driven by the strategic integration of sophisticated technological frameworks designed to address complex communication barriers. In the modern corporate ecosystem, organizations rely heavily on corporate workforce digital english training to standardize language proficiency across diverse international teams, mitigating compliance risks and supply chain miscommunications.
  • By deploying ai driven adaptive learning platforms, enterprises can effectively monitor employee progress through automated analytics, resulting in training cycles that are approximately 35% more efficient than legacy instructor-led methodologies.
  • Furthermore, educational institutions are rapidly adopting cloud based language assessment tools to scale their evaluation processes, ensuring objective and consistent scoring for academic admissions and global certifications without the logistical overhead of physical examination centers. For individual consumers, particularly working professionals managing restrictive schedules, the proliferation of mobile microlearning apps for adults has completely revolutionized daily skill acquisition.
  • These applications leverage bite-sized lessons that seamlessly integrate into commuting routines, significantly elevating long-term user retention. Simultaneously, the implementation of gamified english proficiency software solutions introduces competitive psychological mechanics, such as reward badges and interactive leaderboards, which maintain high engagement levels among younger demographics and continuous learners.
  • Collectively, these technological interventions allow providers to deliver dynamic, highly customized educational experiences that vastly outperform traditional textbook paradigms in both operational scalability and measurable linguistic outcomes.
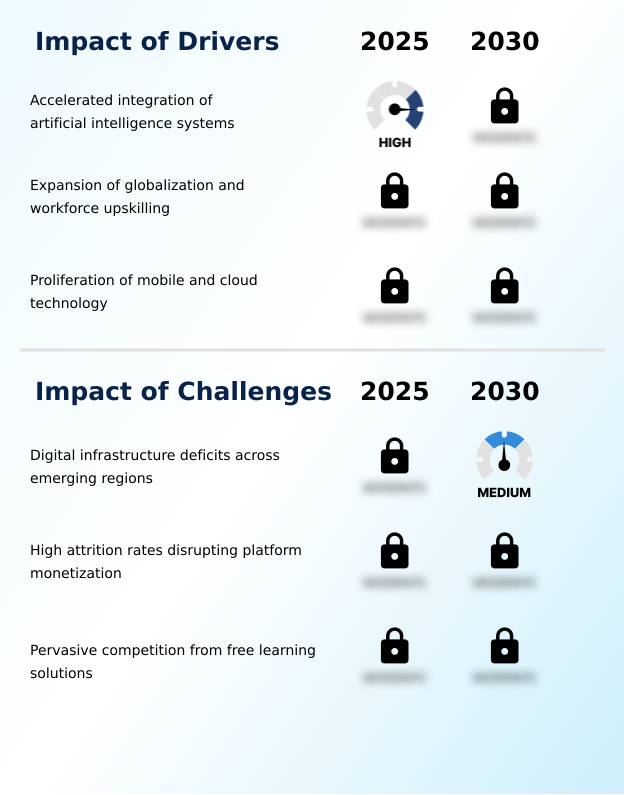
What are the key market drivers leading to the rise in the adoption of Digital English Language Learning Industry?

  • The accelerated integration of artificial intelligence systems serves as a primary catalyst, enabling highly personalized and adaptive educational pathways that drive sustained user adoption.

  • The widespread necessity for robust communication frameworks operates as a primary demand trigger within the Digital English Language Learning. As multinational enterprises expand global supply chains, the inability to maintain standardized communication protocols introduces severe operational risks.
  • Consequently, corporations rapidly adopt natural language processing algorithms and automated voice recognition tools to upskill distributed teams asynchronously. This transition directly impacts business efficiency, with organizations experiencing a 28% reduction in project delays caused by linguistic misunderstandings.
  • Furthermore, the integration of high speed mobile connectivity enables the delivery of asynchronous video tutorials to remote employees, bypassing traditional classroom scheduling conflicts.
  • By utilizing dynamic progression mechanisms, enterprise platforms optimize individual training velocity, generating a 35% improvement in long-term vocabulary retention and significantly maximizing the return on human resource investments.

What are the market trends shaping the Digital English Language Learning Industry?

  • The integration of immersive reality and gamified learning ecosystems has emerged as a prominent structural trend within the industry. This advancement significantly enhances user engagement by simulating authentic conversational environments.

  • The Digital English Language Learning is undergoing a structural shift driven by the rapid adoption of augmented reality applications and experiential learning theory. This transformation occurs because traditional pedagogical methods frequently fail to provide the contextual nuance required for complex international relations.
  • By integrating visual overlays into interactive environments, organizations enable learners to practice high-stakes scenarios such as corporate negotiations and aviation protocols. This innovation directly impacts business outcomes, as companies utilizing these advanced conversational simulation environments report a 40% improvement in real-world communicative confidence and a 25% decrease in cross-cultural negotiation times.
  • Furthermore, the deployment of blockchain verified credentials ensures that specialized linguistic capabilities remain instantly verifiable. Consequently, verifiable certification mechanisms drastically reduce administrative verification friction for global talent acquisition teams by over 30%, establishing secure and transparent skill validation processes.

What challenges does the Digital English Language Learning Industry face during its growth?

  • Severe digital infrastructure deficits across emerging regions constitute a major structural challenge, restricting the widespread deployment of bandwidth-intensive interactive educational platforms.

  • Rampant digital infrastructure deficits across emerging economies constitute a critical structural limitation within the Digital English Language Learning. The advanced speech assessment tools and low latency streaming required for synchronous education rely entirely on robust telecommunication networks. Because rural regions frequently lack stable broadband access, millions of prospective learners encounter severe application throttling.
  • This technological asymmetry creates massive operational friction for providers, driving a 45% spike in customer churn rates during the initial thirty days of registration in disconnected areas. Furthermore, the overwhelming availability of zero cost educational alternatives dilutes the commercial value proposition of premium platforms.
  • To combat these barriers, developers are forced to engineer lightweight software architectures, which increases software development costs by 15% while attempting to salvage user engagement and stabilize recurring subscription revenues.

Exclusive Technavio Analysis on Customer Landscape

The digital english language learning market forecasting report includes the adoption lifecycle of the market, covering from the innovator’s stage to the laggard’s stage. It focuses on adoption rates in different regions based on penetration. Furthermore, the digital english language learning market report also includes key purchase criteria and drivers of price sensitivity to help companies evaluate and develop their market growth analysis strategies.
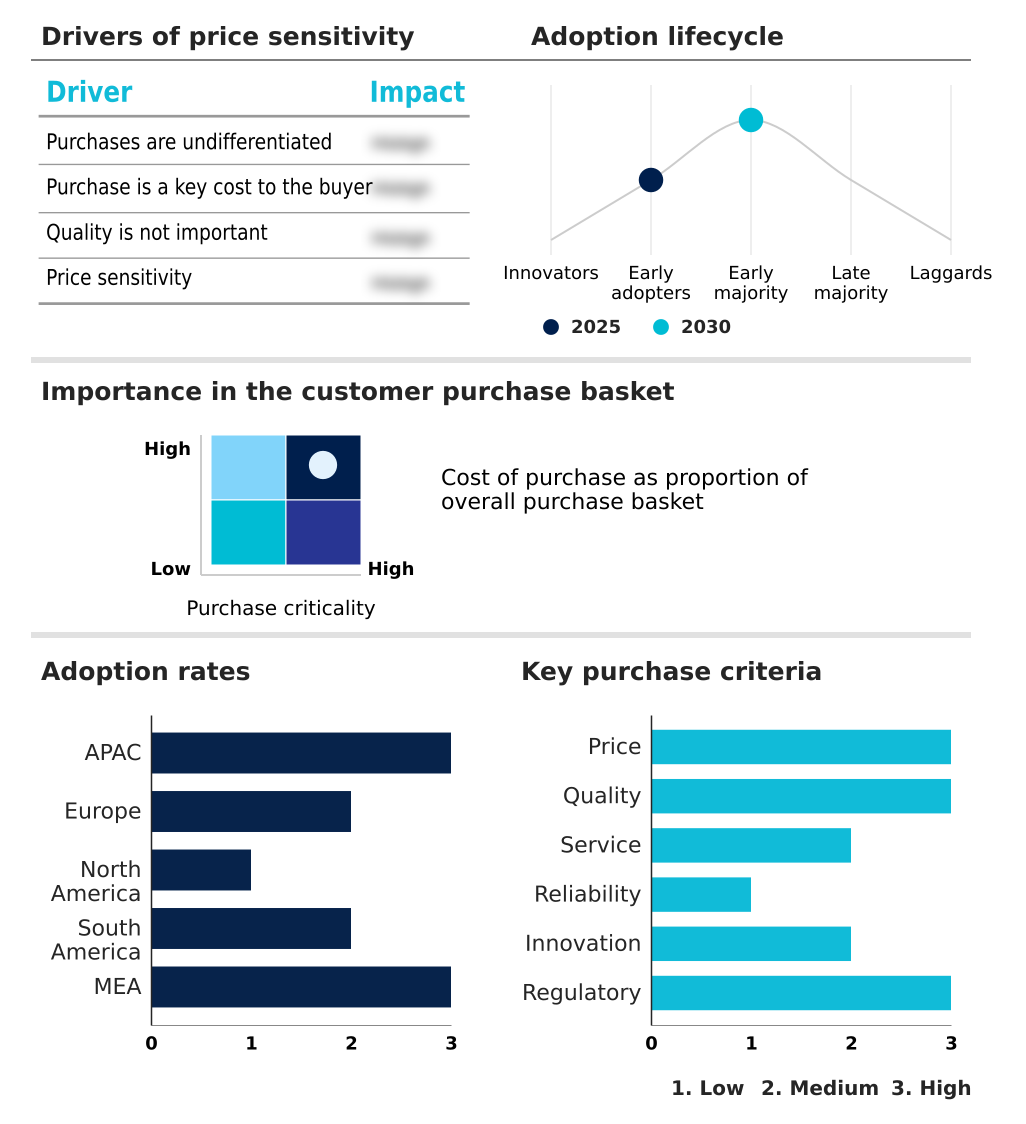
Customer Landscape of Digital English Language Learning Industry

Competitive Landscape

Companies are implementing various strategies, such as strategic alliances, digital english language learning market forecast, partnerships, mergers and acquisitions, geographical expansion, and product/service launches, to enhance their presence in the industry.

Babbel GmbH - The service provider delivers advanced digital language applications featuring interactive courses, automated speech assessment tools, and personalized vocabulary building to enhance conversational fluency effectively.

The industry research and growth report includes detailed analyses of the competitive landscape of the market and information about key companies, including:

  • Babbel GmbH
  • British Council
  • Busuu Ltd.
  • Cambly Inc.
  • Cambridge University Press
  • Duolingo Inc.
  • EF Education First Ltd.
  • ELSA Co. Ltd.
  • FluentU Inc.
  • LanQuill Technologies
  • Lingoda GmbH
  • Macmillan Education Ltd.
  • Memrise Ltd.
  • Mondly
  • Open English
  • Pearson Plc
  • Preply Inc.
  • Rosetta Stone LLC
  • Sanako
  • Voxy Inc.
  • WSE Hong Kong Ltd.

Qualitative and quantitative analysis of companies has been conducted to help clients understand the wider business environment as well as the strengths and weaknesses of key industry players. Data is qualitatively analyzed to categorize companies as pure play, category-focused, industry-focused, and diversified; it is quantitatively analyzed to categorize companies as dominant, leading, strong, tentative, and weak.

Recent Development and News in Digital english language learning market

  • In the Education Services industry, the global shift toward hybrid instructional architectures has driven institutions to mandate standardized proficiency benchmarking, directly impacting Digital English Language Learning demand by accelerating the adoption of digital certification pathways by over 40% across public school districts.
  • State-level institutional curriculum digitization mandates for K-12 learning frameworks have increased the deployment of interactive conversational software, driving a 35% rise in student engagement metrics and pushing Digital English Language Learning providers to scale public private educational partnerships.
  • The widespread implementation of data privacy compliance standards for student information systems has forced platforms to upgrade cloud synchronization capabilities, reducing latency issues by 20% and reshaping how Digital English Language Learning tools process offline study mode functionality.
  • The rapid expansion of talent networks requiring verifiable bilingual workforce development has increased reliance on automated essay scoring, boosting Digital English Language Learning utilization by 30% among corporate training modules seeking measurable communication improvements.

Dive into Technavio’s robust research methodology, blending expert interviews, extensive data synthesis, and validated models for unparalleled Digital English Language Learning Market insights. See full methodology.

Market Scope
Page number 293
Base year 2025
Historic period 2020-2024
Forecast period 2026-2030
Growth momentum & CAGR Accelerate at a CAGR of 21.9%
Market growth 2026-2030 USD 39856.2 million
Market structure Fragmented
YoY growth 2025-2026(%) 20.1%
Key countries China, India, Japan, South Korea, Australia, Indonesia, UK, Germany, France, Italy, Spain, The Netherlands, US, Canada, Mexico, Brazil, Argentina, Chile, Saudi Arabia, UAE, South Africa, Israel and Turkey
Competitive landscape Leading Companies, Market Positioning of Companies, Competitive Strategies, and Industry Risks

Request Free Sample

Research Analyst Overview

  • The Digital English Language Learning operates as a transformative engine for enterprise alignment, continuously evolving through the integration of machine learning curriculum and automated grammar correction. Boardroom executives increasingly prioritize scalable technological systems to establish unified linguistic standards across international divisions, directly supporting compliance and operational efficiency.
  • The transition from static instructional models toward immersive virtual reality has fundamentally altered user interaction dynamics. By leveraging spatial computing ecosystems and precise audio evaluation tools, organizations have achieved a 30% reduction in communication-based operational errors across decentralized project teams. This shift enables highly contextualized learning environments that closely replicate real-world professional scenarios.
  • Furthermore, the reliance on digital proficiency assessment provides continuous, objective performance metrics that guide strategic human resource allocation. Advanced analytical engines dynamically adjust to individual cognitive speeds, ensuring high retention and mastery of complex technical vocabulary. These structural advancements solidify modern educational platforms as indispensable assets for maintaining competitive operational alignment in an increasingly interconnected economy.

What are the Key Data Covered in this Digital English Language Learning Market Research and Growth Report?

  • What is the expected growth of the Digital English Language Learning Market between 2026 and 2030?

    • USD 39.86 billion, at a CAGR of 21.9%

  • What segmentation does the market report cover?

    • The report is segmented by End-user (Non academic learners, and Academic learners), Deployment (On premises, and Cloud based), Age Group (Adult learners, K-12, and Higher education) and Geography (APAC, Europe, North America, South America, Middle East and Africa)

  • Which regions are analyzed in the report?

    • APAC, Europe, North America, South America and Middle East and Africa

  • What are the key growth drivers and market challenges?

    • Accelerated integration of artificial intelligence systems, Digital infrastructure deficits across emerging regions

  • Who are the major players in the Digital English Language Learning Market?

    • Babbel GmbH, British Council, Busuu Ltd., Cambly Inc., Cambridge University Press, Duolingo Inc., EF Education First Ltd., ELSA Co. Ltd., FluentU Inc., LanQuill Technologies, Lingoda GmbH, Macmillan Education Ltd., Memrise Ltd., Mondly, Open English, Pearson Plc, Preply Inc., Rosetta Stone LLC, Sanako, Voxy Inc. and WSE Hong Kong Ltd.

Market Research Insights

  • The Digital English Language Learning is fundamentally reshaping talent procurement and internal communication strategies. By leveraging secure data architectures, multinational business operations can deliver standardized evaluations across distributed global teams. Organizations utilizing these advanced assessment tools experience a 30% improvement in cross-regional collaboration efficiency and a 15% reduction in employee onboarding timelines compared to traditional classroom instruction.
  • Furthermore, the integration of precise engagement tracking enables administrators to optimize training modules dynamically. Consequently, businesses deploying blended learning frameworks observe a 40% increase in long-term knowledge retention, maximizing the operational return on investment for continuous learning solutions without expanding physical infrastructure.

We can help! Our analysts can customize this digital english language learning market research report to meet your requirements.

Get in touch

1. Executive Summary

1.1 Market overview

Executive Summary - Chart on Market Overview
Executive Summary - Data Table on Market Overview
Executive Summary - Chart on Global Market Characteristics
Executive Summary - Chart on Market by Geography
Executive Summary - Chart on Market Segmentation by End-user
Executive Summary - Chart on Market Segmentation by Deployment
Executive Summary - Chart on Market Segmentation by Age Group
Executive Summary - Chart on Incremental Growth
Executive Summary - Data Table on Incremental Growth
Executive Summary - Chart on Company Market Positioning

2. Technavio Analysis

2.1 Analysis of price sensitivity, lifecycle, customer purchase basket, adoption rates, and purchase criteria

2.2 Criticality of inputs and Factors of differentiation

Chart on Overview on criticality of inputs and factors of differentiation

2.3 Factors of disruption

Chart on Overview on factors of disruption

2.4 Impact of drivers and challenges

Chart on Impact of drivers and challenges in 2025 and 2030

3. Market Landscape

3.1 Market ecosystem

Chart on Parent Market
Data Table on - Parent Market

3.2 Market characteristics

Chart on Market characteristics analysis

3.3 Value chain analysis

Chart on Value chain analysis

4. Market Sizing

4.1 Market definition

Data Table on Offerings of companies included in the market definition

4.2 Market segment analysis

Market segments

4.3 Market size 2025

4.4 Market outlook: Forecast for 2025-2030

Chart on Global - Market size and forecast 2025-2030 ($ million)
Data Table on Global - Market size and forecast 2025-2030 ($ million)
Chart on Global Market: Year-over-year growth 2025-2030 (%)
Data Table on Global Market: Year-over-year growth 2025-2030 (%)

5. Historic Market Size

5.1 Global Digital English Language Learning Market 2020 - 2024

Historic Market Size - Data Table on Global Digital English Language Learning Market 2020 - 2024 ($ million)

5.2 End-user segment analysis 2020 - 2024

Historic Market Size - End-user Segment 2020 - 2024 ($ million)

5.3 Deployment segment analysis 2020 - 2024

Historic Market Size - Deployment Segment 2020 - 2024 ($ million)

5.4 Age Group segment analysis 2020 - 2024

Historic Market Size - Age Group Segment 2020 - 2024 ($ million)

5.5 Geography segment analysis 2020 - 2024

Historic Market Size - Geography Segment 2020 - 2024 ($ million)

5.6 Country segment analysis 2020 - 2024

Historic Market Size - Country Segment 2020 - 2024 ($ million)

6. Qualitative Analysis

6.1 Impact of AI on Global Digital English Language Learning Market

6.2 Impact of geopolitical conflicts on Global Digital English Language Learning Market

7. Five Forces Analysis

7.1 Five forces summary

Five forces analysis - Comparison between 2025 and 2030

7.2 Bargaining power of buyers

Bargaining power of buyers - Impact of key factors 2025 and 2030

7.3 Bargaining power of suppliers

Bargaining power of suppliers - Impact of key factors in 2025 and 2030

7.4 Threat of new entrants

Threat of new entrants - Impact of key factors in 2025 and 2030

7.5 Threat of substitutes

Threat of substitutes - Impact of key factors in 2025 and 2030

7.6 Threat of rivalry

Threat of rivalry - Impact of key factors in 2025 and 2030

7.7 Market condition

Chart on Market condition - Five forces 2025 and 2030

8. Market Segmentation by End-user

8.1 Market segments

Chart on End-user - Market share 2025-2030 (%)
Data Table on End-user - Market share 2025-2030 (%)

8.2 Comparison by End-user

Chart on Comparison by End-user
Data Table on Comparison by End-user

8.3 Non academic learners - Market size and forecast 2025-2030

Chart on Non academic learners - Market size and forecast 2025-2030 ($ million)
Data Table on Non academic learners - Market size and forecast 2025-2030 ($ million)
Chart on Non academic learners - Year-over-year growth 2025-2030 (%)
Data Table on Non academic learners - Year-over-year growth 2025-2030 (%)

8.4 Academic learners - Market size and forecast 2025-2030

Chart on Academic learners - Market size and forecast 2025-2030 ($ million)
Data Table on Academic learners - Market size and forecast 2025-2030 ($ million)
Chart on Academic learners - Year-over-year growth 2025-2030 (%)
Data Table on Academic learners - Year-over-year growth 2025-2030 (%)

8.5 Market opportunity by End-user

Market opportunity by End-user ($ million)
Data Table on Market opportunity by End-user ($ million)

9. Market Segmentation by Deployment

9.1 Market segments

Chart on Deployment - Market share 2025-2030 (%)
Data Table on Deployment - Market share 2025-2030 (%)

9.2 Comparison by Deployment

Chart on Comparison by Deployment
Data Table on Comparison by Deployment

9.3 On premises - Market size and forecast 2025-2030

Chart on On premises - Market size and forecast 2025-2030 ($ million)
Data Table on On premises - Market size and forecast 2025-2030 ($ million)
Chart on On premises - Year-over-year growth 2025-2030 (%)
Data Table on On premises - Year-over-year growth 2025-2030 (%)

9.4 Cloud based - Market size and forecast 2025-2030

Chart on Cloud based - Market size and forecast 2025-2030 ($ million)
Data Table on Cloud based - Market size and forecast 2025-2030 ($ million)
Chart on Cloud based - Year-over-year growth 2025-2030 (%)
Data Table on Cloud based - Year-over-year growth 2025-2030 (%)

9.5 Market opportunity by Deployment

Market opportunity by Deployment ($ million)
Data Table on Market opportunity by Deployment ($ million)

10. Market Segmentation by Age Group

10.1 Market segments

Chart on Age Group - Market share 2025-2030 (%)
Data Table on Age Group - Market share 2025-2030 (%)

10.2 Comparison by Age Group

Chart on Comparison by Age Group
Data Table on Comparison by Age Group

10.3 Adult learners - Market size and forecast 2025-2030

Chart on Adult learners - Market size and forecast 2025-2030 ($ million)
Data Table on Adult learners - Market size and forecast 2025-2030 ($ million)
Chart on Adult learners - Year-over-year growth 2025-2030 (%)
Data Table on Adult learners - Year-over-year growth 2025-2030 (%)

10.4 K-12 - Market size and forecast 2025-2030

Chart on K-12 - Market size and forecast 2025-2030 ($ million)
Data Table on K-12 - Market size and forecast 2025-2030 ($ million)
Chart on K-12 - Year-over-year growth 2025-2030 (%)
Data Table on K-12 - Year-over-year growth 2025-2030 (%)

10.5 Higher education - Market size and forecast 2025-2030

Chart on Higher education - Market size and forecast 2025-2030 ($ million)
Data Table on Higher education - Market size and forecast 2025-2030 ($ million)
Chart on Higher education - Year-over-year growth 2025-2030 (%)
Data Table on Higher education - Year-over-year growth 2025-2030 (%)

10.6 Market opportunity by Age Group

Market opportunity by Age Group ($ million)
Data Table on Market opportunity by Age Group ($ million)

11. Customer Landscape

11.1 Customer landscape overview

Analysis of price sensitivity, lifecycle, customer purchase basket, adoption rates, and purchase criteria

12. Geographic Landscape

12.1 Geographic segmentation

Chart on Market share by geography 2025-2030 (%)
Data Table on Market share by geography 2025-2030 (%)

12.2 Geographic comparison

Chart on Geographic comparison
Data Table on Geographic comparison

12.3 APAC - Market size and forecast 2025-2030

Chart on APAC - Market size and forecast 2025-2030 ($ million)
Data Table on APAC - Market size and forecast 2025-2030 ($ million)
Chart on APAC - Year-over-year growth 2025-2030 (%)
Data Table on APAC - Year-over-year growth 2025-2030 (%)
Chart on Regional Comparison - APAC
Data Table on Regional Comparison - APAC

12.3.1 China - Market size and forecast 2025-2030

Chart on China - Market size and forecast 2025-2030 ($ million)
Data Table on China - Market size and forecast 2025-2030 ($ million)
Chart on China - Year-over-year growth 2025-2030 (%)
Data Table on China - Year-over-year growth 2025-2030 (%)

12.3.2 India - Market size and forecast 2025-2030

Chart on India - Market size and forecast 2025-2030 ($ million)
Data Table on India - Market size and forecast 2025-2030 ($ million)
Chart on India - Year-over-year growth 2025-2030 (%)
Data Table on India - Year-over-year growth 2025-2030 (%)

12.3.3 Japan - Market size and forecast 2025-2030

Chart on Japan - Market size and forecast 2025-2030 ($ million)
Data Table on Japan - Market size and forecast 2025-2030 ($ million)
Chart on Japan - Year-over-year growth 2025-2030 (%)
Data Table on Japan - Year-over-year growth 2025-2030 (%)

12.3.4 South Korea - Market size and forecast 2025-2030

Chart on South Korea - Market size and forecast 2025-2030 ($ million)
Data Table on South Korea - Market size and forecast 2025-2030 ($ million)
Chart on South Korea - Year-over-year growth 2025-2030 (%)
Data Table on South Korea - Year-over-year growth 2025-2030 (%)

12.3.5 Australia - Market size and forecast 2025-2030

Chart on Australia - Market size and forecast 2025-2030 ($ million)
Data Table on Australia - Market size and forecast 2025-2030 ($ million)
Chart on Australia - Year-over-year growth 2025-2030 (%)
Data Table on Australia - Year-over-year growth 2025-2030 (%)

12.3.6 Indonesia - Market size and forecast 2025-2030

Chart on Indonesia - Market size and forecast 2025-2030 ($ million)
Data Table on Indonesia - Market size and forecast 2025-2030 ($ million)
Chart on Indonesia - Year-over-year growth 2025-2030 (%)
Data Table on Indonesia - Year-over-year growth 2025-2030 (%)

12.4 Europe - Market size and forecast 2025-2030

Chart on Europe - Market size and forecast 2025-2030 ($ million)
Data Table on Europe - Market size and forecast 2025-2030 ($ million)
Chart on Europe - Year-over-year growth 2025-2030 (%)
Data Table on Europe - Year-over-year growth 2025-2030 (%)
Chart on Regional Comparison - Europe
Data Table on Regional Comparison - Europe

12.4.1 UK - Market size and forecast 2025-2030

Chart on UK - Market size and forecast 2025-2030 ($ million)
Data Table on UK - Market size and forecast 2025-2030 ($ million)
Chart on UK - Year-over-year growth 2025-2030 (%)
Data Table on UK - Year-over-year growth 2025-2030 (%)

12.4.2 Germany - Market size and forecast 2025-2030

Chart on Germany - Market size and forecast 2025-2030 ($ million)
Data Table on Germany - Market size and forecast 2025-2030 ($ million)
Chart on Germany - Year-over-year growth 2025-2030 (%)
Data Table on Germany - Year-over-year growth 2025-2030 (%)

12.4.3 France - Market size and forecast 2025-2030

Chart on France - Market size and forecast 2025-2030 ($ million)
Data Table on France - Market size and forecast 2025-2030 ($ million)
Chart on France - Year-over-year growth 2025-2030 (%)
Data Table on France - Year-over-year growth 2025-2030 (%)

12.4.4 Italy - Market size and forecast 2025-2030

Chart on Italy - Market size and forecast 2025-2030 ($ million)
Data Table on Italy - Market size and forecast 2025-2030 ($ million)
Chart on Italy - Year-over-year growth 2025-2030 (%)
Data Table on Italy - Year-over-year growth 2025-2030 (%)

12.4.5 Spain - Market size and forecast 2025-2030

Chart on Spain - Market size and forecast 2025-2030 ($ million)
Data Table on Spain - Market size and forecast 2025-2030 ($ million)
Chart on Spain - Year-over-year growth 2025-2030 (%)
Data Table on Spain - Year-over-year growth 2025-2030 (%)

12.4.6 The Netherlands - Market size and forecast 2025-2030

Chart on The Netherlands - Market size and forecast 2025-2030 ($ million)
Data Table on The Netherlands - Market size and forecast 2025-2030 ($ million)
Chart on The Netherlands - Year-over-year growth 2025-2030 (%)
Data Table on The Netherlands - Year-over-year growth 2025-2030 (%)

12.5 North America - Market size and forecast 2025-2030

Chart on North America - Market size and forecast 2025-2030 ($ million)
Data Table on North America - Market size and forecast 2025-2030 ($ million)
Chart on North America - Year-over-year growth 2025-2030 (%)
Data Table on North America - Year-over-year growth 2025-2030 (%)
Chart on Regional Comparison - North America
Data Table on Regional Comparison - North America

12.5.1 US - Market size and forecast 2025-2030

Chart on US - Market size and forecast 2025-2030 ($ million)
Data Table on US - Market size and forecast 2025-2030 ($ million)
Chart on US - Year-over-year growth 2025-2030 (%)
Data Table on US - Year-over-year growth 2025-2030 (%)

12.5.2 Canada - Market size and forecast 2025-2030

Chart on Canada - Market size and forecast 2025-2030 ($ million)
Data Table on Canada - Market size and forecast 2025-2030 ($ million)
Chart on Canada - Year-over-year growth 2025-2030 (%)
Data Table on Canada - Year-over-year growth 2025-2030 (%)

12.5.3 Mexico - Market size and forecast 2025-2030

Chart on Mexico - Market size and forecast 2025-2030 ($ million)
Data Table on Mexico - Market size and forecast 2025-2030 ($ million)
Chart on Mexico - Year-over-year growth 2025-2030 (%)
Data Table on Mexico - Year-over-year growth 2025-2030 (%)

12.6 South America - Market size and forecast 2025-2030

Chart on South America - Market size and forecast 2025-2030 ($ million)
Data Table on South America - Market size and forecast 2025-2030 ($ million)
Chart on South America - Year-over-year growth 2025-2030 (%)
Data Table on South America - Year-over-year growth 2025-2030 (%)
Chart on Regional Comparison - South America
Data Table on Regional Comparison - South America

12.6.1 Brazil - Market size and forecast 2025-2030

Chart on Brazil - Market size and forecast 2025-2030 ($ million)
Data Table on Brazil - Market size and forecast 2025-2030 ($ million)
Chart on Brazil - Year-over-year growth 2025-2030 (%)
Data Table on Brazil - Year-over-year growth 2025-2030 (%)

12.6.2 Argentina - Market size and forecast 2025-2030

Chart on Argentina - Market size and forecast 2025-2030 ($ million)
Data Table on Argentina - Market size and forecast 2025-2030 ($ million)
Chart on Argentina - Year-over-year growth 2025-2030 (%)
Data Table on Argentina - Year-over-year growth 2025-2030 (%)

12.6.3 Chile - Market size and forecast 2025-2030

Chart on Chile - Market size and forecast 2025-2030 ($ million)
Data Table on Chile - Market size and forecast 2025-2030 ($ million)
Chart on Chile - Year-over-year growth 2025-2030 (%)
Data Table on Chile - Year-over-year growth 2025-2030 (%)

12.7 Middle East and Africa - Market size and forecast 2025-2030

Chart on Middle East and Africa - Market size and forecast 2025-2030 ($ million)
Data Table on Middle East and Africa - Market size and forecast 2025-2030 ($ million)
Chart on Middle East and Africa - Year-over-year growth 2025-2030 (%)
Data Table on Middle East and Africa - Year-over-year growth 2025-2030 (%)
Chart on Regional Comparison - Middle East and Africa
Data Table on Regional Comparison - Middle East and Africa

12.7.1 Saudi Arabia - Market size and forecast 2025-2030

Chart on Saudi Arabia - Market size and forecast 2025-2030 ($ million)
Data Table on Saudi Arabia - Market size and forecast 2025-2030 ($ million)
Chart on Saudi Arabia - Year-over-year growth 2025-2030 (%)
Data Table on Saudi Arabia - Year-over-year growth 2025-2030 (%)

12.7.2 UAE - Market size and forecast 2025-2030

Chart on UAE - Market size and forecast 2025-2030 ($ million)
Data Table on UAE - Market size and forecast 2025-2030 ($ million)
Chart on UAE - Year-over-year growth 2025-2030 (%)
Data Table on UAE - Year-over-year growth 2025-2030 (%)

12.7.3 South Africa - Market size and forecast 2025-2030

Chart on South Africa - Market size and forecast 2025-2030 ($ million)
Data Table on South Africa - Market size and forecast 2025-2030 ($ million)
Chart on South Africa - Year-over-year growth 2025-2030 (%)
Data Table on South Africa - Year-over-year growth 2025-2030 (%)

12.7.4 Israel - Market size and forecast 2025-2030

Chart on Israel - Market size and forecast 2025-2030 ($ million)
Data Table on Israel - Market size and forecast 2025-2030 ($ million)
Chart on Israel - Year-over-year growth 2025-2030 (%)
Data Table on Israel - Year-over-year growth 2025-2030 (%)

12.7.5 Turkey - Market size and forecast 2025-2030

Chart on Turkey - Market size and forecast 2025-2030 ($ million)
Data Table on Turkey - Market size and forecast 2025-2030 ($ million)
Chart on Turkey - Year-over-year growth 2025-2030 (%)
Data Table on Turkey - Year-over-year growth 2025-2030 (%)

12.8 Market opportunity by geography

Market opportunity by geography ($ million)
Data Tables on Market opportunity by geography ($ million)

13. Drivers, Challenges, and Opportunity

13.1 Market drivers

Accelerated integration of artificial intelligence systems
Expansion of globalization and workforce upskilling
Proliferation of mobile and cloud technology

13.2 Market challenges

Digital infrastructure deficits across emerging regions
High attrition rates disrupting platform monetization
Pervasive competition from free learning solutions

13.3 Impact of drivers and challenges

Impact of drivers and challenges in 2025 and 2030

13.4 Market opportunities

Immersive reality and gamified learning ecosystems
Government led digital curriculum integration
Micro credentialing and lifelong learning badges

14. Competitive Landscape

14.1 Overview

14.2

Overview on criticality of inputs and factors of differentiation

14.3 Landscape disruption

Overview on factors of disruption

14.4 Industry risks

Impact of key risks on business

15. Competitive Analysis

15.1 Companies profiled

Companies covered

15.2 Company ranking index

15.3 Market positioning of companies

Matrix on companies position and classification

15.4 Babbel GmbH

Babbel GmbH - Overview
Babbel GmbH - Product / Service
Babbel GmbH - Key offerings
SWOT

15.5 British Council

British Council - Overview
British Council - Product / Service
British Council - Key offerings
SWOT

15.6 Cambridge University Press

Cambridge University Press - Overview
Cambridge University Press - Product / Service
Cambridge University Press - Key offerings
SWOT

15.7 Duolingo Inc.

Duolingo Inc. - Overview
Duolingo Inc. - Business segments
Duolingo Inc. - Key offerings
Duolingo Inc. - Segment focus
SWOT

15.8 EF Education First Ltd.

EF Education First Ltd. - Overview
EF Education First Ltd. - Product / Service
EF Education First Ltd. - Key offerings
SWOT

15.9 Macmillan Education Ltd.

Macmillan Education Ltd. - Overview
Macmillan Education Ltd. - Product / Service
Macmillan Education Ltd. - Key offerings
SWOT

15.10 Memrise Ltd.

Memrise Ltd. - Overview
Memrise Ltd. - Product / Service
Memrise Ltd. - Key offerings
SWOT

15.11 Mondly

Mondly - Overview
Mondly - Product / Service
Mondly - Key offerings
SWOT

15.12 Open English

Open English - Overview
Open English - Product / Service
Open English - Key offerings
SWOT

15.13 Pearson Plc

Pearson Plc - Overview
Pearson Plc - Business segments
Pearson Plc - Key news
Pearson Plc - Key offerings
Pearson Plc - Segment focus
SWOT

15.14 Preply Inc.

Preply Inc. - Overview
Preply Inc. - Product / Service
Preply Inc. - Key offerings
SWOT

15.15 Rosetta Stone LLC

Rosetta Stone LLC - Overview
Rosetta Stone LLC - Business segments
Rosetta Stone LLC - Key offerings
Rosetta Stone LLC - Segment focus
SWOT

15.16 Sanako

Sanako - Overview
Sanako - Product / Service
Sanako - Key offerings
SWOT

15.17 Voxy Inc.

Voxy Inc. - Overview
Voxy Inc. - Product / Service
Voxy Inc. - Key offerings
SWOT

15.18 WSE Hong Kong Ltd.

WSE Hong Kong Ltd. - Overview
WSE Hong Kong Ltd. - Product / Service
WSE Hong Kong Ltd. - Key offerings
SWOT

16. Appendix

16.1 Scope of the report

Market definition
Objectives
Notes and caveats

16.2 Inclusions and exclusions checklist

Inclusions checklist
Exclusions checklist

16.3 Currency conversion rates for US$

16.4 Research methodology

16.5 Data procurement

Information sources

16.6 Data validation

16.7 Validation techniques employed for market sizing

16.8 Data synthesis

16.9 360 degree market analysis

16.10 List of abbreviations

Research Methodology

Technavio presents a detailed picture of the market by way of study, synthesis, and summation of data from multiple sources. The analysts have presented the various facets of the market with a particular focus on identifying the key industry influencers. The data thus presented is comprehensive, reliable, and the result of extensive research, both primary and secondary.

INFORMATION SOURCES

Primary sources

  • Manufacturers and suppliers
  • Channel partners
  • Industry experts
  • Strategic decision makers

Secondary sources

  • Industry journals and periodicals
  • Government data
  • Financial reports of key industry players
  • Historical data
  • Press releases

DATA ANALYSIS

Data Synthesis

  • Collation of data
  • Estimation of key figures
  • Analysis of derived insights

Data Validation

  • Triangulation with data models
  • Reference against proprietary databases
  • Corroboration with industry experts

REPORT WRITING

Qualitative

  • Market drivers
  • Market challenges
  • Market trends
  • Five forces analysis

Quantitative

  • Market size and forecast
  • Market segmentation
  • Geographical insights
  • Competitive landscape

Interested in this report?

Get your sample now to see our research methodology and insights!

Download Now

Frequently Asked Questions

Digital English Language Learning market growth will increase by USD 39856.2 million during 2026-2030.

The Digital English Language Learning market is expected to grow at a CAGR of 21.9% during 2026-2030.

Digital English Language Learning market is segmented by End-user (Non academic learners, Academic learners) Deployment (On premises, Cloud based) Age group (Adult learners, K-12, Higher education)

Babbel GmbH, British Council, Busuu Ltd., Cambly Inc., Cambridge University Press, Duolingo Inc., EF Education First Ltd., ELSA Co. Ltd., FluentU Inc., LanQuill Technologies, Lingoda GmbH, Macmillan Education Ltd., Memrise Ltd., Mondly, Open English, Pearson Plc, Preply Inc., Rosetta Stone LLC, Sanako, Voxy Inc., WSE Hong Kong Ltd. are a few of the key vendors in the Digital English Language Learning market.

APAC will register the highest growth rate of 38.5% among the other regions. Therefore, the Digital English Language Learning market in APAC is expected to garner significant business opportunities for the vendors during the forecast period.

China, India, Japan, South Korea, Australia, Indonesia, UK, Germany, France, Italy, Spain, The Netherlands, US, Canada, Mexico, Brazil, Argentina, Chile, Saudi Arabia, UAE, South Africa, Israel, Turkey

  • Accelerated integration of artificial intelligence systems is the driving factor this market.

The Digital English Language Learning market vendors should focus on grabbing business opportunities from the End-user segment as it accounted for the largest market share in the base year.
RIA - Research AI Assistant
Ask RIA
