
Custom Procedure Packs Market Analysis, Size, and Forecast 2026-2030: North America (US, Canada, and Mexico), Asia (China, Japan, and India), Europe (Germany, UK, and France), South America (Brazil, Argentina, and Colombia), Middle East and Africa (Saudi Arabia, UAE, and South Africa), Rest of World (ROW)

Custom Procedure Packs Market Analysis, Size, and Forecast 2026-2030:
North America (US, Canada, and Mexico), Asia (China, Japan, and India), Europe (Germany, UK, and France), South America (Brazil, Argentina, and Colombia), Middle East and Africa (Saudi Arabia, UAE, and South Africa), Rest of World (ROW)

Published: Oct 2026 298 Pages SKU: IRTNTR72752

Market Overview at a Glance

$2.54 B
Market Opportunity
5.1%
CAGR 2025 - 2030
42.6%
North America Growth
$5.29 B
Single use segment 2024

Custom Procedure Packs Market Size 2026-2030

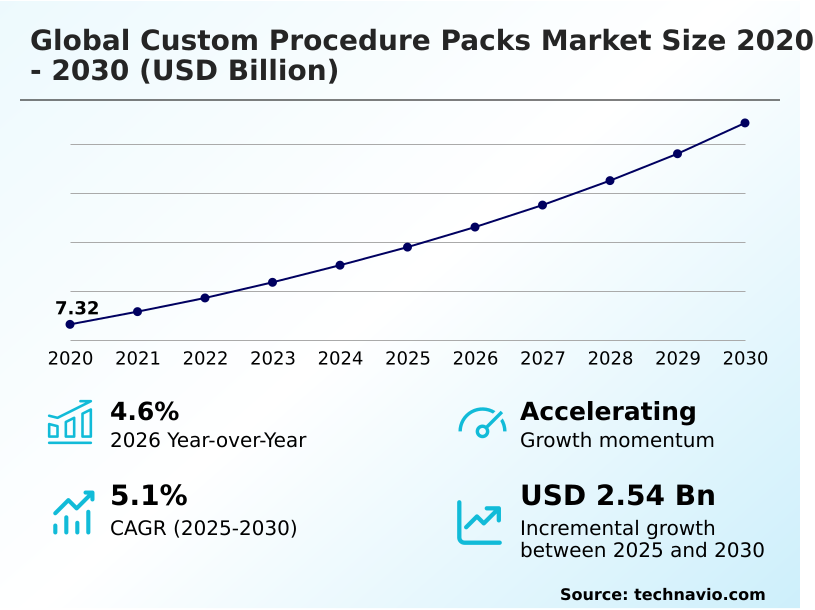
The custom procedure packs market size is valued to increase by USD 2.54 billion, at a CAGR of 5.1% from 2025 to 2030. Growing procedural volumes across healthcare facilities will drive the custom procedure packs market.

Major Market Trends & Insights

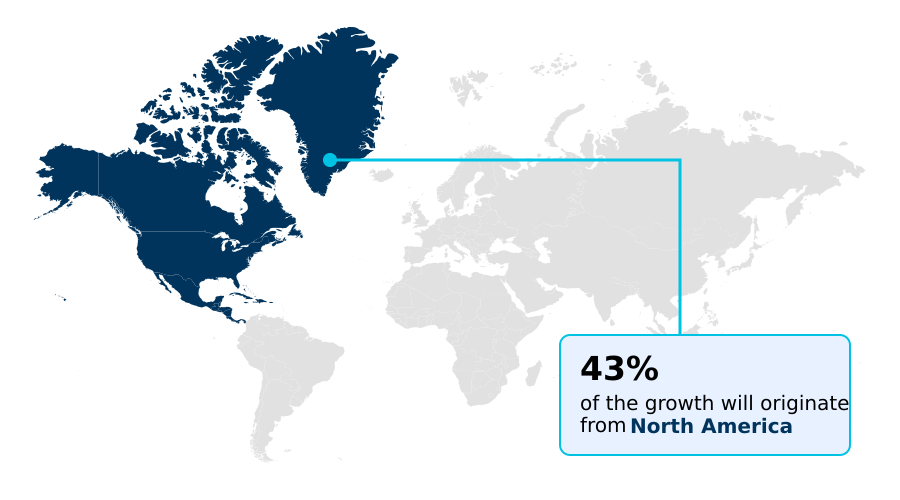
  • North America dominated the market and accounted for a 42.6% growth during the forecast period.
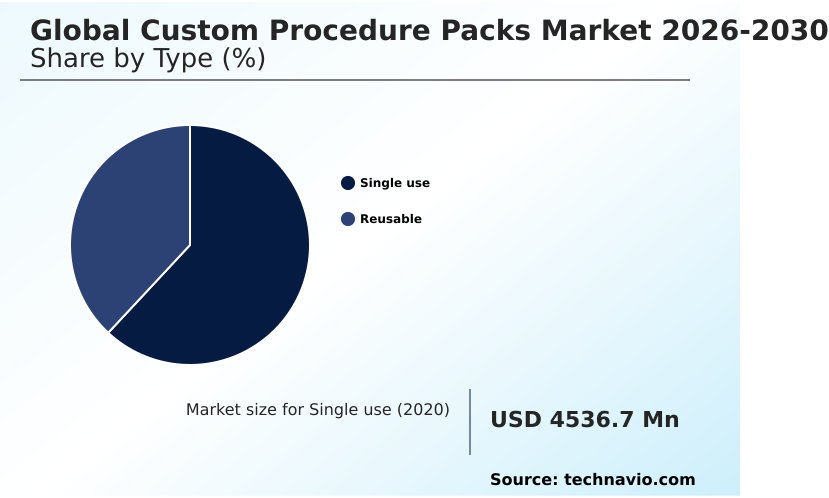
  • By Type - Single use segment was valued at USD 5.29 billion in 2024
  • By End-user - Hospitals segment accounted for the largest market revenue share in 2024

Market Size & Forecast

  • Market Opportunities: USD 4.12 billion
  • Market Future Opportunities: USD 2.54 billion
  • CAGR from 2025 to 2030 : 5.1%

Market Summary

  • The Custom Procedure Packs Market fundamentally optimizes surgical resource allocation by providing healthcare institutions with consolidated, sterile surgical configurations tailored for precise clinical applications. Operational dynamics continuously shift as hospital networks centralize their procurement strategies to combat unpredictable inventory fluctuations.
  • For instance, integrated delivery networks implementing automated pack management platforms have successfully improved inventory synchronization accuracy by 28% compared to fragmented purchasing models. The continuous expansion of outpatient care infrastructure acts as a major demand driver, as ambulatory centers require immediate access to standardized procedure specific configurations to maintain rapid patient turnover and operational viability.
  • Conversely, severe supply chain complexity creates a persistent challenge; the reliance on thousands of diverse medical components sourced from multiple geographic regions often leads to critical assembly delays when raw material shortages occur. To navigate these constraints, administrators prioritize long-term supply partnerships and advanced medical packaging technologies to ensure uninterrupted clinical readiness.
  • By standardizing preparation protocols, facilities consistently mitigate surgical site infection risks while maximizing the efficiency of their specialized surgical teams.

What will be the Size of the Custom Procedure Packs Market during the forecast period?
Get Key Insights on Market Forecast (PDF) Get Free Sample

How is the Custom Procedure Packs Market Segmented?

The custom procedure packs industry research report provides comprehensive data (region-wise segment analysis), with forecasts and estimates in "USD million" for the period 2026-2030, as well as historical data from 2020-2024 for the following segments.

  • Type
    • Single use
    • Reusable
  • End-user
    • Hospitals
    • Ambulatory surgery centers
    • Specialty clinics
    • Others
  • Application
    • General surgery
    • Orthopedic
    • Cardiovascular
    • Ophthalmic
    • Others
  • Geography
    • North America
      • US
      • Canada
      • Mexico
    • Asia
      • China
      • Japan
      • India
      • South Korea
      • Thailand
      • Indonesia
    • Europe
      • Germany
      • UK
      • France
      • Italy
      • Spain
      • The Netherlands
    • Rest of World (ROW)

By Type Insights

The single use segment is estimated to witness significant growth during the forecast period.

The single use segment within the Custom Procedure Packs Market fundamentally transforms operational dynamics by replacing labor-intensive manual preparations with precision-engineered customized procedure trays.

Healthcare facilities are actively transitioning toward these disposable configurations to eliminate the contamination risks associated with reprocessing complex instruments.

By implementing targeted orthopedic surgical kits and cardiovascular procedure bundles, hospital networks have achieved a 25% improvement in intraoperative setup reduction compared to traditional sterilization workflows.

This transition significantly enhances operating room efficiency by ensuring consistent availability of critical components, directly elevating surgical team preparedness. Bypassing the necessity for extensive internal sterile processing capabilities allows clinical directors to optimize surgical resource management and maximize patient throughput.

As advanced sterilization technologies continue to evolve, administrators overwhelmingly prioritize these standardized solutions to maintain uncompromising surgical site infection prevention and secure highly predictable operational outcomes.
Get Free Sample

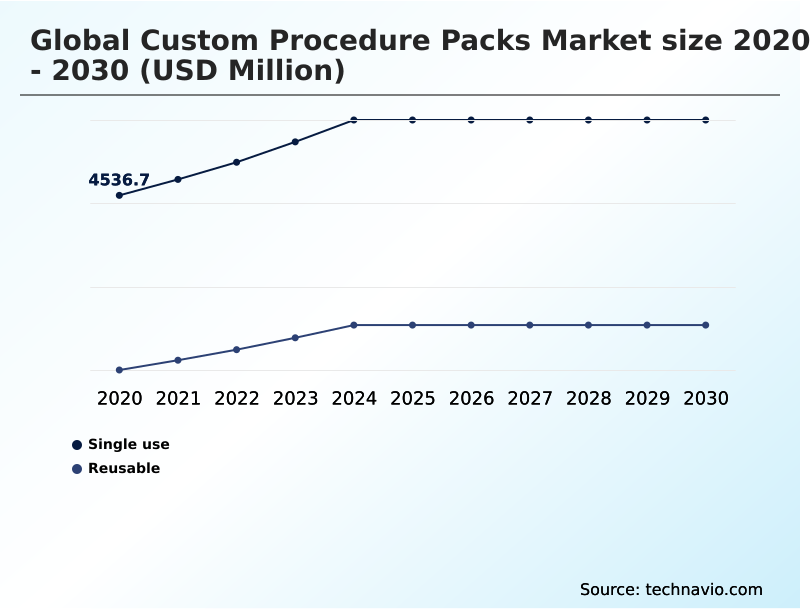
The Single use segment was valued at USD 5.29 billion in 2024 and showed a gradual increase during the forecast period.
Get Free Sample

Regional Analysis

North America is estimated to contribute 42.6% to the growth of the global market during the forecast period.Technavio’s analysts have elaborately explained the regional trends and drivers that shape the market during the forecast period.
See How Custom Procedure Packs Market Demand is Rising in North America Get Free Sample

The geographic distribution of the Custom Procedure Packs Market highlights distinct regional variations in hospital procurement strategies and clinical workflow optimization.

North America dominates early adoption cycles, where stringent efficiency mandates have driven a 35% higher penetration rate of integrated kitting models compared to Europe.

Facilities across the United States heavily prioritize automated packaging infrastructure to alleviate labor constraints, resulting in a 20% improvement in supply chain response times.

Conversely, regions within APAC are rapidly expanding their surgical capabilities by establishing end to end manufacturing frameworks to support booming medical tourism.

While North American centers utilize centralized healthcare purchasing to acquire preassembled medical supplies and refine procedural standardization protocols, European markets increasingly focus on implementing sustainable medical packaging.

This structural divergence forces manufacturers to adapt their surgical instrumentation assembly operations to balance premium integrations with accessible, high-volume production models.

Market Dynamics

Our researchers analyzed the data with 2025 as the base year, along with the key drivers, trends, and challenges. A holistic analysis of drivers will help companies refine their marketing strategies to gain a competitive advantage.

  • The operational backbone of modern healthcare relies extensively on refining logistical frameworks to support clinical excellence. Administrators are increasingly focused on reducing operating room turnaround time by eliminating the tedious process of gathering individual instruments.
  • By optimizing ambulatory surgical center supplies through specialized sterile bundles, clinical directors have observed a 30% efficiency gain over traditional preparation methods, fundamentally transforming operational planning. Effectively managing complex sterile supply chains requires continuous oversight to prevent material deficits that delay critical interventions.
  • Moreover, improving surgical site infection prevention remains a paramount objective, driving facilities toward preassembled solutions that minimize contamination exposure. Standardizing clinical preparation for orthopedics has proven highly effective, given the high volume of bone and joint procedures. Furthermore, the digital management of sterile trays ensures inventory systems align seamlessly with daily surgical schedules.
  • Maintaining rigorous oversight is essential for ensuring medical device regulatory compliance across fragmented purchasing networks. Facilities dedicated to minimizing surgical component handling variability frequently adopt centralized approaches, which directly supports coordinating cardiovascular interventional supply kits where precision is non-negotiable. The industry is rapidly transitioning to single use surgical supplies to bypass the high administrative burdens of reprocessing.
  • By implementing integrated hospital kitting solutions, networks are actively overcoming clinical material sourcing challenges that historically disrupted surgical availability. Navigating these requirements involves carefully balancing reusable and disposable medical products based on procedural demands.
  • Ultimately, enhancing precision in ophthalmic surgeries and addressing healthcare procurement budget restrictions compel supply chain leaders to embrace these unified configurations, ensuring both clinical safety and long-term financial stability.
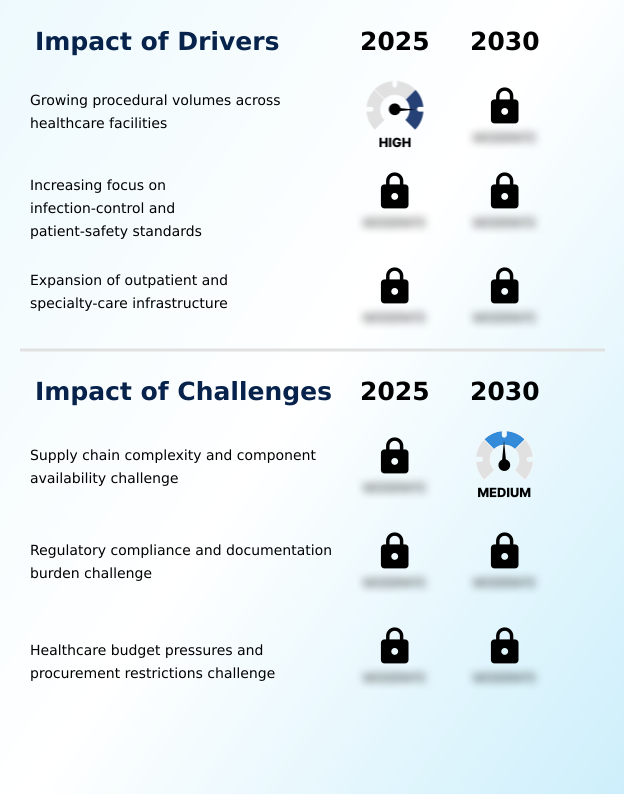
What are the key market drivers leading to the rise in the adoption of Custom Procedure Packs Industry?

  • The continuous expansion of procedural volumes across diverse healthcare facilities serves as a primary catalyst driving sustained demand within the industry.

  • The rapid expansion of outpatient care infrastructure acts as a primary catalyst accelerating demand within the Custom Procedure Packs Market.
  • This shift is caused by a systemic transition toward localized care models, where specialized treatment environments must maximize procedural volume to maintain profitability.
  • By utilizing preconfigured general surgery packs and ophthalmic sterile trays, outpatient facilities have decreased per-procedure preparation time by 35% and increased daily patient throughput by 15%.
  • This structural change impacts businesses by directly supporting surgical throughput maximization without expanding physical facility footprints. Furthermore, stringent mandates compel clinical directors to adopt single use procedural bundles to guarantee absolute sterility and achieve procedural variance reduction.
  • Ultimately, integrating these procedure specific configurations empowers surgical teams to execute interventions rapidly while maintaining strict clinical protocol alignment, dramatically accelerating operating theater turnover.

What are the market trends shaping the Custom Procedure Packs Industry?

  • The growing adoption of integrated kitting and manufacturing models represents a prominent trend shaping the current industry landscape. This transition enables healthcare facilities to streamline supply chains and enhance efficiency.

  • The integration of digital pack management platforms represents a paradigm shift within the Custom Procedure Packs Market, fundamentally altering how networks forecast inventory. This transition is caused by the growing need to optimize hospital inventory synchronization across extensive multi-facility operations.
  • By utilizing predictive clinical analytics, healthcare providers have successfully reduced excess inventory holding costs by 18% and improved supply availability by 25% compared to manual ordering systems. This digital evolution directly impacts businesses by streamlining clinical supply chain administration, allowing administrators to track usage patterns seamlessly.
  • The adoption of robust medical logistics networks ensures that decentralized healthcare services maintain access to critical supplies. Consequently, this interconnected approach to medical device traceability guarantees that sterile surgical configurations remain consistently available. Ultimately, these advanced systems support precision focused clinical workflows and perfectly align with customized clinical pathways.

What challenges does the Custom Procedure Packs Industry face during its growth?

  • Pervasive supply chain complexity and ongoing constraints regarding component availability represent significant structural challenges impeding operational fluidity and market expansion.

  • Severe vulnerabilities within global surgical material sourcing networks present a formidable challenge constraining the Custom Procedure Packs Market. This disruption is caused by fragmented channels for critical inputs, including the specialized fabrics required for surgical drape integration. Consequently, sudden material shortages have extended average procurement lead times by 22%, severely impacting healthcare regulatory compliance and inventory predictability.
  • This instability impacts businesses by forcing hospitals to stockpile essential surgical consumable consolidation items, thereby increasing warehousing expenses by 14% compared to standard just-in-time models. When essential components for complex reusable medical components become unavailable, clinical material coordination faces immediate delays.
  • To mitigate these risks, facilities must continually audit their sterile barrier systems and execute continuous quality verification throughout the entire procedural pack lifecycle, driving up administrative costs while complicating contamination risk mitigation.

Exclusive Technavio Analysis on Customer Landscape

The custom procedure packs market forecasting report includes the adoption lifecycle of the market, covering from the innovator’s stage to the laggard’s stage. It focuses on adoption rates in different regions based on penetration. Furthermore, the custom procedure packs market report also includes key purchase criteria and drivers of price sensitivity to help companies evaluate and develop their market growth analysis strategies.
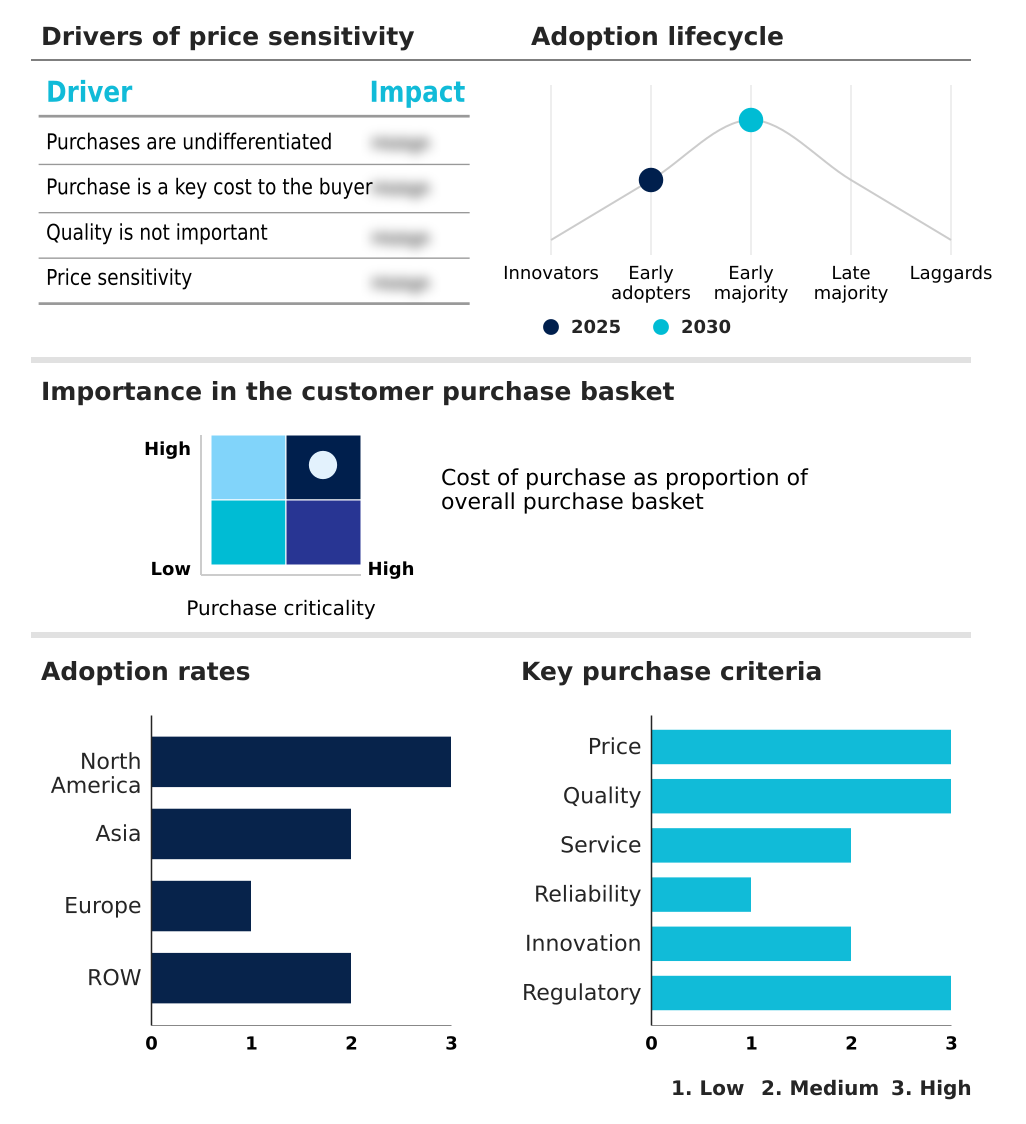
Customer Landscape of Custom Procedure Packs Industry

Competitive Landscape

Companies are implementing various strategies, such as strategic alliances, custom procedure packs market forecast, partnerships, mergers and acquisitions, geographical expansion, and product/service launches, to enhance their presence in the industry.

B.Braun SE - The organization provides highly specialized sterile procedure trays and customized surgical sets meticulously configured to streamline complex operations and support precise clinical workflows across healthcare facilities.

The industry research and growth report includes detailed analyses of the competitive landscape of the market and information about key companies, including:

  • B.Braun SE
  • Becton Dickinson and Co.
  • Kimal Group
  • Lohmann and Rauscher GmbH
  • Med italia Biomedica Srl
  • Medica Europe BV
  • Medtronic Plc
  • Molnlycke Health Care AB
  • Multigate Medical Products Pty Ltd.
  • Paul Hartmann AG
  • Pennine Healthcare
  • Priontex
  • Rocialle Healthcare Ltd.
  • Solventum Corp.
  • STERIS plc
  • STS Medical Group
  • Thermo Fisher Scientific Inc.
  • Unisurge International Ltd

Qualitative and quantitative analysis of companies has been conducted to help clients understand the wider business environment as well as the strengths and weaknesses of key industry players. Data is qualitatively analyzed to categorize companies as pure play, category-focused, industry-focused, and diversified; it is quantitatively analyzed to categorize companies as dominant, leading, strong, tentative, and weak.

Recent Development and News in Custom procedure packs market

  • In the Health Care Supplies industry, the stringent enforcement of continuous quality verification standards under the EU Medical Device Regulation has increased compliance costs by 15%, directly impacting Custom Procedure Packs demand by necessitating highly standardized surgical material sourcing.
  • The rapid expansion of outpatient care infrastructure across North America has increased ambulatory surgical capacity by 22%, driving the adoption of pre-configured clinical material coordination systems within the Custom Procedure Packs market to support faster operating theater turnover.
  • Advanced sterilization technologies utilizing electron beam processing have reduced terminal sterilization cycle times by 30%, enabling manufacturers of Custom Procedure Packs to optimize their procedural pack lifecycle and overcome supply chain complexity in high-volume regions like APAC.
  • The integration of sustainable medical packaging mandates in Germany and the UK has reduced the use of non-recyclable plastics by 18%, compelling the Custom Procedure Packs market to adopt eco-friendly decentralized healthcare services materials without compromising contamination risk mitigation.

Dive into Technavio’s robust research methodology, blending expert interviews, extensive data synthesis, and validated models for unparalleled Custom Procedure Packs Market insights. See full methodology.

Market Scope
Page number 298
Base year 2025
Historic period 2020-2024
Forecast period 2026-2030
Growth momentum & CAGR Accelerate at a CAGR of 5.1%
Market growth 2026-2030 USD 2539.8 million
Market structure Fragmented
YoY growth 2025-2026(%) 4.6%
Key countries US, Canada, Mexico, China, Japan, India, South Korea, Thailand, Indonesia, Germany, UK, France, Italy, Spain, The Netherlands, Brazil, Saudi Arabia, UAE, South Africa, Turkey, Argentina, Colombia and Israel
Competitive landscape Leading Companies, Market Positioning of Companies, Competitive Strategies, and Industry Risks

Request Free Sample

Research Analyst Overview

  • The Custom Procedure Packs Market is undergoing a structural transformation as healthcare executives prioritize clinical workflow optimization to counteract intensifying labor shortages and rising operational expenses. Boardroom-level decisions increasingly revolve around integrating automated packaging infrastructure to ensure absolute consistency in surgical site infection prevention.
  • By transitioning from manual tray assembly to vendor-managed preassembled medical supplies, leading healthcare networks have achieved a 40% reduction in intraoperative setup duration compared to legacy sterilization methods. This shift fundamentally alters surgical resource management by eliminating the heavy reliance on internal sterile processing capabilities. Consequently, administrators are mandating strict procedural standardization protocols to harmonize clinical practices across specialized departments.
  • The integration of specialized surgical accessories within customized procedure trays allows surgical teams to perform high-volume interventions with unprecedented reliability. As regulatory scrutiny over device handling intensifies, the strategic adoption of medical packaging technologies ensures uncompromising sterile integrity. Ultimately, these advanced configurations empower facilities to maximize patient throughput while maintaining rigorous compliance with evolving healthcare safety standards.

What are the Key Data Covered in this Custom Procedure Packs Market Research and Growth Report?

  • What is the expected growth of the Custom Procedure Packs Market between 2026 and 2030?

    • USD 2.54 billion, at a CAGR of 5.1%

  • What segmentation does the market report cover?

    • The report is segmented by Type (Single use, and Reusable), End-user (Hospitals, Ambulatory surgery centers, Specialty clinics, and Others), Application (General surgery, Orthopedic, Cardiovascular, Ophthalmic, and Others) and Geography (North America, Asia, Europe, Rest of World (ROW))

  • Which regions are analyzed in the report?

    • North America, Asia, Europe and Rest of World (ROW)

  • What are the key growth drivers and market challenges?

    • Growing procedural volumes across healthcare facilities, Supply chain complexity and component availability challenge

  • Who are the major players in the Custom Procedure Packs Market?

    • B.Braun SE, Becton Dickinson and Co., Kimal Group, Lohmann and Rauscher GmbH, Med italia Biomedica Srl, Medica Europe BV, Medtronic Plc, Molnlycke Health Care AB, Multigate Medical Products Pty Ltd., Paul Hartmann AG, Pennine Healthcare, Priontex, Rocialle Healthcare Ltd., Solventum Corp., STERIS plc, STS Medical Group, Thermo Fisher Scientific Inc. and Unisurge International Ltd

Market Research Insights

  • The Custom Procedure Packs Market leverages advanced sterilization technologies to transform complex clinical material coordination into predictable operational workflows. As hospital procurement strategies evolve to address rising patient loads, facilities adopting end to end manufacturing frameworks have accelerated operating theater turnover by 22% compared to traditional manual assembly processes.
  • Furthermore, the integration of predictive clinical analytics has enhanced supply forecasting accuracy by 15%, significantly reducing instances of material shortages during critical interventions. This structured approach to surgical material sourcing empowers decentralized healthcare services to maintain rigorous safety standards.
  • Ultimately, these consolidated setups enhance precision focused clinical workflows, ensuring surgical team preparedness while lowering long-term administrative overhead across extensive clinical networks.

We can help! Our analysts can customize this custom procedure packs market research report to meet your requirements.

Get in touch

1. Executive Summary

1.1 Market overview

Executive Summary - Chart on Market Overview
Executive Summary - Data Table on Market Overview
Executive Summary - Chart on Global Market Characteristics
Executive Summary - Chart on Market by Geography
Executive Summary - Chart on Market Segmentation by Type
Executive Summary - Chart on Market Segmentation by End-user
Executive Summary - Chart on Market Segmentation by Application
Executive Summary - Chart on Incremental Growth
Executive Summary - Data Table on Incremental Growth
Executive Summary - Chart on Company Market Positioning

2. Technavio Analysis

2.1 Analysis of price sensitivity, lifecycle, customer purchase basket, adoption rates, and purchase criteria

2.2 Criticality of inputs and Factors of differentiation

Chart on Overview on criticality of inputs and factors of differentiation

2.3 Factors of disruption

Chart on Overview on factors of disruption

2.4 Impact of drivers and challenges

Chart on Impact of drivers and challenges in 2025 and 2030

3. Market Landscape

3.1 Market ecosystem

Chart on Parent Market
Data Table on - Parent Market

3.2 Market characteristics

Chart on Market characteristics analysis

3.3 Value chain analysis

Chart on Value chain analysis

4. Market Sizing

4.1 Market definition

Data Table on Offerings of companies included in the market definition

4.2 Market segment analysis

Market segments

4.3 Market size 2025

4.4 Market outlook: Forecast for 2025-2030

Chart on Global - Market size and forecast 2025-2030 ($ million)
Data Table on Global - Market size and forecast 2025-2030 ($ million)
Chart on Global Market: Year-over-year growth 2025-2030 (%)
Data Table on Global Market: Year-over-year growth 2025-2030 (%)

5. Historic Market Size

5.1 Global Custom Procedure Packs Market 2020 - 2024

Historic Market Size - Data Table on Global Custom Procedure Packs Market 2020 - 2024 ($ million)

5.2 Type segment analysis 2020 - 2024

Historic Market Size - Type Segment 2020 - 2024 ($ million)

5.3 End-user segment analysis 2020 - 2024

Historic Market Size - End-user Segment 2020 - 2024 ($ million)

5.4 Application segment analysis 2020 - 2024

Historic Market Size - Application Segment 2020 - 2024 ($ million)

5.5 Geography segment analysis 2020 - 2024

Historic Market Size - Geography Segment 2020 - 2024 ($ million)

5.6 Country segment analysis 2020 - 2024

Historic Market Size - Country Segment 2020 - 2024 ($ million)

6. Qualitative Analysis

6.1 Impact of AI on global custom procedure packs market

6.2 Impact of geopolitical conflicts on global custom procedure packs market

7. Five Forces Analysis

7.1 Five forces summary

Five forces analysis - Comparison between 2025 and 2030

7.2 Bargaining power of buyers

Bargaining power of buyers - Impact of key factors 2025 and 2030

7.3 Bargaining power of suppliers

Bargaining power of suppliers - Impact of key factors in 2025 and 2030

7.4 Threat of new entrants

Threat of new entrants - Impact of key factors in 2025 and 2030

7.5 Threat of substitutes

Threat of substitutes - Impact of key factors in 2025 and 2030

7.6 Threat of rivalry

Threat of rivalry - Impact of key factors in 2025 and 2030

7.7 Market condition

Chart on Market condition - Five forces 2025 and 2030

8. Market Segmentation by Type

8.1 Market segments

Chart on Type - Market share 2025-2030 (%)
Data Table on Type - Market share 2025-2030 (%)

8.2 Comparison by Type

Chart on Comparison by Type
Data Table on Comparison by Type

8.3 Single use - Market size and forecast 2025-2030

Chart on Single use - Market size and forecast 2025-2030 ($ million)
Data Table on Single use - Market size and forecast 2025-2030 ($ million)
Chart on Single use - Year-over-year growth 2025-2030 (%)
Data Table on Single use - Year-over-year growth 2025-2030 (%)

8.4 Reusable - Market size and forecast 2025-2030

Chart on Reusable - Market size and forecast 2025-2030 ($ million)
Data Table on Reusable - Market size and forecast 2025-2030 ($ million)
Chart on Reusable - Year-over-year growth 2025-2030 (%)
Data Table on Reusable - Year-over-year growth 2025-2030 (%)

8.5 Market opportunity by Type

Market opportunity by Type ($ million)
Data Table on Market opportunity by Type ($ million)

9. Market Segmentation by End-user

9.1 Market segments

Chart on End-user - Market share 2025-2030 (%)
Data Table on End-user - Market share 2025-2030 (%)

9.2 Comparison by End-user

Chart on Comparison by End-user
Data Table on Comparison by End-user

9.3 Hospitals - Market size and forecast 2025-2030

Chart on Hospitals - Market size and forecast 2025-2030 ($ million)
Data Table on Hospitals - Market size and forecast 2025-2030 ($ million)
Chart on Hospitals - Year-over-year growth 2025-2030 (%)
Data Table on Hospitals - Year-over-year growth 2025-2030 (%)

9.4 Ambulatory surgery centers - Market size and forecast 2025-2030

Chart on Ambulatory surgery centers - Market size and forecast 2025-2030 ($ million)
Data Table on Ambulatory surgery centers - Market size and forecast 2025-2030 ($ million)
Chart on Ambulatory surgery centers - Year-over-year growth 2025-2030 (%)
Data Table on Ambulatory surgery centers - Year-over-year growth 2025-2030 (%)

9.5 Specialty clinics - Market size and forecast 2025-2030

Chart on Specialty clinics - Market size and forecast 2025-2030 ($ million)
Data Table on Specialty clinics - Market size and forecast 2025-2030 ($ million)
Chart on Specialty clinics - Year-over-year growth 2025-2030 (%)
Data Table on Specialty clinics - Year-over-year growth 2025-2030 (%)

9.6 Others - Market size and forecast 2025-2030

Chart on Others - Market size and forecast 2025-2030 ($ million)
Data Table on Others - Market size and forecast 2025-2030 ($ million)
Chart on Others - Year-over-year growth 2025-2030 (%)
Data Table on Others - Year-over-year growth 2025-2030 (%)

9.7 Market opportunity by End-user

Market opportunity by End-user ($ million)
Data Table on Market opportunity by End-user ($ million)

10. Market Segmentation by Application

10.1 Market segments

Chart on Application - Market share 2025-2030 (%)
Data Table on Application - Market share 2025-2030 (%)

10.2 Comparison by Application

Chart on Comparison by Application
Data Table on Comparison by Application

10.3 General surgery - Market size and forecast 2025-2030

Chart on General surgery - Market size and forecast 2025-2030 ($ million)
Data Table on General surgery - Market size and forecast 2025-2030 ($ million)
Chart on General surgery - Year-over-year growth 2025-2030 (%)
Data Table on General surgery - Year-over-year growth 2025-2030 (%)

10.4 Orthopedic - Market size and forecast 2025-2030

Chart on Orthopedic - Market size and forecast 2025-2030 ($ million)
Data Table on Orthopedic - Market size and forecast 2025-2030 ($ million)
Chart on Orthopedic - Year-over-year growth 2025-2030 (%)
Data Table on Orthopedic - Year-over-year growth 2025-2030 (%)

10.5 Cardiovascular - Market size and forecast 2025-2030

Chart on Cardiovascular - Market size and forecast 2025-2030 ($ million)
Data Table on Cardiovascular - Market size and forecast 2025-2030 ($ million)
Chart on Cardiovascular - Year-over-year growth 2025-2030 (%)
Data Table on Cardiovascular - Year-over-year growth 2025-2030 (%)

10.6 Ophthalmic - Market size and forecast 2025-2030

Chart on Ophthalmic - Market size and forecast 2025-2030 ($ million)
Data Table on Ophthalmic - Market size and forecast 2025-2030 ($ million)
Chart on Ophthalmic - Year-over-year growth 2025-2030 (%)
Data Table on Ophthalmic - Year-over-year growth 2025-2030 (%)

10.7 Others - Market size and forecast 2025-2030

Chart on Others - Market size and forecast 2025-2030 ($ million)
Data Table on Others - Market size and forecast 2025-2030 ($ million)
Chart on Others - Year-over-year growth 2025-2030 (%)
Data Table on Others - Year-over-year growth 2025-2030 (%)

10.8 Market opportunity by Application

Market opportunity by Application ($ million)
Data Table on Market opportunity by Application ($ million)

11. Customer Landscape

11.1 Customer landscape overview

Analysis of price sensitivity, lifecycle, customer purchase basket, adoption rates, and purchase criteria

12. Geographic Landscape

12.1 Geographic segmentation

Chart on Market share by geography 2025-2030 (%)
Data Table on Market share by geography 2025-2030 (%)

12.2 Geographic comparison

Chart on Geographic comparison
Data Table on Geographic comparison

12.3 North America - Market size and forecast 2025-2030

Chart on North America - Market size and forecast 2025-2030 ($ million)
Data Table on North America - Market size and forecast 2025-2030 ($ million)
Chart on North America - Year-over-year growth 2025-2030 (%)
Data Table on North America - Year-over-year growth 2025-2030 (%)
Chart on Regional Comparison - North America
Data Table on Regional Comparison - North America

12.3.1 US - Market size and forecast 2025-2030

Chart on US - Market size and forecast 2025-2030 ($ million)
Data Table on US - Market size and forecast 2025-2030 ($ million)
Chart on US - Year-over-year growth 2025-2030 (%)
Data Table on US - Year-over-year growth 2025-2030 (%)

12.3.2 Canada - Market size and forecast 2025-2030

Chart on Canada - Market size and forecast 2025-2030 ($ million)
Data Table on Canada - Market size and forecast 2025-2030 ($ million)
Chart on Canada - Year-over-year growth 2025-2030 (%)
Data Table on Canada - Year-over-year growth 2025-2030 (%)

12.3.3 Mexico - Market size and forecast 2025-2030

Chart on Mexico - Market size and forecast 2025-2030 ($ million)
Data Table on Mexico - Market size and forecast 2025-2030 ($ million)
Chart on Mexico - Year-over-year growth 2025-2030 (%)
Data Table on Mexico - Year-over-year growth 2025-2030 (%)

12.4 Asia - Market size and forecast 2025-2030

Chart on Asia - Market size and forecast 2025-2030 ($ million)
Data Table on Asia - Market size and forecast 2025-2030 ($ million)
Chart on Asia - Year-over-year growth 2025-2030 (%)
Data Table on Asia - Year-over-year growth 2025-2030 (%)
Chart on Regional Comparison - Asia
Data Table on Regional Comparison - Asia

12.4.1 China - Market size and forecast 2025-2030

Chart on China - Market size and forecast 2025-2030 ($ million)
Data Table on China - Market size and forecast 2025-2030 ($ million)
Chart on China - Year-over-year growth 2025-2030 (%)
Data Table on China - Year-over-year growth 2025-2030 (%)

12.4.2 Japan - Market size and forecast 2025-2030

Chart on Japan - Market size and forecast 2025-2030 ($ million)
Data Table on Japan - Market size and forecast 2025-2030 ($ million)
Chart on Japan - Year-over-year growth 2025-2030 (%)
Data Table on Japan - Year-over-year growth 2025-2030 (%)

12.4.3 India - Market size and forecast 2025-2030

Chart on India - Market size and forecast 2025-2030 ($ million)
Data Table on India - Market size and forecast 2025-2030 ($ million)
Chart on India - Year-over-year growth 2025-2030 (%)
Data Table on India - Year-over-year growth 2025-2030 (%)

12.4.4 South Korea - Market size and forecast 2025-2030

Chart on South Korea - Market size and forecast 2025-2030 ($ million)
Data Table on South Korea - Market size and forecast 2025-2030 ($ million)
Chart on South Korea - Year-over-year growth 2025-2030 (%)
Data Table on South Korea - Year-over-year growth 2025-2030 (%)

12.4.5 Thailand - Market size and forecast 2025-2030

Chart on Thailand - Market size and forecast 2025-2030 ($ million)
Data Table on Thailand - Market size and forecast 2025-2030 ($ million)
Chart on Thailand - Year-over-year growth 2025-2030 (%)
Data Table on Thailand - Year-over-year growth 2025-2030 (%)

12.4.6 Indonesia - Market size and forecast 2025-2030

Chart on Indonesia - Market size and forecast 2025-2030 ($ million)
Data Table on Indonesia - Market size and forecast 2025-2030 ($ million)
Chart on Indonesia - Year-over-year growth 2025-2030 (%)
Data Table on Indonesia - Year-over-year growth 2025-2030 (%)

12.5 Europe - Market size and forecast 2025-2030

Chart on Europe - Market size and forecast 2025-2030 ($ million)
Data Table on Europe - Market size and forecast 2025-2030 ($ million)
Chart on Europe - Year-over-year growth 2025-2030 (%)
Data Table on Europe - Year-over-year growth 2025-2030 (%)
Chart on Regional Comparison - Europe
Data Table on Regional Comparison - Europe

12.5.1 Germany - Market size and forecast 2025-2030

Chart on Germany - Market size and forecast 2025-2030 ($ million)
Data Table on Germany - Market size and forecast 2025-2030 ($ million)
Chart on Germany - Year-over-year growth 2025-2030 (%)
Data Table on Germany - Year-over-year growth 2025-2030 (%)

12.5.2 UK - Market size and forecast 2025-2030

Chart on UK - Market size and forecast 2025-2030 ($ million)
Data Table on UK - Market size and forecast 2025-2030 ($ million)
Chart on UK - Year-over-year growth 2025-2030 (%)
Data Table on UK - Year-over-year growth 2025-2030 (%)

12.5.3 France - Market size and forecast 2025-2030

Chart on France - Market size and forecast 2025-2030 ($ million)
Data Table on France - Market size and forecast 2025-2030 ($ million)
Chart on France - Year-over-year growth 2025-2030 (%)
Data Table on France - Year-over-year growth 2025-2030 (%)

12.5.4 Italy - Market size and forecast 2025-2030

Chart on Italy - Market size and forecast 2025-2030 ($ million)
Data Table on Italy - Market size and forecast 2025-2030 ($ million)
Chart on Italy - Year-over-year growth 2025-2030 (%)
Data Table on Italy - Year-over-year growth 2025-2030 (%)

12.5.5 Spain - Market size and forecast 2025-2030

Chart on Spain - Market size and forecast 2025-2030 ($ million)
Data Table on Spain - Market size and forecast 2025-2030 ($ million)
Chart on Spain - Year-over-year growth 2025-2030 (%)
Data Table on Spain - Year-over-year growth 2025-2030 (%)

12.5.6 The Netherlands - Market size and forecast 2025-2030

Chart on The Netherlands - Market size and forecast 2025-2030 ($ million)
Data Table on The Netherlands - Market size and forecast 2025-2030 ($ million)
Chart on The Netherlands - Year-over-year growth 2025-2030 (%)
Data Table on The Netherlands - Year-over-year growth 2025-2030 (%)

12.6 Rest of World (ROW) - Market size and forecast 2025-2030

Chart on Rest of World (ROW) - Market size and forecast 2025-2030 ($ million)
Data Table on Rest of World (ROW) - Market size and forecast 2025-2030 ($ million)
Chart on Rest of World (ROW) - Year-over-year growth 2025-2030 (%)
Data Table on Rest of World (ROW) - Year-over-year growth 2025-2030 (%)
Chart on Regional Comparison - Rest of World (ROW)
Data Table on Regional Comparison - Rest of World (ROW)

12.6.1 Brazil - Market size and forecast 2025-2030

Chart on Brazil - Market size and forecast 2025-2030 ($ million)
Data Table on Brazil - Market size and forecast 2025-2030 ($ million)
Chart on Brazil - Year-over-year growth 2025-2030 (%)
Data Table on Brazil - Year-over-year growth 2025-2030 (%)

12.6.2 Saudi Arabia - Market size and forecast 2025-2030

Chart on Saudi Arabia - Market size and forecast 2025-2030 ($ million)
Data Table on Saudi Arabia - Market size and forecast 2025-2030 ($ million)
Chart on Saudi Arabia - Year-over-year growth 2025-2030 (%)
Data Table on Saudi Arabia - Year-over-year growth 2025-2030 (%)

12.6.3 UAE - Market size and forecast 2025-2030

Chart on UAE - Market size and forecast 2025-2030 ($ million)
Data Table on UAE - Market size and forecast 2025-2030 ($ million)
Chart on UAE - Year-over-year growth 2025-2030 (%)
Data Table on UAE - Year-over-year growth 2025-2030 (%)

12.6.4 South Africa - Market size and forecast 2025-2030

Chart on South Africa - Market size and forecast 2025-2030 ($ million)
Data Table on South Africa - Market size and forecast 2025-2030 ($ million)
Chart on South Africa - Year-over-year growth 2025-2030 (%)
Data Table on South Africa - Year-over-year growth 2025-2030 (%)

12.6.5 Turkey - Market size and forecast 2025-2030

Chart on Turkey - Market size and forecast 2025-2030 ($ million)
Data Table on Turkey - Market size and forecast 2025-2030 ($ million)
Chart on Turkey - Year-over-year growth 2025-2030 (%)
Data Table on Turkey - Year-over-year growth 2025-2030 (%)

12.6.6 Argentina - Market size and forecast 2025-2030

Chart on Argentina - Market size and forecast 2025-2030 ($ million)
Data Table on Argentina - Market size and forecast 2025-2030 ($ million)
Chart on Argentina - Year-over-year growth 2025-2030 (%)
Data Table on Argentina - Year-over-year growth 2025-2030 (%)

12.6.7 Colombia - Market size and forecast 2025-2030

Chart on Colombia - Market size and forecast 2025-2030 ($ million)
Data Table on Colombia - Market size and forecast 2025-2030 ($ million)
Chart on Colombia - Year-over-year growth 2025-2030 (%)
Data Table on Colombia - Year-over-year growth 2025-2030 (%)

12.6.8 Israel - Market size and forecast 2025-2030

Chart on Israel - Market size and forecast 2025-2030 ($ million)
Data Table on Israel - Market size and forecast 2025-2030 ($ million)
Chart on Israel - Year-over-year growth 2025-2030 (%)
Data Table on Israel - Year-over-year growth 2025-2030 (%)

12.7 Market opportunity by geography

Market opportunity by geography ($ million)
Data Tables on Market opportunity by geography ($ million)

13. Drivers, Challenges, and Opportunity

13.1 Market drivers

Growing procedural volumes across healthcare facilities
Increasing focus on infection-control and patient-safety standards
Expansion of outpatient and specialty-care infrastructure

13.2 Market challenges

Supply chain complexity and component availability challenge
Regulatory compliance and documentation burden challenge
Healthcare budget pressures and procurement restrictions challenge

13.3 Impact of drivers and challenges

Impact of drivers and challenges in 2025 and 2030

13.4 Market opportunities

Growing adoption of integrated kitting and manufacturing models
Rising customization around procedure-specific clinical pathways
Increasing incorporation of digital pack management platforms

14. Competitive Landscape

14.1 Overview

14.2

Overview on criticality of inputs and factors of differentiation

14.3 Landscape disruption

Overview on factors of disruption

14.4 Industry risks

Impact of key risks on business

15. Competitive Analysis

15.1 Companies profiled

Companies covered

15.2 Company ranking index

15.3 Market positioning of companies

Matrix on companies position and classification

15.4 B.Braun SE

B.Braun SE - Overview
B.Braun SE - Product / Service
B.Braun SE - Key offerings
SWOT

15.5 Becton Dickinson and Co.

Becton Dickinson and Co. - Overview
Becton Dickinson and Co. - Business segments
Becton Dickinson and Co. - Key news
Becton Dickinson and Co. - Key offerings
Becton Dickinson and Co. - Segment focus
SWOT

15.6 Med italia Biomedica Srl

Med italia Biomedica Srl - Overview
Med italia Biomedica Srl - Product / Service
Med italia Biomedica Srl - Key offerings
SWOT

15.7 Medica Europe BV

Medica Europe BV - Overview
Medica Europe BV - Product / Service
Medica Europe BV - Key offerings
SWOT

15.8 Medtronic Plc

Medtronic Plc - Overview
Medtronic Plc - Business segments
Medtronic Plc - Key news
Medtronic Plc - Key offerings
Medtronic Plc - Segment focus
SWOT

15.9 Molnlycke Health Care AB

Molnlycke Health Care AB - Overview
Molnlycke Health Care AB - Product / Service
Molnlycke Health Care AB - Key offerings
SWOT

15.10 Multigate Medical Products Pty Ltd.

Multigate Medical Products Pty Ltd. - Overview
Multigate Medical Products Pty Ltd. - Product / Service
Multigate Medical Products Pty Ltd. - Key offerings
SWOT

15.11 Paul Hartmann AG

Paul Hartmann AG - Overview
Paul Hartmann AG - Business segments
Paul Hartmann AG - Key offerings
Paul Hartmann AG - Segment focus
SWOT

15.12 Pennine Healthcare

Pennine Healthcare - Overview
Pennine Healthcare - Product / Service
Pennine Healthcare - Key offerings
SWOT

15.13 Rocialle Healthcare Ltd.

Rocialle Healthcare Ltd. - Overview
Rocialle Healthcare Ltd. - Product / Service
Rocialle Healthcare Ltd. - Key offerings
SWOT

15.14 Solventum Corp.

Solventum Corp. - Overview
Solventum Corp. - Product / Service
Solventum Corp. - Key offerings
SWOT

15.15 STERIS plc

STERIS plc - Overview
STERIS plc - Business segments
STERIS plc - Key offerings
STERIS plc - Segment focus
SWOT

15.16 STS Medical Group

STS Medical Group - Overview
STS Medical Group - Product / Service
STS Medical Group - Key offerings
SWOT

15.17 Thermo Fisher Scientific Inc.

Thermo Fisher Scientific Inc. - Overview
Thermo Fisher Scientific Inc. - Business segments
Thermo Fisher Scientific Inc. - Key news
Thermo Fisher Scientific Inc. - Key offerings
Thermo Fisher Scientific Inc. - Segment focus
SWOT

15.18 Unisurge International Ltd

Unisurge International Ltd - Overview
Unisurge International Ltd - Product / Service
Unisurge International Ltd - Key offerings
SWOT

16. Appendix

16.1 Scope of the report

Market definition
Objectives
Notes and caveats

16.2 Inclusions and exclusions checklist

Inclusions checklist
Exclusions checklist

16.3 Currency conversion rates for US$

16.4 Research methodology

16.5 Data procurement

Information sources

16.6 Data validation

16.7 Validation techniques employed for market sizing

16.8 Data synthesis

16.9 360 degree market analysis

16.10 List of abbreviations

Research Methodology

Technavio presents a detailed picture of the market by way of study, synthesis, and summation of data from multiple sources. The analysts have presented the various facets of the market with a particular focus on identifying the key industry influencers. The data thus presented is comprehensive, reliable, and the result of extensive research, both primary and secondary.

INFORMATION SOURCES

Primary sources

  • Manufacturers and suppliers
  • Channel partners
  • Industry experts
  • Strategic decision makers

Secondary sources

  • Industry journals and periodicals
  • Government data
  • Financial reports of key industry players
  • Historical data
  • Press releases

DATA ANALYSIS

Data Synthesis

  • Collation of data
  • Estimation of key figures
  • Analysis of derived insights

Data Validation

  • Triangulation with data models
  • Reference against proprietary databases
  • Corroboration with industry experts

REPORT WRITING

Qualitative

  • Market drivers
  • Market challenges
  • Market trends
  • Five forces analysis

Quantitative

  • Market size and forecast
  • Market segmentation
  • Geographical insights
  • Competitive landscape

Interested in this report?

Get your sample now to see our research methodology and insights!

Download Now

Frequently Asked Questions

Custom Procedure Packs market growth will increase by USD 2539.8 million during 2026-2030.

The Custom Procedure Packs market is expected to grow at a CAGR of 5.1% during 2026-2030.

Custom Procedure Packs market is segmented by Type (Single use, Reusable) End-user (Hospitals, Ambulatory surgery centers, Specialty clinics, Others) Application (General surgery, Orthopedic, Cardiovascular, Ophthalmic, Others)

B.Braun SE, Becton Dickinson and Co., Kimal Group, Lohmann and Rauscher GmbH, Med italia Biomedica Srl, Medica Europe BV, Medtronic Plc, Molnlycke Health Care AB, Multigate Medical Products Pty Ltd., Paul Hartmann AG, Pennine Healthcare, Priontex, Rocialle Healthcare Ltd., Solventum Corp., STERIS plc, STS Medical Group, Thermo Fisher Scientific Inc., Unisurge International Ltd are a few of the key vendors in the Custom Procedure Packs market.

North America will register the highest growth rate of 42.6% among the other regions. Therefore, the Custom Procedure Packs market in North America is expected to garner significant business opportunities for the vendors during the forecast period.

US, Canada, Mexico, China, Japan, India, South Korea, Thailand, Indonesia, Germany, UK, France, Italy, Spain, The Netherlands, Brazil, Saudi Arabia, UAE, South Africa, Turkey, Argentina, Colombia, Israel

  • Growing procedural volumes across healthcare facilities is the driving factor this market.

The Custom Procedure Packs market vendors should focus on grabbing business opportunities from the Type segment as it accounted for the largest market share in the base year.
RIA - Research AI Assistant
Ask RIA
