Curriculum Development Service Market Analysis, Size, and Forecast 2026-2030: North America (US, Canada, and Mexico), APAC (China, India, and Japan), Europe (Germany, UK, and France), South America (Brazil and Argentina), Middle East and Africa (Saudi Arabia, UAE, and South Africa), and Rest of World (ROW)

Curriculum Development Service Market Analysis, Size, and Forecast 2026-2030:
North America (US, Canada, and Mexico), APAC (China, India, and Japan), Europe (Germany, UK, and France), South America (Brazil and Argentina), Middle East and Africa (Saudi Arabia, UAE, and South Africa), and Rest of World (ROW)

Published: May 2026 315 Pages SKU: IRTNTR81455

Market Overview at a Glance

$459 Mn
Market Opportunity
6%
CAGR 2025 - 2030
37.3%
North America Growth
$414.4 Mn
Online curriculum development segment 2024

Curriculum Development Service Market Size 2026-2030

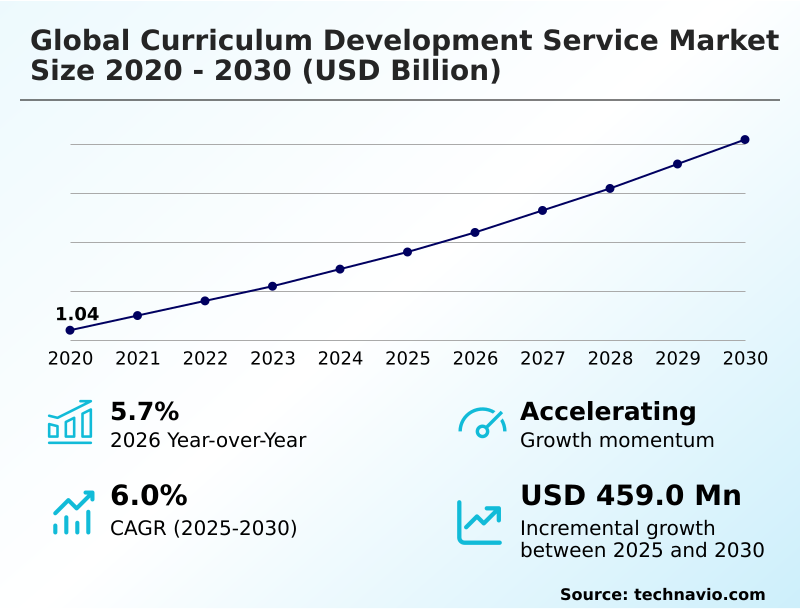
The curriculum development service market size is valued to increase by USD 459 million, at a CAGR of 6% from 2025 to 2030. Digital transformation and integration of intelligent technologies will drive the curriculum development service market.

Major Market Trends & Insights

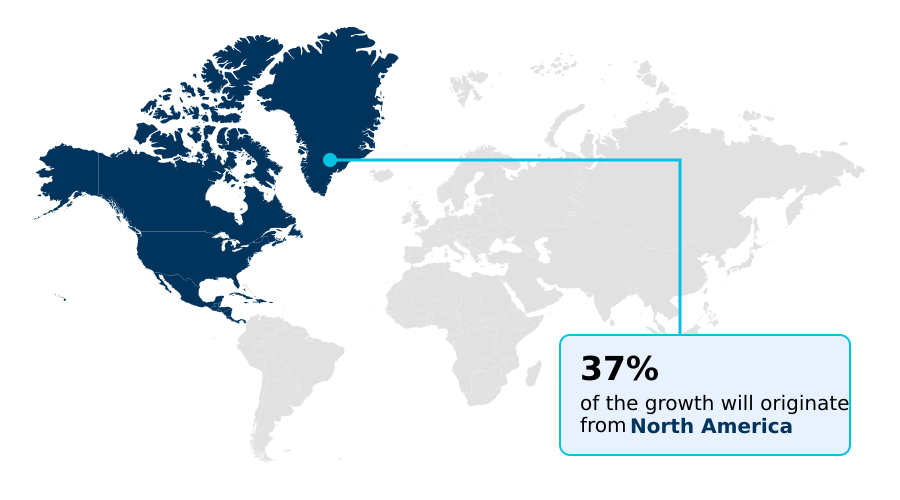
  • North America dominated the market and accounted for a 37.3% growth during the forecast period.
  • By Type - Online curriculum development segment was valued at USD 414.4 million in 2024
  • By End-user - Academic institutions segment accounted for the largest market revenue share in 2024

Market Size & Forecast

  • Market Opportunities: USD 778.8 million
  • Market Future Opportunities: USD 459 million
  • CAGR from 2025 to 2030 : 6%

Market Summary

  • The curriculum development service market is undergoing a significant evolution, driven by the dual needs of educational institutions and corporate entities for more effective learning solutions. Central to this market are robust pedagogical frameworks and advanced instructional design principles that shape the creation of digital learning modules and comprehensive assessment protocols.
  • The integration of adaptive learning technologies and gamification is becoming standard, enabling highly personalized learning pathways. For instance, a global corporation recently deployed an industry-aligned training module designed with evidence-based assessment criteria to upskill its workforce in data analytics. This initiative, built on micro-credentialing frameworks, not only addressed a critical skills gap but also improved its competency-based hiring practices.
  • The market's trajectory is toward creating dynamic, responsive educational ecosystems that leverage data-driven personalization and AI-assisted instructional design to meet the demands of lifelong learning. This requires a focus on stackable modules and digital badges, which provide verifiable credentials in a rapidly changing professional landscape, all while adhering to principles of Universal Design for Learning (UDL) to ensure accessibility.

What will be the Size of the Curriculum Development Service Market during the forecast period?

Get Key Insights on Market Forecast (PDF) Request Free Sample

How is the Curriculum Development Service Market Segmented?

The curriculum development service industry research report provides comprehensive data (region-wise segment analysis), with forecasts and estimates in "USD million" for the period 2026-2030, as well as historical data from 2020-2024 for the following segments.
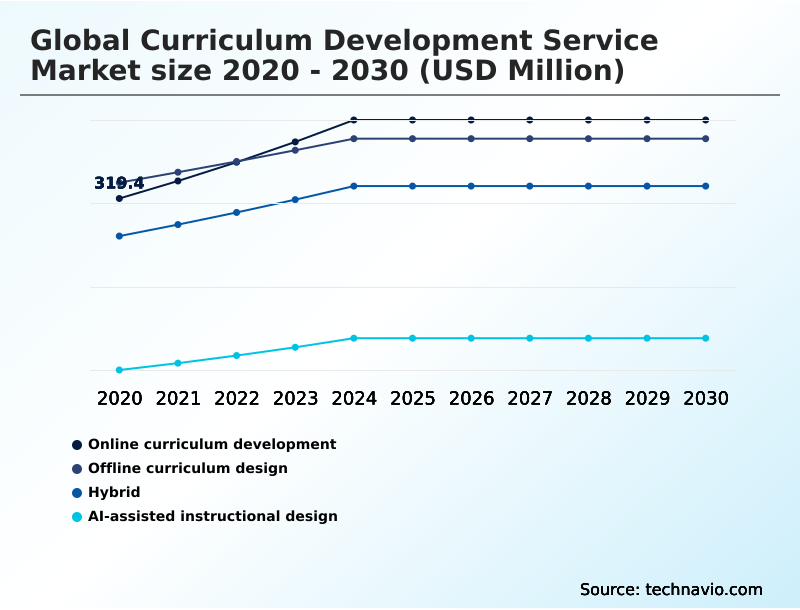
  • Type
    • Online curriculum development
    • Offline curriculum design
    • Hybrid
    • AI-assisted instructional design
  • End-user
    • Academic institutions
    • Corporate and enterprise training
    • Government
    • Others
  • Product
    • K-12 curriculum development
    • Higher education
    • Workforce training curriculum
    • Technical education
    • Others
  • Geography
    • North America
      • US
      • Canada
      • Mexico
    • APAC
      • China
      • India
      • Japan
    • Europe
      • Germany
      • UK
      • France
    • South America
      • Brazil
      • Argentina
    • Middle East and Africa
      • Saudi Arabia
      • UAE
      • South Africa
    • Rest of World (ROW)

By Type Insights

The online curriculum development segment is estimated to witness significant growth during the forecast period.

The market is segmented by delivery type, with online curriculum development being a prominent area. This segment's expansion is driven by the global move to remote learning, necessitating digital-first frameworks.

Service providers create digital learning modules and utilize multimedia learning elements to build engaging pathways compatible with various cloud-based learning management systems. These frameworks often incorporate AI-assisted curriculum framework and gamified instructional design.

A key advantage is the ability for asynchronous delivery methods, which have been shown to improve learner engagement by over 20%.

This approach also facilitates data-driven personalization and instant content updates, ensuring instructional materials remain current through dynamic content creation and recurring licensing fees for platforms that support digital courseware development and provide performance consulting services.

Request Free Sample

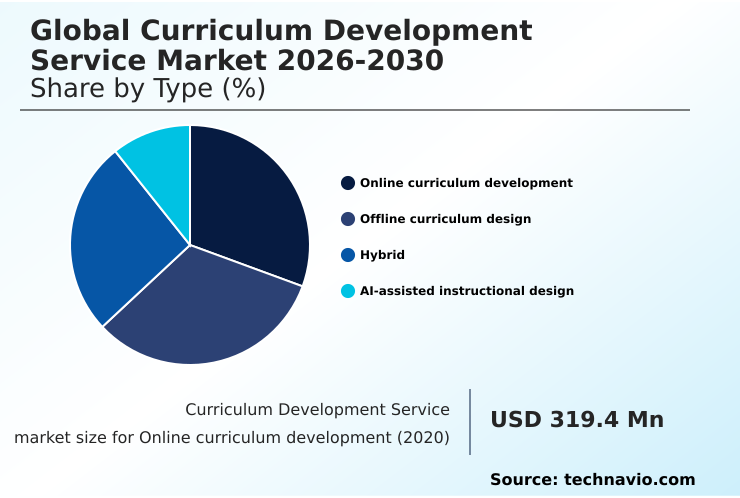
The Online curriculum development segment was valued at USD 414.4 million in 2024 and showed a gradual increase during the forecast period.

Request Free Sample

Regional Analysis

North America is estimated to contribute 37.3% to the growth of the global market during the forecast period.Technavio’s analysts have elaborately explained the regional trends and drivers that shape the market during the forecast period.

See How Curriculum Development Service Market Demand is Rising in North America Request Free Sample

The geographic landscape of the market is led by North America, which functions as a hub for innovation in educational technology, but high-growth opportunities are prominent in APAC.

In North America, the focus is on integrating virtual reality integration and adhering to national academic standards alignment, with some districts reporting a 15% improvement in student outcomes after adopting new digital curricula.

Meanwhile, the APAC market is expanding rapidly due to government investments in education, with a focus on mobile learning content and digital literacy integration.

In Europe, GDPR compliance in education adds a layer of complexity, increasing development costs by an estimated 10% for platforms using adaptive learning. Key activities include curriculum mapping tools, creating standards-aligned instructional materials, and applying cognitive science application to design.

The regional variances necessitate a sophisticated approach to curriculum localization for global markets and designing modules for lifelong learning.

Market Dynamics

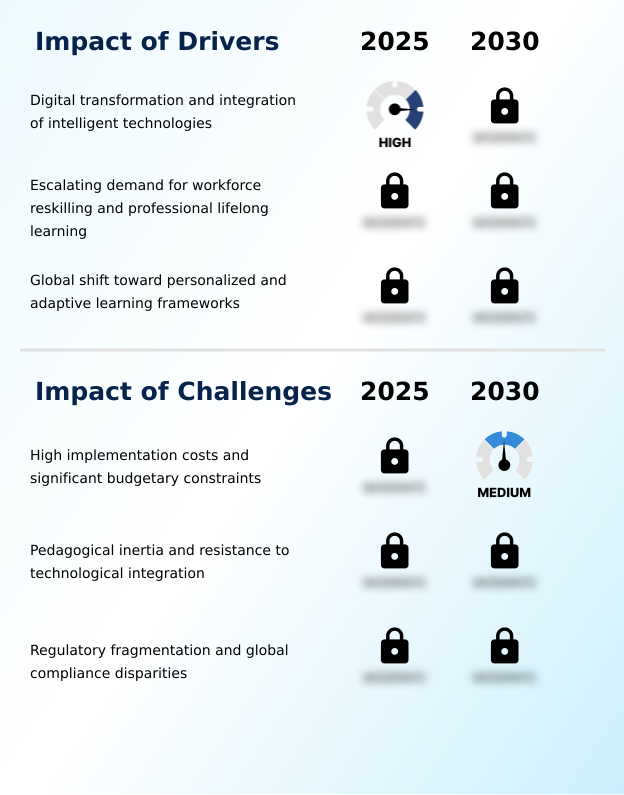
Our researchers analyzed the data with 2025 as the base year, along with the key drivers, trends, and challenges. A holistic analysis of drivers will help companies refine their marketing strategies to gain a competitive advantage.

  • Modern educational strategy is centered on designing curriculum for digital transformation, where the use of generative AI for personalized learning is becoming a key differentiator. Organizations are focusing on curriculum development for workforce reskilling to address critical skills gaps, with adaptive learning in corporate training leading to more efficient employee development.
  • The rise of micro-credentialing for professional development is reshaping career paths, while ESG integration in K-12 curriculum prepares the next generation for global challenges. In higher education, implementing UDL principles in higher education is crucial for accessibility. Service providers are creating curriculum frameworks for skills gap analysis and employing data-driven curriculum design to optimize learning outcomes.
  • Furthermore, the use of gamification in employee training has been shown to increase engagement significantly. Other key areas include developing competency-based curriculum for vocational training and hybrid learning curriculum models. The adoption of AI-assisted instructional design tools is streamlining content creation, while curriculum localization for global markets is essential for global reach.
  • Firms that focus on aligning curriculum with industry standards report a nearly twofold increase in talent retention compared to those with generic programs. This extends to creating accessible instructional materials, developing curriculum for technical education, designing modules for lifelong learning, creating curriculum for sustainability education, and integrating social-emotional learning in curriculum.

What are the key market drivers leading to the rise in the adoption of Curriculum Development Service Industry?

  • The market is primarily driven by the ongoing digital transformation across industries and the corresponding integration of intelligent technologies into learning frameworks.

  • Market growth is significantly driven by the widespread digital transformation compelling organizations to adopt dynamic, digital-first curriculum frameworks.
  • The widening global skills gap necessitates continuous professional development through reskilling and upskilling solutions, leading to a surge in demand for industry-aligned training modules.
  • The use of artificial intelligence, machine learning in education, and virtual reality integration allows for the creation of highly personalized learning experiences. For example, adaptive learning algorithms have been shown to improve learning efficiency by over 30% in corporate settings.
  • This personalization is further enhanced by applying educational psychology principles and creating simulation-based learning tools. The push for competency-based hiring practices has also boosted the adoption of micro-credentials and lifelong learning platforms, supported by technologies enabling remote team training.

What are the market trends shaping the Curriculum Development Service Industry?

  • The integration of generative AI within instructional design is emerging as a significant market trend. This development is reshaping how educational content is created and personalized for learners.

  • Key market trends are redefining educational content creation through technological innovation. The rise of generative AI in instructional design is enabling the development of personalized learning pathways and modular curriculum structures at an unprecedented scale, with some platforms reducing content generation time by over 40%. This shift supports the expansion of micro-credentialing frameworks and ESG principles integration into core subjects.
  • This trend is accompanied by the growth of interdisciplinary project design and the use of mobile learning content. Consequently, the role of educators is evolving toward pedagogical validation process oversight. Organizations are also focusing on workforce learning design, interactive learning strategies, and ethical AI in curriculum, with some achieving a 25% increase in learner retention through these methods.

What challenges does the Curriculum Development Service Industry face during its growth?

  • High implementation costs and significant budgetary constraints pose a key challenge, affecting the growth and adoption of advanced curriculum development services.

  • The market faces considerable challenges, primarily the high implementation costs of transitioning to sophisticated digital-first frameworks. Many institutions struggle with the initial capital for high-security data infrastructures, with deployment costs sometimes exceeding budgets by up to 50%.
  • A second challenge is pedagogical inertia and resistance to change from educators unfamiliar with an AI-assisted curriculum framework, which can slow adoption rates by as much as 60% in the first year. Regulatory fragmentation, including varied national academic standards alignment and stringent GDPR compliance in education, complicates global scalability.
  • Service providers must navigate these issues by offering user-centric instructional design, change management for educators, and clear talent management consulting while ensuring neurodivergent learner support and utilizing learning experience platforms to ease the transition.

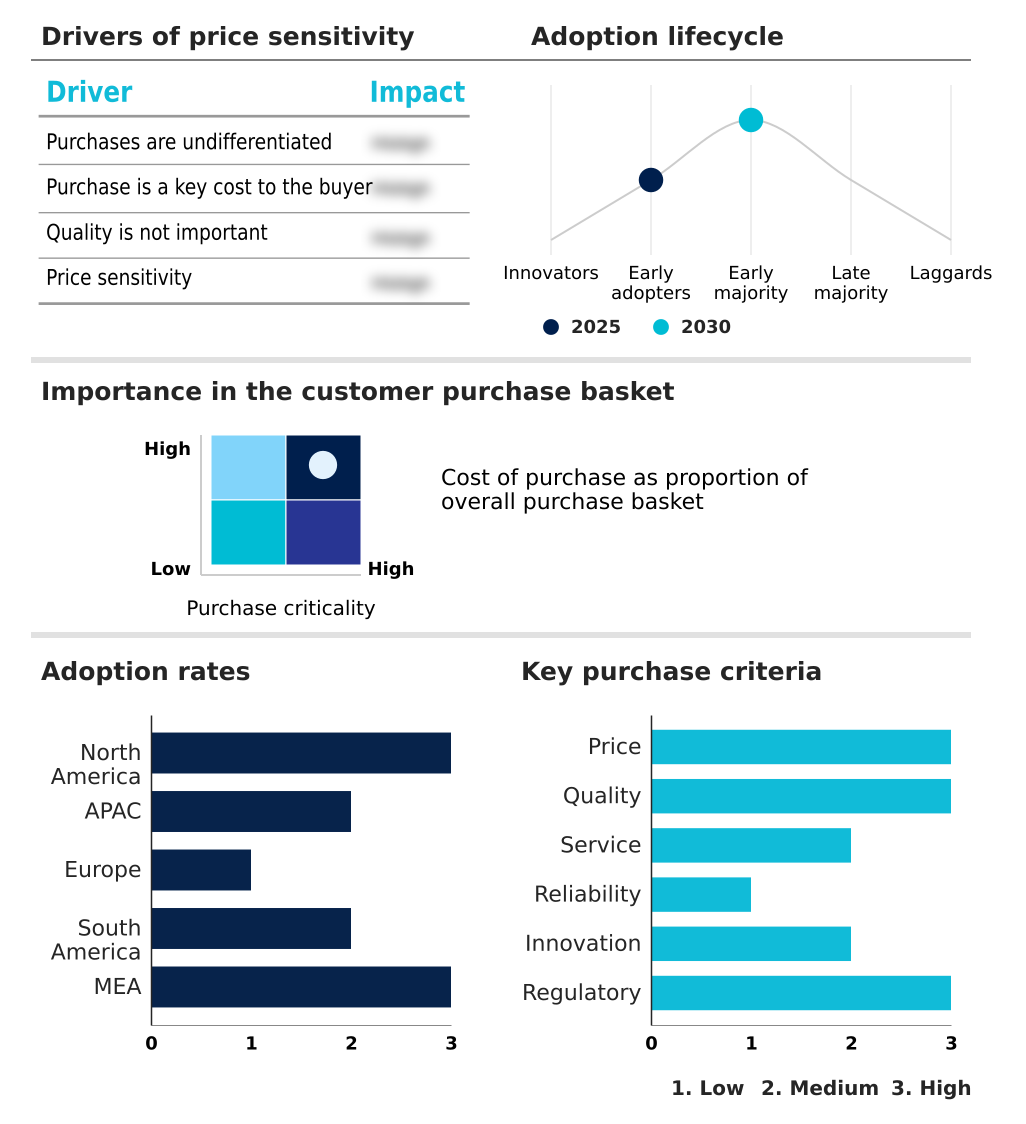
Exclusive Technavio Analysis on Customer Landscape

The curriculum development service market forecasting report includes the adoption lifecycle of the market, covering from the innovator’s stage to the laggard’s stage. It focuses on adoption rates in different regions based on penetration. Furthermore, the curriculum development service market report also includes key purchase criteria and drivers of price sensitivity to help companies evaluate and develop their market growth analysis strategies.

Customer Landscape of Curriculum Development Service Industry

Competitive Landscape

Companies are implementing various strategies, such as strategic alliances, curriculum development service market forecast, partnerships, mergers and acquisitions, geographical expansion, and product/service launches, to enhance their presence in the industry.

Allen Interactions Inc. - Delivers customized curriculum design and performance-driven learning programs focused on achieving specific organizational goals through strategic instructional planning.

The industry research and growth report includes detailed analyses of the competitive landscape of the market and information about key companies, including:

  • Allen Interactions Inc.
  • Aptara Inc.
  • Cengage Learning Inc.
  • CommLab India LLP
  • CoreAxis
  • Designing Digitally Inc.
  • EI Design Pvt. Ltd.
  • GP Strategies Corp.
  • Houghton Mifflin Harcourt Co.
  • Hurix System Pvt. Ltd.
  • InfoPro Learning Inc.
  • John Wiley and Sons Inc.
  • Learning Pool
  • Leo Learning Inc
  • McGraw Hill LLC
  • Mind Tools Ltd.
  • MPS Ltd.
  • NIIT Ltd.
  • Pearson Plc
  • Scholastic Corp.

Qualitative and quantitative analysis of companies has been conducted to help clients understand the wider business environment as well as the strengths and weaknesses of key industry players. Data is qualitatively analyzed to categorize companies as pure play, category-focused, industry-focused, and diversified; it is quantitatively analyzed to categorize companies as dominant, leading, strong, tentative, and weak.

Recent Development and News in Curriculum development service market

  • In May 2025, the United States Department of Education released a comprehensive set of guidelines for the use of automated systems in instructional design, emphasizing the need for human-in-the-loop verification.
  • In October 2025, the European Labour Authority introduced a strategic initiative to harmonize vocational training curricula across the European Union to address regional labor shortages and facilitate worker mobility.
  • In August 2025, a consortium of leading European universities and technology firms announced the Euro-Skill Initiative, a unified curriculum framework for professional certifications in cybersecurity and data science.
  • In March 2025, the New York City Department of Education implemented a new personalized learning curriculum for middle school mathematics, developed by specialized firms to address diverse student needs in urban settings.

Dive into Technavio’s robust research methodology, blending expert interviews, extensive data synthesis, and validated models for unparalleled Curriculum Development Service Market insights. See full methodology.

Market Scope
Page number 315
Base year 2025
Historic period 2020-2024
Forecast period 2026-2030
Growth momentum & CAGR Accelerate at a CAGR of 6%
Market growth 2026-2030 USD 459.0 million
Market structure Fragmented
YoY growth 2025-2026(%) 5.7%
Key countries US, Canada, Mexico, China, India, Japan, Australia, South Korea, Indonesia, Germany, UK, France, Italy, Spain, The Netherlands, Brazil, Argentina, Chile, Saudi Arabia, UAE, South Africa, Egypt and Turkey
Competitive landscape Leading Companies, Market Positioning of Companies, Competitive Strategies, and Industry Risks

Request Free Sample

Research Analyst Overview

  • The curriculum development service market is defined by its rapid adoption of technology to create sophisticated learning experiences. Key components include robust pedagogical frameworks, detailed instructional design principles, and the creation of digital learning modules supported by rigorous assessment protocols.
  • Boardroom decisions are increasingly influenced by the need to implement reskilling and upskilling solutions, with a focus on industry-aligned training modules and personalized learning pathways. The integration of adaptive learning technologies, gamification, and generative AI in instructional design is no longer a niche but a core offering.
  • For example, the use of an AI-assisted curriculum framework has been shown to reduce content development time by up to 35%. This efficiency allows for the creation of dynamic content creation and supports competency-based frameworks. Other critical elements include stackable modules, evidence-based assessment, digital badges, ESG principles integration, and data-driven personalization.
  • These are delivered via cloud-based learning management systems that require human-in-the-loop verification to ensure quality and adherence to Universal Design for Learning (UDL) standards, especially as micro-credentialing frameworks become more prevalent.

What are the Key Data Covered in this Curriculum Development Service Market Research and Growth Report?

  • What is the expected growth of the Curriculum Development Service Market between 2026 and 2030?

    • USD 459 million, at a CAGR of 6%

  • What segmentation does the market report cover?

    • The report is segmented by Type (Online curriculum development, Offline curriculum design, Hybrid, and AI-assisted instructional design), End-user (Academic institutions, Corporate and enterprise training, Government, and Others), Product (K-12 curriculum development, Higher education, Workforce training curriculum, Technical education, and Others) and Geography (North America, APAC, Europe, South America, Middle East and Africa)

  • Which regions are analyzed in the report?

    • North America, APAC, Europe, South America and Middle East and Africa

  • What are the key growth drivers and market challenges?

    • Digital transformation and integration of intelligent technologies, High implementation costs and significant budgetary constraints

  • Who are the major players in the Curriculum Development Service Market?

    • Allen Interactions Inc., Aptara Inc., Cengage Learning Inc., CommLab India LLP, CoreAxis, Designing Digitally Inc., EI Design Pvt. Ltd., GP Strategies Corp., Houghton Mifflin Harcourt Co., Hurix System Pvt. Ltd., InfoPro Learning Inc., John Wiley and Sons Inc., Learning Pool, Leo Learning Inc, McGraw Hill LLC, Mind Tools Ltd., MPS Ltd., NIIT Ltd., Pearson Plc and Scholastic Corp.

Market Research Insights

  • The market's dynamic nature is shaped by the rapid adoption of curriculum-as-a-service models, which offer greater flexibility than traditional content purchasing. Organizations leveraging these models report up to a 30% reduction in the time required to deploy new training programs.
  • The shift toward lifelong learning platforms supports this trend, with asynchronous delivery methods increasing learner completion rates by an average of 25% across corporate training programs. Furthermore, the focus on pedagogical validation processes ensures that digital content is effective.
  • The implementation of harmonized curriculum standards across regions is also streamlining content development, allowing for more efficient multilingual curriculum support and cultural content localization to meet diverse learner needs.

We can help! Our analysts can customize this curriculum development service market research report to meet your requirements.

Get in touch

1. Executive Summary

1.1 Market overview

Executive Summary - Chart on Market Overview
Executive Summary - Data Table on Market Overview
Executive Summary - Chart on Global Market Characteristics
Executive Summary - Chart on Market by Geography
Executive Summary - Chart on Market Segmentation by Type
Executive Summary - Chart on Market Segmentation by End-user
Executive Summary - Chart on Market Segmentation by Product
Executive Summary - Chart on Incremental Growth
Executive Summary - Data Table on Incremental Growth
Executive Summary - Chart on Company Market Positioning

2. Technavio Analysis

2.1 Analysis of price sensitivity, lifecycle, customer purchase basket, adoption rates, and purchase criteria

2.2 Criticality of inputs and Factors of differentiation

Chart on Overview on criticality of inputs and factors of differentiation

2.3 Factors of disruption

Chart on Overview on factors of disruption

2.4 Impact of drivers and challenges

Chart on Impact of drivers and challenges in 2025 and 2030

3. Market Landscape

3.1 Market ecosystem

Chart on Parent Market
Data Table on - Parent Market

3.2 Market characteristics

Chart on Market characteristics analysis

3.3 Value chain analysis

Chart on Value chain analysis

4. Market Sizing

4.1 Market definition

Data Table on Offerings of companies included in the market definition

4.2 Market segment analysis

Market segments

4.3 Market size 2025

4.4 Market outlook: Forecast for 2025-2030

Chart on Global - Market size and forecast 2025-2030 ($ million)
Data Table on Global - Market size and forecast 2025-2030 ($ million)
Chart on Global Market: Year-over-year growth 2025-2030 (%)
Data Table on Global Market: Year-over-year growth 2025-2030 (%)

5. Historic Market Size

5.1 Global Curriculum Development Service Market 2020 - 2024

Historic Market Size - Data Table on Global Curriculum Development Service Market 2020 - 2024 ($ million)

5.2 Type segment analysis 2020 - 2024

Historic Market Size - Type Segment 2020 - 2024 ($ million)

5.3 End-user segment analysis 2020 - 2024

Historic Market Size - End-user Segment 2020 - 2024 ($ million)

5.4 Product segment analysis 2020 - 2024

Historic Market Size - Product Segment 2020 - 2024 ($ million)

5.5 Geography segment analysis 2020 - 2024

Historic Market Size - Geography Segment 2020 - 2024 ($ million)

5.6 Country segment analysis 2020 - 2024

Historic Market Size - Country Segment 2020 - 2024 ($ million)

6. Qualitative Analysis

6.1 Impact of AI on Global Curriculum Development Service Market

6.2 Impact of geopolitical conflicts on Global Curriculum Development Service Market

7. Five Forces Analysis

7.1 Five forces summary

Five forces analysis - Comparison between 2025 and 2030

7.2 Bargaining power of buyers

Bargaining power of buyers - Impact of key factors 2025 and 2030

7.3 Bargaining power of suppliers

Bargaining power of suppliers - Impact of key factors in 2025 and 2030

7.4 Threat of new entrants

Threat of new entrants - Impact of key factors in 2025 and 2030

7.5 Threat of substitutes

Threat of substitutes - Impact of key factors in 2025 and 2030

7.6 Threat of rivalry

Threat of rivalry - Impact of key factors in 2025 and 2030

7.7 Market condition

Chart on Market condition - Five forces 2025 and 2030

8. Market Segmentation by Type

8.1 Market segments

Chart on Type - Market share 2025-2030 (%)
Data Table on Type - Market share 2025-2030 (%)

8.2 Comparison by Type

Chart on Comparison by Type
Data Table on Comparison by Type

8.3 Online curriculum development - Market size and forecast 2025-2030

Chart on Online curriculum development - Market size and forecast 2025-2030 ($ million)
Data Table on Online curriculum development - Market size and forecast 2025-2030 ($ million)
Chart on Online curriculum development - Year-over-year growth 2025-2030 (%)
Data Table on Online curriculum development - Year-over-year growth 2025-2030 (%)

8.4 Offline curriculum design - Market size and forecast 2025-2030

Chart on Offline curriculum design - Market size and forecast 2025-2030 ($ million)
Data Table on Offline curriculum design - Market size and forecast 2025-2030 ($ million)
Chart on Offline curriculum design - Year-over-year growth 2025-2030 (%)
Data Table on Offline curriculum design - Year-over-year growth 2025-2030 (%)

8.5 Hybrid - Market size and forecast 2025-2030

Chart on Hybrid - Market size and forecast 2025-2030 ($ million)
Data Table on Hybrid - Market size and forecast 2025-2030 ($ million)
Chart on Hybrid - Year-over-year growth 2025-2030 (%)
Data Table on Hybrid - Year-over-year growth 2025-2030 (%)

8.6 AI-assisted instructional design - Market size and forecast 2025-2030

Chart on AI-assisted instructional design - Market size and forecast 2025-2030 ($ million)
Data Table on AI-assisted instructional design - Market size and forecast 2025-2030 ($ million)
Chart on AI-assisted instructional design - Year-over-year growth 2025-2030 (%)
Data Table on AI-assisted instructional design - Year-over-year growth 2025-2030 (%)

8.7 Market opportunity by Type

Market opportunity by Type ($ million)
Data Table on Market opportunity by Type ($ million)

9. Market Segmentation by End-user

9.1 Market segments

Chart on End-user - Market share 2025-2030 (%)
Data Table on End-user - Market share 2025-2030 (%)

9.2 Comparison by End-user

Chart on Comparison by End-user
Data Table on Comparison by End-user

9.3 Academic institutions - Market size and forecast 2025-2030

Chart on Academic institutions - Market size and forecast 2025-2030 ($ million)
Data Table on Academic institutions - Market size and forecast 2025-2030 ($ million)
Chart on Academic institutions - Year-over-year growth 2025-2030 (%)
Data Table on Academic institutions - Year-over-year growth 2025-2030 (%)

9.4 Corporate and enterprise training - Market size and forecast 2025-2030

Chart on Corporate and enterprise training - Market size and forecast 2025-2030 ($ million)
Data Table on Corporate and enterprise training - Market size and forecast 2025-2030 ($ million)
Chart on Corporate and enterprise training - Year-over-year growth 2025-2030 (%)
Data Table on Corporate and enterprise training - Year-over-year growth 2025-2030 (%)

9.5 Government - Market size and forecast 2025-2030

Chart on Government - Market size and forecast 2025-2030 ($ million)
Data Table on Government - Market size and forecast 2025-2030 ($ million)
Chart on Government - Year-over-year growth 2025-2030 (%)
Data Table on Government - Year-over-year growth 2025-2030 (%)

9.6 Others - Market size and forecast 2025-2030

Chart on Others - Market size and forecast 2025-2030 ($ million)
Data Table on Others - Market size and forecast 2025-2030 ($ million)
Chart on Others - Year-over-year growth 2025-2030 (%)
Data Table on Others - Year-over-year growth 2025-2030 (%)

9.7 Market opportunity by End-user

Market opportunity by End-user ($ million)
Data Table on Market opportunity by End-user ($ million)

10. Market Segmentation by Product

10.1 Market segments

Chart on Product - Market share 2025-2030 (%)
Data Table on Product - Market share 2025-2030 (%)

10.2 Comparison by Product

Chart on Comparison by Product
Data Table on Comparison by Product

10.3 K-12 curriculum development - Market size and forecast 2025-2030

Chart on K-12 curriculum development - Market size and forecast 2025-2030 ($ million)
Data Table on K-12 curriculum development - Market size and forecast 2025-2030 ($ million)
Chart on K-12 curriculum development - Year-over-year growth 2025-2030 (%)
Data Table on K-12 curriculum development - Year-over-year growth 2025-2030 (%)

10.4 Higher education - Market size and forecast 2025-2030

Chart on Higher education - Market size and forecast 2025-2030 ($ million)
Data Table on Higher education - Market size and forecast 2025-2030 ($ million)
Chart on Higher education - Year-over-year growth 2025-2030 (%)
Data Table on Higher education - Year-over-year growth 2025-2030 (%)

10.5 Workforce training curriculum - Market size and forecast 2025-2030

Chart on Workforce training curriculum - Market size and forecast 2025-2030 ($ million)
Data Table on Workforce training curriculum - Market size and forecast 2025-2030 ($ million)
Chart on Workforce training curriculum - Year-over-year growth 2025-2030 (%)
Data Table on Workforce training curriculum - Year-over-year growth 2025-2030 (%)

10.6 Technical education - Market size and forecast 2025-2030

Chart on Technical education - Market size and forecast 2025-2030 ($ million)
Data Table on Technical education - Market size and forecast 2025-2030 ($ million)
Chart on Technical education - Year-over-year growth 2025-2030 (%)
Data Table on Technical education - Year-over-year growth 2025-2030 (%)

10.7 Others - Market size and forecast 2025-2030

Chart on Others - Market size and forecast 2025-2030 ($ million)
Data Table on Others - Market size and forecast 2025-2030 ($ million)
Chart on Others - Year-over-year growth 2025-2030 (%)
Data Table on Others - Year-over-year growth 2025-2030 (%)

10.8 Market opportunity by Product

Market opportunity by Product ($ million)
Data Table on Market opportunity by Product ($ million)

11. Customer Landscape

11.1 Customer landscape overview

Analysis of price sensitivity, lifecycle, customer purchase basket, adoption rates, and purchase criteria

12. Geographic Landscape

12.1 Geographic segmentation

Chart on Market share by geography 2025-2030 (%)
Data Table on Market share by geography 2025-2030 (%)

12.2 Geographic comparison

Chart on Geographic comparison
Data Table on Geographic comparison

12.3 North America - Market size and forecast 2025-2030

Chart on North America - Market size and forecast 2025-2030 ($ million)
Data Table on North America - Market size and forecast 2025-2030 ($ million)
Chart on North America - Year-over-year growth 2025-2030 (%)
Data Table on North America - Year-over-year growth 2025-2030 (%)
Chart on Regional Comparison - North America
Data Table on Regional Comparison - North America

12.3.1 US - Market size and forecast 2025-2030

Chart on US - Market size and forecast 2025-2030 ($ million)
Data Table on US - Market size and forecast 2025-2030 ($ million)
Chart on US - Year-over-year growth 2025-2030 (%)
Data Table on US - Year-over-year growth 2025-2030 (%)

12.3.2 Canada - Market size and forecast 2025-2030

Chart on Canada - Market size and forecast 2025-2030 ($ million)
Data Table on Canada - Market size and forecast 2025-2030 ($ million)
Chart on Canada - Year-over-year growth 2025-2030 (%)
Data Table on Canada - Year-over-year growth 2025-2030 (%)

12.3.3 Mexico - Market size and forecast 2025-2030

Chart on Mexico - Market size and forecast 2025-2030 ($ million)
Data Table on Mexico - Market size and forecast 2025-2030 ($ million)
Chart on Mexico - Year-over-year growth 2025-2030 (%)
Data Table on Mexico - Year-over-year growth 2025-2030 (%)

12.4 APAC - Market size and forecast 2025-2030

Chart on APAC - Market size and forecast 2025-2030 ($ million)
Data Table on APAC - Market size and forecast 2025-2030 ($ million)
Chart on APAC - Year-over-year growth 2025-2030 (%)
Data Table on APAC - Year-over-year growth 2025-2030 (%)
Chart on Regional Comparison - APAC
Data Table on Regional Comparison - APAC

12.4.1 China - Market size and forecast 2025-2030

Chart on China - Market size and forecast 2025-2030 ($ million)
Data Table on China - Market size and forecast 2025-2030 ($ million)
Chart on China - Year-over-year growth 2025-2030 (%)
Data Table on China - Year-over-year growth 2025-2030 (%)

12.4.2 India - Market size and forecast 2025-2030

Chart on India - Market size and forecast 2025-2030 ($ million)
Data Table on India - Market size and forecast 2025-2030 ($ million)
Chart on India - Year-over-year growth 2025-2030 (%)
Data Table on India - Year-over-year growth 2025-2030 (%)

12.4.3 Japan - Market size and forecast 2025-2030

Chart on Japan - Market size and forecast 2025-2030 ($ million)
Data Table on Japan - Market size and forecast 2025-2030 ($ million)
Chart on Japan - Year-over-year growth 2025-2030 (%)
Data Table on Japan - Year-over-year growth 2025-2030 (%)

12.4.4 Australia - Market size and forecast 2025-2030

Chart on Australia - Market size and forecast 2025-2030 ($ million)
Data Table on Australia - Market size and forecast 2025-2030 ($ million)
Chart on Australia - Year-over-year growth 2025-2030 (%)
Data Table on Australia - Year-over-year growth 2025-2030 (%)

12.4.5 South Korea - Market size and forecast 2025-2030

Chart on South Korea - Market size and forecast 2025-2030 ($ million)
Data Table on South Korea - Market size and forecast 2025-2030 ($ million)
Chart on South Korea - Year-over-year growth 2025-2030 (%)
Data Table on South Korea - Year-over-year growth 2025-2030 (%)

12.4.6 Indonesia - Market size and forecast 2025-2030

Chart on Indonesia - Market size and forecast 2025-2030 ($ million)
Data Table on Indonesia - Market size and forecast 2025-2030 ($ million)
Chart on Indonesia - Year-over-year growth 2025-2030 (%)
Data Table on Indonesia - Year-over-year growth 2025-2030 (%)

12.5 Europe - Market size and forecast 2025-2030

Chart on Europe - Market size and forecast 2025-2030 ($ million)
Data Table on Europe - Market size and forecast 2025-2030 ($ million)
Chart on Europe - Year-over-year growth 2025-2030 (%)
Data Table on Europe - Year-over-year growth 2025-2030 (%)
Chart on Regional Comparison - Europe
Data Table on Regional Comparison - Europe

12.5.1 Germany - Market size and forecast 2025-2030

Chart on Germany - Market size and forecast 2025-2030 ($ million)
Data Table on Germany - Market size and forecast 2025-2030 ($ million)
Chart on Germany - Year-over-year growth 2025-2030 (%)
Data Table on Germany - Year-over-year growth 2025-2030 (%)

12.5.2 UK - Market size and forecast 2025-2030

Chart on UK - Market size and forecast 2025-2030 ($ million)
Data Table on UK - Market size and forecast 2025-2030 ($ million)
Chart on UK - Year-over-year growth 2025-2030 (%)
Data Table on UK - Year-over-year growth 2025-2030 (%)

12.5.3 France - Market size and forecast 2025-2030

Chart on France - Market size and forecast 2025-2030 ($ million)
Data Table on France - Market size and forecast 2025-2030 ($ million)
Chart on France - Year-over-year growth 2025-2030 (%)
Data Table on France - Year-over-year growth 2025-2030 (%)

12.5.4 Italy - Market size and forecast 2025-2030

Chart on Italy - Market size and forecast 2025-2030 ($ million)
Data Table on Italy - Market size and forecast 2025-2030 ($ million)
Chart on Italy - Year-over-year growth 2025-2030 (%)
Data Table on Italy - Year-over-year growth 2025-2030 (%)

12.5.5 Spain - Market size and forecast 2025-2030

Chart on Spain - Market size and forecast 2025-2030 ($ million)
Data Table on Spain - Market size and forecast 2025-2030 ($ million)
Chart on Spain - Year-over-year growth 2025-2030 (%)
Data Table on Spain - Year-over-year growth 2025-2030 (%)

12.5.6 The Netherlands - Market size and forecast 2025-2030

Chart on The Netherlands - Market size and forecast 2025-2030 ($ million)
Data Table on The Netherlands - Market size and forecast 2025-2030 ($ million)
Chart on The Netherlands - Year-over-year growth 2025-2030 (%)
Data Table on The Netherlands - Year-over-year growth 2025-2030 (%)

12.6 South America - Market size and forecast 2025-2030

Chart on South America - Market size and forecast 2025-2030 ($ million)
Data Table on South America - Market size and forecast 2025-2030 ($ million)
Chart on South America - Year-over-year growth 2025-2030 (%)
Data Table on South America - Year-over-year growth 2025-2030 (%)
Chart on Regional Comparison - South America
Data Table on Regional Comparison - South America

12.6.1 Brazil - Market size and forecast 2025-2030

Chart on Brazil - Market size and forecast 2025-2030 ($ million)
Data Table on Brazil - Market size and forecast 2025-2030 ($ million)
Chart on Brazil - Year-over-year growth 2025-2030 (%)
Data Table on Brazil - Year-over-year growth 2025-2030 (%)

12.6.2 Argentina - Market size and forecast 2025-2030

Chart on Argentina - Market size and forecast 2025-2030 ($ million)
Data Table on Argentina - Market size and forecast 2025-2030 ($ million)
Chart on Argentina - Year-over-year growth 2025-2030 (%)
Data Table on Argentina - Year-over-year growth 2025-2030 (%)

12.6.3 Chile - Market size and forecast 2025-2030

Chart on Chile - Market size and forecast 2025-2030 ($ million)
Data Table on Chile - Market size and forecast 2025-2030 ($ million)
Chart on Chile - Year-over-year growth 2025-2030 (%)
Data Table on Chile - Year-over-year growth 2025-2030 (%)

12.7 Middle East and Africa - Market size and forecast 2025-2030

Chart on Middle East and Africa - Market size and forecast 2025-2030 ($ million)
Data Table on Middle East and Africa - Market size and forecast 2025-2030 ($ million)
Chart on Middle East and Africa - Year-over-year growth 2025-2030 (%)
Data Table on Middle East and Africa - Year-over-year growth 2025-2030 (%)
Chart on Regional Comparison - Middle East and Africa
Data Table on Regional Comparison - Middle East and Africa

12.7.1 Saudi Arabia - Market size and forecast 2025-2030

Chart on Saudi Arabia - Market size and forecast 2025-2030 ($ million)
Data Table on Saudi Arabia - Market size and forecast 2025-2030 ($ million)
Chart on Saudi Arabia - Year-over-year growth 2025-2030 (%)
Data Table on Saudi Arabia - Year-over-year growth 2025-2030 (%)

12.7.2 UAE - Market size and forecast 2025-2030

Chart on UAE - Market size and forecast 2025-2030 ($ million)
Data Table on UAE - Market size and forecast 2025-2030 ($ million)
Chart on UAE - Year-over-year growth 2025-2030 (%)
Data Table on UAE - Year-over-year growth 2025-2030 (%)

12.7.3 South Africa - Market size and forecast 2025-2030

Chart on South Africa - Market size and forecast 2025-2030 ($ million)
Data Table on South Africa - Market size and forecast 2025-2030 ($ million)
Chart on South Africa - Year-over-year growth 2025-2030 (%)
Data Table on South Africa - Year-over-year growth 2025-2030 (%)

12.7.4 Egypt - Market size and forecast 2025-2030

Chart on Egypt - Market size and forecast 2025-2030 ($ million)
Data Table on Egypt - Market size and forecast 2025-2030 ($ million)
Chart on Egypt - Year-over-year growth 2025-2030 (%)
Data Table on Egypt - Year-over-year growth 2025-2030 (%)

12.7.5 Turkey - Market size and forecast 2025-2030

Chart on Turkey - Market size and forecast 2025-2030 ($ million)
Data Table on Turkey - Market size and forecast 2025-2030 ($ million)
Chart on Turkey - Year-over-year growth 2025-2030 (%)
Data Table on Turkey - Year-over-year growth 2025-2030 (%)

12.8 Market opportunity by geography

Market opportunity by geography ($ million)
Data Tables on Market opportunity by geography ($ million)

13. Drivers, Challenges, and Opportunity

13.1 Market drivers

Digital transformation and integration of intelligent technologies
Escalating demand for workforce reskilling and professional lifelong learning
Global shift toward personalized and adaptive learning frameworks

13.2 Market challenges

High implementation costs and significant budgetary constraints
Pedagogical inertia and resistance to technological integration
Regulatory fragmentation and global compliance disparities

13.3 Impact of drivers and challenges

Impact of drivers and challenges in 2025 and 2030

13.4 Market opportunities

Integration of generative AI in instructional design
Expansion of micro-credentialing and competency-based frameworks
Rise of sustainability and global citizenship in core curricula

14. Competitive Landscape

14.1 Overview

14.2

Overview on criticality of inputs and factors of differentiation

14.3 Landscape disruption

Overview on factors of disruption

14.4 Industry risks

Impact of key risks on business

15. Competitive Analysis

15.1 Companies profiled

Companies covered

15.2 Company ranking index

15.3 Market positioning of companies

Matrix on companies position and classification

15.4 Allen Interactions Inc.

Allen Interactions Inc. - Overview
Allen Interactions Inc. - Product / Service
Allen Interactions Inc. - Key offerings
SWOT

15.5 Aptara Inc.

Aptara Inc. - Overview
Aptara Inc. - Product / Service
Aptara Inc. - Key offerings
SWOT

15.6 Cengage Learning Inc.

Cengage Learning Inc. - Overview
Cengage Learning Inc. - Product / Service
Cengage Learning Inc. - Key offerings
SWOT

15.7 CommLab India LLP

CommLab India LLP - Overview
CommLab India LLP - Product / Service
CommLab India LLP - Key offerings
SWOT

15.8 CoreAxis

CoreAxis - Overview
CoreAxis - Product / Service
CoreAxis - Key offerings
SWOT

15.9 Designing Digitally Inc.

Designing Digitally Inc. - Overview
Designing Digitally Inc. - Product / Service
Designing Digitally Inc. - Key offerings
SWOT

15.10 EI Design Pvt. Ltd.

EI Design Pvt. Ltd. - Overview
EI Design Pvt. Ltd. - Product / Service
EI Design Pvt. Ltd. - Key offerings
SWOT

15.11 Houghton Mifflin Harcourt Co.

Houghton Mifflin Harcourt Co. - Overview
Houghton Mifflin Harcourt Co. - Product / Service
Houghton Mifflin Harcourt Co. - Key offerings
SWOT

15.12 Hurix System Pvt. Ltd.

Hurix System Pvt. Ltd. - Overview
Hurix System Pvt. Ltd. - Product / Service
Hurix System Pvt. Ltd. - Key offerings
SWOT

15.13 InfoPro Learning Inc.

InfoPro Learning Inc. - Overview
InfoPro Learning Inc. - Product / Service
InfoPro Learning Inc. - Key offerings
SWOT

15.14 Learning Pool

Learning Pool - Overview
Learning Pool - Product / Service
Learning Pool - Key offerings
SWOT

15.15 Leo Learning Inc

Leo Learning Inc - Overview
Leo Learning Inc - Product / Service
Leo Learning Inc - Key offerings
SWOT

15.16 McGraw Hill LLC

McGraw Hill LLC - Overview
McGraw Hill LLC - Product / Service
McGraw Hill LLC - Key offerings
SWOT

15.17 Pearson Plc

Pearson Plc - Overview
Pearson Plc - Business segments
Pearson Plc - Key offerings
Pearson Plc - Segment focus
SWOT

15.18 Scholastic Corp.

Scholastic Corp. - Overview
Scholastic Corp. - Business segments
Scholastic Corp. - Key offerings
Scholastic Corp. - Segment focus
SWOT

16. Appendix

16.1 Scope of the report

Market definition
Objectives
Notes and caveats

16.2 Inclusions and exclusions checklist

Inclusions checklist
Exclusions checklist

16.3 Currency conversion rates for US$

16.4 Research methodology

16.5 Data procurement

Information sources

16.6 Data validation

16.7 Validation techniques employed for market sizing

16.8 Data synthesis

16.9 360 degree market analysis

16.10 List of abbreviations

Research Methodology

Technavio presents a detailed picture of the market by way of study, synthesis, and summation of data from multiple sources. The analysts have presented the various facets of the market with a particular focus on identifying the key industry influencers. The data thus presented is comprehensive, reliable, and the result of extensive research, both primary and secondary.

INFORMATION SOURCES

Primary sources

  • Manufacturers and suppliers
  • Channel partners
  • Industry experts
  • Strategic decision makers

Secondary sources

  • Industry journals and periodicals
  • Government data
  • Financial reports of key industry players
  • Historical data
  • Press releases

DATA ANALYSIS

Data Synthesis

  • Collation of data
  • Estimation of key figures
  • Analysis of derived insights

Data Validation

  • Triangulation with data models
  • Reference against proprietary databases
  • Corroboration with industry experts

REPORT WRITING

Qualitative

  • Market drivers
  • Market challenges
  • Market trends
  • Five forces analysis

Quantitative

  • Market size and forecast
  • Market segmentation
  • Geographical insights
  • Competitive landscape

Interested in this report?

Get your sample now to see our research methodology and insights!

Download Now

Frequently Asked Questions

Curriculum Development Service market growth will increase by USD 459.0 million during 2026-2030.

The Curriculum Development Service market is expected to grow at a CAGR of 6% during 2026-2030.

Curriculum Development Service market is segmented by Type (Online curriculum development, Offline curriculum design, Hybrid, AI-assisted instructional design) End-user (Academic institutions, Corporate and enterprise training, Government, Others) Product (K-12 curriculum development, Higher education, Workforce training curriculum, Technical education, Others)

Allen Interactions Inc., Aptara Inc., Cengage Learning Inc., CommLab India LLP, CoreAxis, Designing Digitally Inc., EI Design Pvt. Ltd., GP Strategies Corp., Houghton Mifflin Harcourt Co., Hurix System Pvt. Ltd., InfoPro Learning Inc., John Wiley and Sons Inc., Learning Pool, Leo Learning Inc, McGraw Hill LLC, Mind Tools Ltd., MPS Ltd., NIIT Ltd., Pearson Plc, Scholastic Corp. are a few of the key vendors in the Curriculum Development Service market.

North America will register the highest growth rate of 37.3% among the other regions. Therefore, the Curriculum Development Service market in North America is expected to garner significant business opportunities for the vendors during the forecast period.

US, Canada, Mexico, China, India, Japan, Australia, South Korea, Indonesia, Germany, UK, France, Italy, Spain, The Netherlands, Brazil, Argentina, Chile, Saudi Arabia, UAE, South Africa, Egypt, Turkey

  • Digital transformation and integration of intelligent technologies is the driving factor this market.

The Curriculum Development Service market vendors should focus on grabbing business opportunities from the Type segment as it accounted for the largest market share in the base year.
RIA - Research AI Assistant
Ask RIA