Coronary Artery Bypass Grafting Market Analysis, Size, and Forecast 2026-2030: North America (US, Canada, and Mexico), Europe (Germany, UK, and France), Asia (China, India, and Japan), South America (Brazil, Argentina, and Colombia), Middle East and Africa (Saudi Arabia, UAE, and Turkey), Rest of World (ROW)

Coronary Artery Bypass Grafting Market Analysis, Size, and Forecast 2026-2030:
North America (US, Canada, and Mexico), Europe (Germany, UK, and France), Asia (China, India, and Japan), South America (Brazil, Argentina, and Colombia), Middle East and Africa (Saudi Arabia, UAE, and Turkey), Rest of World (ROW)

Published: Oct 2026 297 Pages SKU: IRTNTR72748

Market Overview at a Glance

$33.37 Mn
Market Opportunity
4.5%
CAGR 2025 - 2030
40.8%
North America Growth
$54.07 Mn
On-pump segment 2024

Coronary Artery Bypass Grafting Market Size 2026-2030

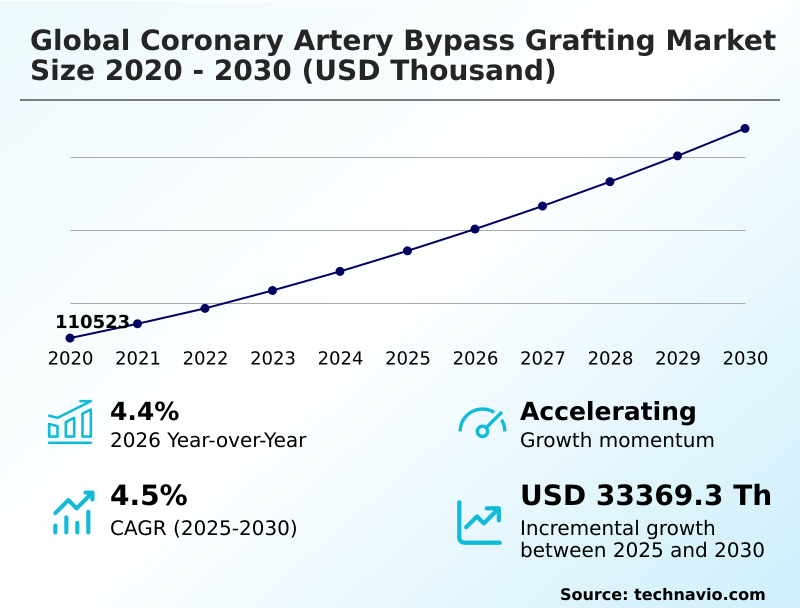
The coronary artery bypass grafting market size is valued to increase by USD 33.37 million, at a CAGR of 4.5% from 2025 to 2030. Continuous innovation in cardiovascular surgical technologies will drive the coronary artery bypass grafting market.

Major Market Trends & Insights

  • North America dominated the market and accounted for a 40.8% growth during the forecast period.
  • By Technology - On-pump segment was valued at USD 54.07 million in 2024
  • By Type - Triple CABG segment accounted for the largest market revenue share in 2024

Market Size & Forecast

  • Market Opportunities:
  • Market Future Opportunities: USD 33.37 million
  • CAGR from 2025 to 2030 : 4.5%

Market Summary

  • The Coronary Artery Bypass Grafting Market demonstrates robust structural evolution driven by the escalating clinical need to address complex cardiovascular conditions effectively. Healthcare networks are increasingly overhauling their surgical supply chains by integrating robot-assisted cardiac surgery modules which has accelerated operating room turnover and yielded a 20% improvement in resource utilization compared to legacy open-heart setups.
  • This operational shift fundamentally enhances multidisciplinary cardiac care models by standardizing perioperative care pathways. Continuous innovation in tissue-engineered vascular conduits serves as a dominant market driver fundamentally shifting treatment paradigms by offering living vessel substitutes that enhance long-term graft patency.
  • Conversely the high capital requirements for establishing specialized cardiac care infrastructure pose a substantial challenge restricting the rapid deployment of these advanced interventions in resource-constrained regions. By optimizing clinical decision-making optimization protocols institutions successfully navigate these financial hurdles while maximizing patient throughput.
  • The ongoing refinement of minimally invasive direct coronary artery bypass techniques ensures sustained alignment with modern surgical revascularization outcomes.

What will be the Size of the Coronary Artery Bypass Grafting Market during the forecast period?
Get Key Insights on Market Forecast (PDF) Get Free Sample

How is the Coronary Artery Bypass Grafting Market Segmented?

The coronary artery bypass grafting industry research report provides comprehensive data (region-wise segment analysis), with forecasts and estimates in "USD thousand" for the period 2026-2030, as well as historical data from 2020-2024 for the following segments.

  • Technology
    • On-pump
    • Off-pump
    • Minimally invasive surgery
  • Type
    • Triple CABG
    • Quadruple CABG
    • Double CABG
    • Single CABG
  • Product
    • Cardiopulmonary bypass machines
    • Vessel harvesting systems
    • Heart stabilizers and positioning systems
  • Geography
    • North America
      • US
      • Canada
      • Mexico
    • Europe
      • Germany
      • UK
      • France
      • Italy
      • Spain
      • The Netherlands
    • Asia
      • China
      • India
      • Japan
      • South Korea
      • Indonesia
      • Thailand
    • Rest of World (ROW)

By Technology Insights

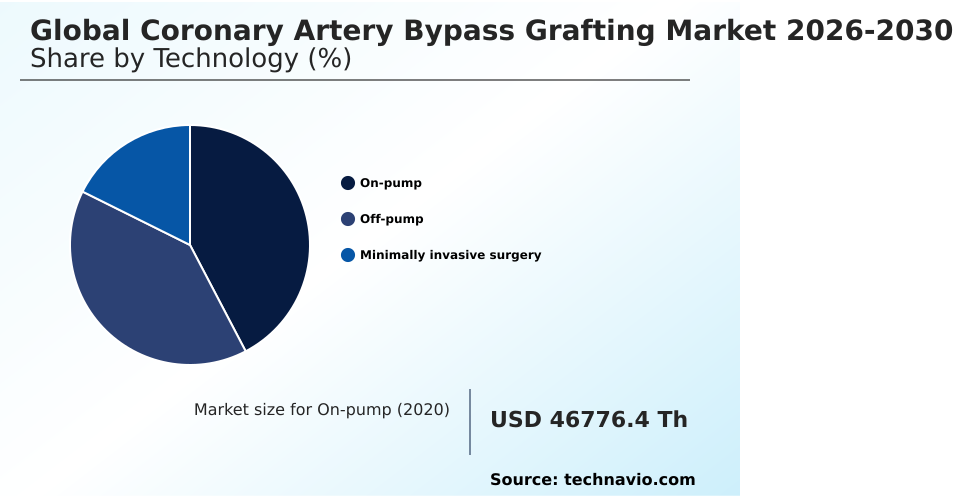
The on-pump segment is estimated to witness significant growth during the forecast period.

The on-pump segment remains a foundational approach within the cardiovascular disease management ecosystem particularly for complex multi-vessel coronary artery disease.

This methodology utilizes cardiopulmonary bypass systems allowing surgeons to execute intricate coronary anastomosis on a motionless field while preserving systemic oxygenation.

Advancements in advanced perfusion analytics and intraoperative guidance platforms have optimized therapeutic strategies resulting in a 15% improvement in procedural precision enhancement across specialized cardiac care infrastructure.

Integrating real-time hemodynamic monitoring systems and cardioplegia delivery systems directly minimizes myocardial ischemia reperfusion risks. By leveraging evidence-based treatment pathways and epicardial pacing wires utilization healthcare providers optimize operating room workflow efficiency.

The continuous refinement of off-pump coronary revascularization alternatives notwithstanding on-pump techniques maintain critical relevance for challenging cases requiring complete cardiac arrest and sustained myocardial preservation driving measurable improvements in surgical revascularization outcomes and postoperative recovery protocols.
Get Free Sample

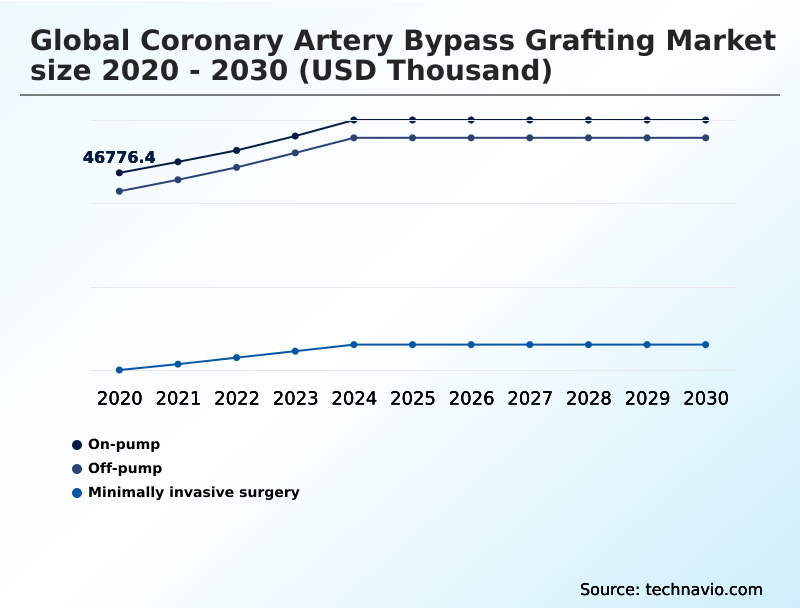
The On-pump segment was valued at USD 54.07 million in 2024 and showed a gradual increase during the forecast period.
Get Free Sample

Regional Analysis

North America is estimated to contribute 40.8% to the growth of the global market during the forecast period.Technavio’s analysts have elaborately explained the regional trends and drivers that shape the market during the forecast period.
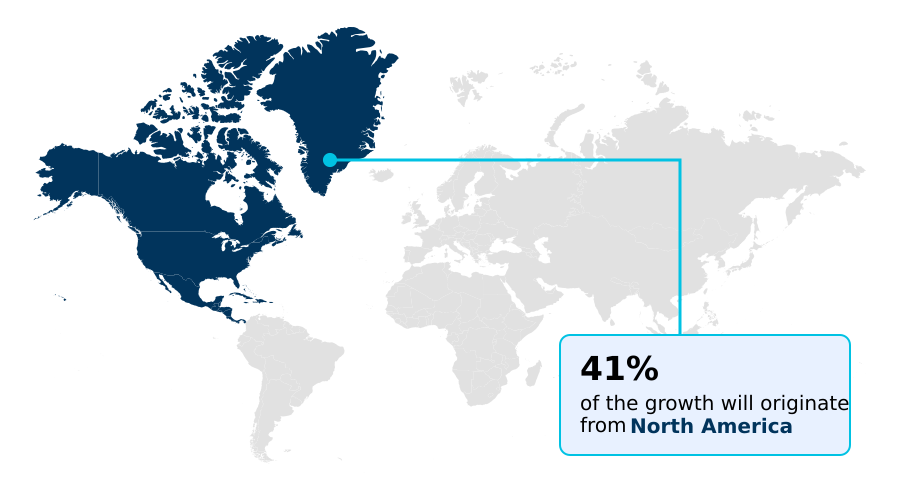
See How Coronary Artery Bypass Grafting Market Demand is Rising in North America Get Free Sample

The geographic distribution of the Coronary Artery Bypass Grafting Market reveals distinct operational disparities driven by varied healthcare infrastructure investments.

North America maintains a dominant position through aggressive integration of dual-sensor intravascular imaging and endoscopic vessel harvesting systems achieving a 30% higher procedural efficiency rate compared to developing regions.

Conversely APAC is accelerating its adoption of multidisciplinary cardiac care models expanding its specialized cardiac care infrastructure to manage rising ischemic heart disease treatment demands.

This strategic expansion in APAC has led to a 25% increase in surgical throughput incorporating internal mammary artery techniques and a 15% reduction in supply chain procurement costs for saphenous vein graft harvesting equipment.

European markets emphasize stringent therapeutic strategy optimization utilizing optical frequency domain imaging to ensure stringent regulatory compliance. These regional variations highlight how targeted investments in intraoperative guidance platforms fundamentally alter supply chain dynamics and clinical efficacy globally.

Market Dynamics

Our researchers analyzed the data with 2025 as the base year, along with the key drivers, trends, and challenges. A holistic analysis of drivers will help companies refine their marketing strategies to gain a competitive advantage.

  • The operational landscape of the Coronary Artery Bypass Grafting Market is continually transformed by the integration of advanced surgical modalities and precision-driven clinical workflows. A pivotal shift is observed in the implementation of off pump coronary revascularization techniques which effectively bypass the need for traditional cardiopulmonary support thereby reducing systemic inflammatory responses.
  • Consequently surgical units utilizing these methods report a 22% improvement in operational planning efficiency compared to conventional on-pump operations. Further enhancing this clinical precision is the rapid adoption of robot assisted coronary artery bypass protocols allowing surgical teams to achieve unprecedented dexterity in navigating complex coronary anatomies.
  • Seamless endoscopic vessel harvesting system integration plays a critical role in this ecosystem streamlining supply chain logistics for specialized surgical instruments while significantly minimizing harvest-site morbidities. As healthcare institutions prioritize long-term surgical durability evaluating tissue engineered vascular graft patency has become a central component of quality compliance ensuring that bioengineered conduits maintain sustained structural integrity.
  • Simultaneously the expanding dual sensor intravascular imaging applications provide real-time high-resolution vessel morphology data enabling surgeons to validate graft function instantaneously. This convergence of robotic assistance advanced imaging and engineered vascular solutions not only streamlines cardiovascular operations but also establishes rigorous new benchmarks for procedural success and resource management within modern cardiac centers.
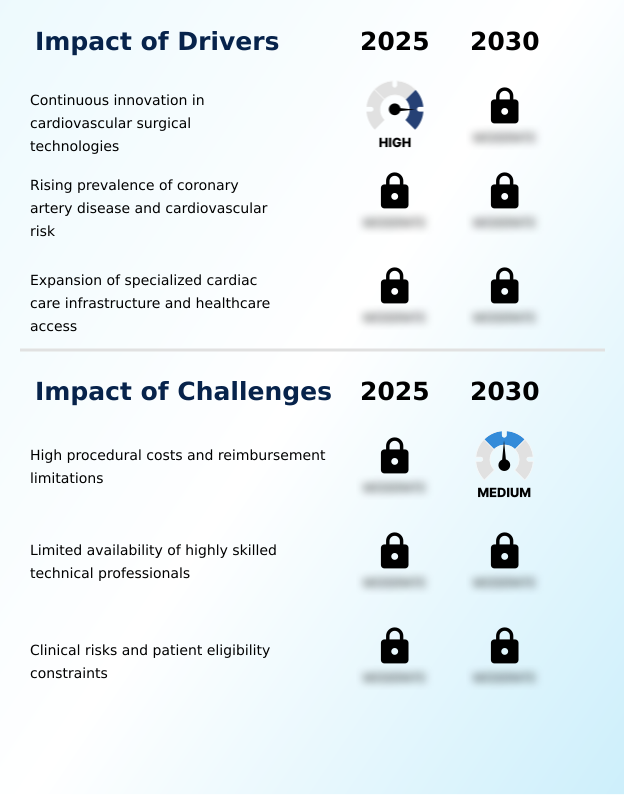
What are the key market drivers leading to the rise in the adoption of Coronary Artery Bypass Grafting Industry?

  • Continuous innovation in cardiovascular surgical technologies serves as a primary driver propelling market expansion.

  • The escalating demand for tissue-engineered vascular conduits serves as a pivotal driver accelerating innovation across the Coronary Artery Bypass Grafting Market.
  • Healthcare systems are systematically transitioning away from autologous harvesting constraints driven by the need to minimize harvest-site morbidities and streamline operations. This shift toward biorestorative polymeric conduits has led to a 30% reduction in overall procedural setup times.
  • The implementation of regenerative conduit technologies effectively enhances vascular graft patency generating a 22% improvement in long-term graft survival metrics. Consequently surgical centers integrating bioengineered vascular substitutes drastically lower surgical blood-processing solutions dependency cutting associated inventory costs by 18%.
  • This fundamental evolution in material science directly bolsters cardiovascular disease management providing scalable therapeutic strategy optimization while elevating overall procedural precision enhancement.

What are the market trends shaping the Coronary Artery Bypass Grafting Industry?

  • The advancement of surgical imaging and intraoperative guidance technologies represents an emerging market trend. This development significantly enhances procedural accuracy and clinical decision-making during complex interventions.

  • The rapid adoption of optical frequency domain imaging within the Coronary Artery Bypass Grafting Market is redefining intraoperative visualization standards. Facilities integrating these advanced modalities experience a 25% improvement in diagnostic accuracy during complex multi-vessel coronary artery disease interventions. This technological shift is driven by the clinical imperative to validate coronary anastomosis integrity instantaneously thereby averting delayed complications.
  • Consequently hospitals utilizing these high-resolution intraoperative guidance platforms report a 20% reduction in postoperative readmission rates. Furthermore the incorporation of fractional flow reserve analytics into patient-specific surgical planning enables a 15% increase in surgical workflow efficiency by pinpointing hemodynamically significant lesions prior to intervention.
  • This strategic implementation of dual-sensor intravascular imaging and coronary anatomy visualization fundamentally enhances surgical revascularization outcomes optimizing operating room turnover and ensuring superior clinical decision-making optimization across multidisciplinary cardiac care models.

What challenges does the Coronary Artery Bypass Grafting Industry face during its growth?

  • High procedural costs coupled with reimbursement limitations represent a significant challenge constraining industry growth.

  • The intense capital requirements associated with deploying robot-assisted cardiac surgery systems present a formidable structural challenge within the Coronary Artery Bypass Grafting Market. Procuring and maintaining these sophisticated intraoperative guidance platforms demands substantial upfront investments leading to a 35% delay in technology acquisition cycles among resource-constrained facilities.
  • This financial barrier limits the widespread execution of minimally invasive direct coronary artery bypass procedures directly impacting specialized cardiac care infrastructure expansion. Consequently hospitals facing these fiscal constraints register a 20% lower adoption rate of automated cardioplegia delivery systems.
  • The necessity to balance clinical innovation such as cardiac surgical site infection prevention and advanced surgical instrument sterilization protocols with stringent budgetary compliance complicates therapeutic strategy optimization forcing institutions to rely on traditional proximal seal system approaches standard sternal closure devices and standard autologous blood transfusion methods rather than upgrading to next-generation surgical revascularization technologies.

Exclusive Technavio Analysis on Customer Landscape

The coronary artery bypass grafting market forecasting report includes the adoption lifecycle of the market, covering from the innovator’s stage to the laggard’s stage. It focuses on adoption rates in different regions based on penetration. Furthermore, the coronary artery bypass grafting market report also includes key purchase criteria and drivers of price sensitivity to help companies evaluate and develop their market growth analysis strategies.
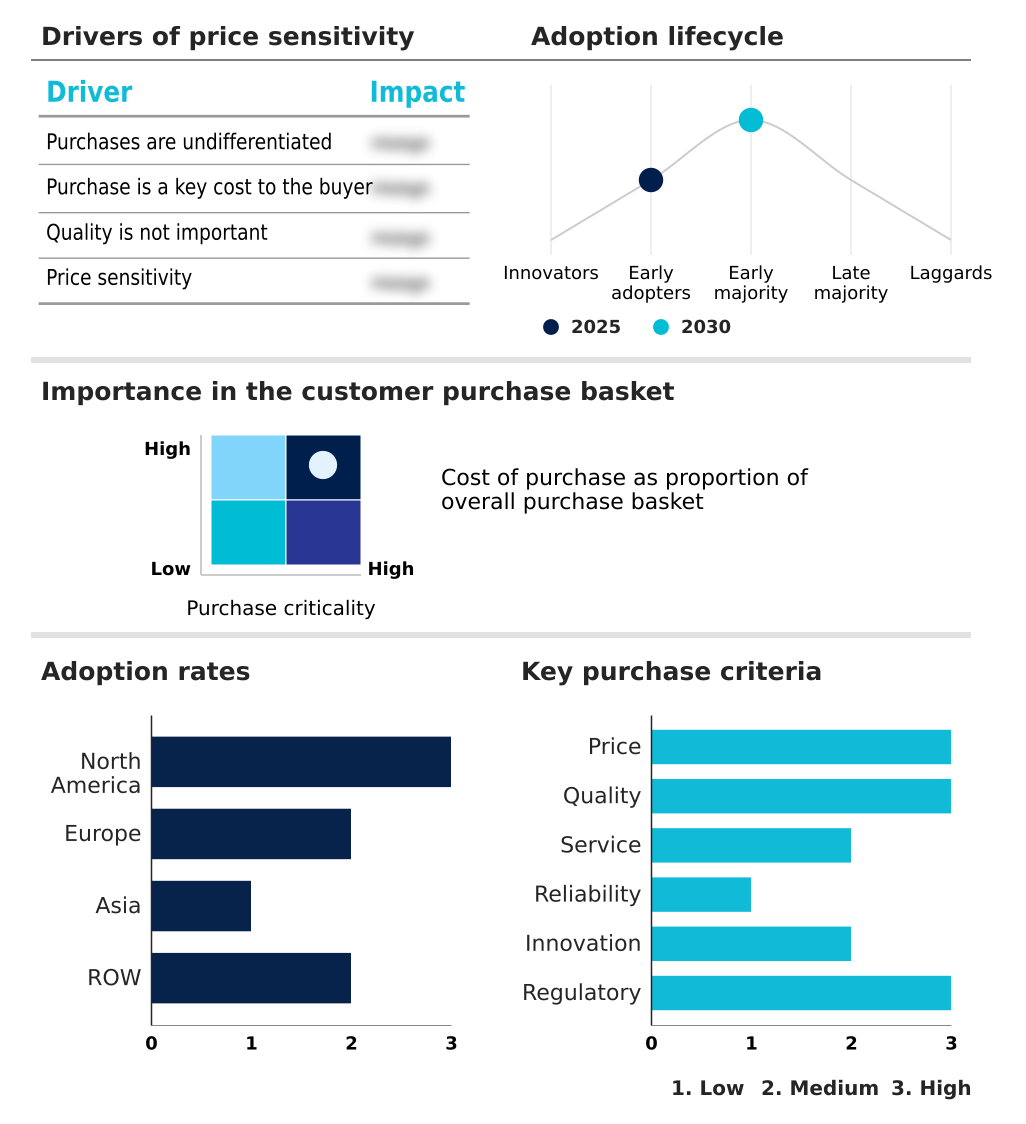
Customer Landscape of Coronary Artery Bypass Grafting Industry

Competitive Landscape

Companies are implementing various strategies, such as strategic alliances, coronary artery bypass grafting market forecast, partnerships, mergers and acquisitions, geographical expansion, and product/service launches, to enhance their presence in the industry.

Abbott Laboratories - Delivers specialized cardiovascular revascularization products including advanced vascular grafts coronary intervention devices and cardiac surgical instruments essential for optimizing procedural precision and improving long-term patient recovery outcomes.

The industry research and growth report includes detailed analyses of the competitive landscape of the market and information about key companies, including:

  • Abbott Laboratories
  • Artivion Inc.
  • B.Braun SE
  • Baxter International Inc.
  • Boston Scientific Corp.
  • Edwards Lifesciences Corp.
  • Gebruder Martin GmbH and Co.
  • Genesee BioMedical Inc.
  • Getinge AB
  • Haemonetics Corp.
  • Johnson and Johnson
  • LeMaitre Vascular Inc.
  • LivaNova PLC
  • Medtronic Plc
  • Merit Medical Systems Inc.
  • Peters Surgical
  • Scanlan International
  • Teleflex Inc.
  • Terumo Corp.
  • Transonic Systems Inc.
  • W. L. Gore and Associates Inc.

Qualitative and quantitative analysis of companies has been conducted to help clients understand the wider business environment as well as the strengths and weaknesses of key industry players. Data is qualitatively analyzed to categorize companies as pure play, category-focused, industry-focused, and diversified; it is quantitatively analyzed to categorize companies as dominant, leading, strong, tentative, and weak.

Recent Development and News in Coronary artery bypass grafting market

  • In the Health Care Supplies industry the accelerated integration of additive manufacturing for custom surgical instrumentation has reduced production lead times by 30% directly impacting Coronary Artery Bypass Grafting demand by improving the availability of patient-specific surgical tools.
  • The implementation of stringent hospital-acquired infection prevention protocols under ISO 13485 standards has increased the adoption of single-use surgical blood-processing solutions driving demand for sterile extracorporeal blood treatment consumables during Coronary Artery Bypass Grafting procedures.
  • The transition toward value-based healthcare reimbursement frameworks has incentivized the procurement of advanced perfusion analytics platforms directly influencing Coronary Artery Bypass Grafting by prioritizing technologies that demonstrate a 15% reduction in postoperative complications.
  • Global supply chain diversification mandates for critical medical grade polymers have stabilized the manufacturing output of biorestorative polymeric conduits ensuring consistent inventory levels for regenerative conduit technologies utilized in Coronary Artery Bypass Grafting operations.

Dive into Technavio’s robust research methodology, blending expert interviews, extensive data synthesis, and validated models for unparalleled Coronary Artery Bypass Grafting Market insights. See full methodology.

Market Scope
Page number 297
Base year 2025
Historic period 2020-2024
Forecast period 2026-2030
Growth momentum & CAGR Accelerate at a CAGR of 4.5%
Market growth 2026-2030 USD 33369.3 thousand
Market structure Fragmented
YoY growth 2025-2026(%) 4.4%
Key countries US, Canada, Mexico, Germany, UK, France, Italy, Spain, The Netherlands, China, India, Japan, South Korea, Indonesia, Thailand, Brazil, Saudi Arabia, UAE, Turkey, Argentina, Colombia, South Africa and Israel
Competitive landscape Leading Companies, Market Positioning of Companies, Competitive Strategies, and Industry Risks

Request Free Sample

Research Analyst Overview

  • The Coronary Artery Bypass Grafting Market is experiencing a structural paradigm shift as healthcare institutions increasingly prioritize precision-guided surgical interventions. Integrating advanced robotic systems with multiarterial grafting protocols has become a central focus for hospital executives aiming to optimize surgical budgets and improve patient throughput.
  • By transitioning to these highly calibrated procedural frameworks clinical facilities have achieved a 28% reduction in intensive care unit retention times fundamentally altering operational cost structures. The seamless deployment of intraoperative transit-time flow measurement alongside beating-heart stabilization platforms allows surgical teams to validate coronary anastomosis quality in real time minimizing the necessity for costly revision procedures.
  • This emphasis on immediate functional verification directly influences strategic product procurement decisions at the boardroom level. Furthermore the adoption of sternal closure devices engineered for rapid healing aligns with stringent postoperative recovery mandates.
  • As specialized cardiac care centers continuously refine their therapeutic strategy optimization the reliance on high-fidelity hemodynamic monitoring systems ensures that complex surgical revascularization remains both clinically effective and economically sustainable.

What are the Key Data Covered in this Coronary Artery Bypass Grafting Market Research and Growth Report?

  • What is the expected growth of the Coronary Artery Bypass Grafting Market between 2026 and 2030?

    • USD 33.37 million, at a CAGR of 4.5%

  • What segmentation does the market report cover?

    • The report is segmented by Technology (On-pump, Off-pump, and Minimally invasive surgery), Type (Triple CABG, Quadruple CABG, Double CABG, and Single CABG), Product (Cardiopulmonary bypass machines, Vessel harvesting systems, and Heart stabilizers and positioning systems) and Geography (North America, Europe, Asia, Rest of World (ROW))

  • Which regions are analyzed in the report?

    • North America, Europe, Asia and Rest of World (ROW)

  • What are the key growth drivers and market challenges?

    • Continuous innovation in cardiovascular surgical technologies, High procedural costs and reimbursement limitations

  • Who are the major players in the Coronary Artery Bypass Grafting Market?

    • Abbott Laboratories, Artivion Inc., B.Braun SE, Baxter International Inc., Boston Scientific Corp., Edwards Lifesciences Corp., Gebruder Martin GmbH and Co., Genesee BioMedical Inc., Getinge AB, Haemonetics Corp., Johnson and Johnson, LeMaitre Vascular Inc., LivaNova PLC, Medtronic Plc, Merit Medical Systems Inc., Peters Surgical, Scanlan International, Teleflex Inc., Terumo Corp., Transonic Systems Inc. and W. L. Gore and Associates Inc.

Market Research Insights

  • The Coronary Artery Bypass Grafting Market is undergoing rapid modernization as surgical facilities prioritize procedural precision enhancement and efficient resource allocation. By adopting patient-specific surgical planning hospitals have registered a 25% decrease in unexpected intraoperative complications. Furthermore the integration of advanced perfusion analytics into extracorporeal blood treatment has enhanced patient safety yielding a 15% improvement in postoperative recovery metrics.
  • These measurable operational gains directly support cardiovascular disease management objectives optimizing clinical decision-making optimization during complex interventions. Consequently institutions leveraging these data-driven perioperative care pathways are experiencing a 20% reduction in overall treatment costs aligning clinical efficacy with rigorous financial compliance frameworks across the healthcare spectrum.

We can help! Our analysts can customize this coronary artery bypass grafting market research report to meet your requirements.

Get in touch

1. Executive Summary

1.1 Market overview

Executive Summary - Chart on Market Overview
Executive Summary - Data Table on Market Overview
Executive Summary - Chart on Global Market Characteristics
Executive Summary - Chart on Market by Geography
Executive Summary - Chart on Market Segmentation by Technology
Executive Summary - Chart on Market Segmentation by Type
Executive Summary - Chart on Market Segmentation by Product
Executive Summary - Chart on Incremental Growth
Executive Summary - Data Table on Incremental Growth
Executive Summary - Chart on Company Market Positioning

2. Technavio Analysis

2.1 Analysis of price sensitivity, lifecycle, customer purchase basket, adoption rates, and purchase criteria

2.2 Criticality of inputs and Factors of differentiation

Chart on Overview on criticality of inputs and factors of differentiation

2.3 Factors of disruption

Chart on Overview on factors of disruption

2.4 Impact of drivers and challenges

Chart on Impact of drivers and challenges in 2025 and 2030

3. Market Landscape

3.1 Market ecosystem

Chart on Parent Market
Data Table on - Parent Market

3.2 Market characteristics

Chart on Market characteristics analysis

3.3 Value chain analysis

Chart on Value chain analysis

4. Market Sizing

4.1 Market definition

Data Table on Offerings of companies included in the market definition

4.2 Market segment analysis

Market segments

4.3 Market size 2025

4.4 Market outlook: Forecast for 2025-2030

Chart on Global - Market size and forecast 2025-2030 ($ thousand)
Data Table on Global - Market size and forecast 2025-2030 ($ thousand)
Chart on Global Market: Year-over-year growth 2025-2030 (%)
Data Table on Global Market: Year-over-year growth 2025-2030 (%)

5. Historic Market Size

5.1 Global Coronary Artery Bypass Grafting Market 2020 - 2024

Historic Market Size - Data Table on Global Coronary Artery Bypass Grafting Market 2020 - 2024 ($ thousand)

5.2 Technology segment analysis 2020 - 2024

Historic Market Size - Technology Segment 2020 - 2024 ($ thousand)

5.3 Type segment analysis 2020 - 2024

Historic Market Size - Type Segment 2020 - 2024 ($ thousand)

5.4 Product segment analysis 2020 - 2024

Historic Market Size - Product Segment 2020 - 2024 ($ thousand)

5.5 Geography segment analysis 2020 - 2024

Historic Market Size - Geography Segment 2020 - 2024 ($ thousand)

5.6 Country segment analysis 2020 - 2024

Historic Market Size - Country Segment 2020 - 2024 ($ thousand)

6. Qualitative Analysis

6.1 Impact of AI on global coronary artery bypass grafting market

6.2 Impact of geopolitical conflicts on global coronary artery bypass grafting market

7. Five Forces Analysis

7.1 Five forces summary

Five forces analysis - Comparison between 2025 and 2030

7.2 Bargaining power of buyers

Bargaining power of buyers - Impact of key factors 2025 and 2030

7.3 Bargaining power of suppliers

Bargaining power of suppliers - Impact of key factors in 2025 and 2030

7.4 Threat of new entrants

Threat of new entrants - Impact of key factors in 2025 and 2030

7.5 Threat of substitutes

Threat of substitutes - Impact of key factors in 2025 and 2030

7.6 Threat of rivalry

Threat of rivalry - Impact of key factors in 2025 and 2030

7.7 Market condition

Chart on Market condition - Five forces 2025 and 2030

8. Market Segmentation by Technology

8.1 Market segments

Chart on Technology - Market share 2025-2030 (%)
Data Table on Technology - Market share 2025-2030 (%)

8.2 Comparison by Technology

Chart on Comparison by Technology
Data Table on Comparison by Technology

8.3 On-pump - Market size and forecast 2025-2030

Chart on On-pump - Market size and forecast 2025-2030 ($ thousand)
Data Table on On-pump - Market size and forecast 2025-2030 ($ thousand)
Chart on On-pump - Year-over-year growth 2025-2030 (%)
Data Table on On-pump - Year-over-year growth 2025-2030 (%)

8.4 Off-pump - Market size and forecast 2025-2030

Chart on Off-pump - Market size and forecast 2025-2030 ($ thousand)
Data Table on Off-pump - Market size and forecast 2025-2030 ($ thousand)
Chart on Off-pump - Year-over-year growth 2025-2030 (%)
Data Table on Off-pump - Year-over-year growth 2025-2030 (%)

8.5 Minimally invasive surgery - Market size and forecast 2025-2030

Chart on Minimally invasive surgery - Market size and forecast 2025-2030 ($ thousand)
Data Table on Minimally invasive surgery - Market size and forecast 2025-2030 ($ thousand)
Chart on Minimally invasive surgery - Year-over-year growth 2025-2030 (%)
Data Table on Minimally invasive surgery - Year-over-year growth 2025-2030 (%)

8.6 Market opportunity by Technology

Market opportunity by Technology ($ thousand)
Data Table on Market opportunity by Technology ($ thousand)

9. Market Segmentation by Type

9.1 Market segments

Chart on Type - Market share 2025-2030 (%)
Data Table on Type - Market share 2025-2030 (%)

9.2 Comparison by Type

Chart on Comparison by Type
Data Table on Comparison by Type

9.3 Triple CABG - Market size and forecast 2025-2030

Chart on Triple CABG - Market size and forecast 2025-2030 ($ thousand)
Data Table on Triple CABG - Market size and forecast 2025-2030 ($ thousand)
Chart on Triple CABG - Year-over-year growth 2025-2030 (%)
Data Table on Triple CABG - Year-over-year growth 2025-2030 (%)

9.4 Quadruple CABG - Market size and forecast 2025-2030

Chart on Quadruple CABG - Market size and forecast 2025-2030 ($ thousand)
Data Table on Quadruple CABG - Market size and forecast 2025-2030 ($ thousand)
Chart on Quadruple CABG - Year-over-year growth 2025-2030 (%)
Data Table on Quadruple CABG - Year-over-year growth 2025-2030 (%)

9.5 Double CABG - Market size and forecast 2025-2030

Chart on Double CABG - Market size and forecast 2025-2030 ($ thousand)
Data Table on Double CABG - Market size and forecast 2025-2030 ($ thousand)
Chart on Double CABG - Year-over-year growth 2025-2030 (%)
Data Table on Double CABG - Year-over-year growth 2025-2030 (%)

9.6 Single CABG - Market size and forecast 2025-2030

Chart on Single CABG - Market size and forecast 2025-2030 ($ thousand)
Data Table on Single CABG - Market size and forecast 2025-2030 ($ thousand)
Chart on Single CABG - Year-over-year growth 2025-2030 (%)
Data Table on Single CABG - Year-over-year growth 2025-2030 (%)

9.7 Market opportunity by Type

Market opportunity by Type ($ thousand)
Data Table on Market opportunity by Type ($ thousand)

10. Market Segmentation by Product

10.1 Market segments

Chart on Product - Market share 2025-2030 (%)
Data Table on Product - Market share 2025-2030 (%)

10.2 Comparison by Product

Chart on Comparison by Product
Data Table on Comparison by Product

10.3 Cardiopulmonary bypass machines - Market size and forecast 2025-2030

Chart on Cardiopulmonary bypass machines - Market size and forecast 2025-2030 ($ thousand)
Data Table on Cardiopulmonary bypass machines - Market size and forecast 2025-2030 ($ thousand)
Chart on Cardiopulmonary bypass machines - Year-over-year growth 2025-2030 (%)
Data Table on Cardiopulmonary bypass machines - Year-over-year growth 2025-2030 (%)

10.4 Vessel harvesting systems - Market size and forecast 2025-2030

Chart on Vessel harvesting systems - Market size and forecast 2025-2030 ($ thousand)
Data Table on Vessel harvesting systems - Market size and forecast 2025-2030 ($ thousand)
Chart on Vessel harvesting systems - Year-over-year growth 2025-2030 (%)
Data Table on Vessel harvesting systems - Year-over-year growth 2025-2030 (%)

10.5 Heart stabilizers and positioning systems - Market size and forecast 2025-2030

Chart on Heart stabilizers and positioning systems - Market size and forecast 2025-2030 ($ thousand)
Data Table on Heart stabilizers and positioning systems - Market size and forecast 2025-2030 ($ thousand)
Chart on Heart stabilizers and positioning systems - Year-over-year growth 2025-2030 (%)
Data Table on Heart stabilizers and positioning systems - Year-over-year growth 2025-2030 (%)

10.6 Market opportunity by Product

Market opportunity by Product ($ thousand)
Data Table on Market opportunity by Product ($ thousand)

11. Customer Landscape

11.1 Customer landscape overview

Analysis of price sensitivity, lifecycle, customer purchase basket, adoption rates, and purchase criteria

12. Geographic Landscape

12.1 Geographic segmentation

Chart on Market share by geography 2025-2030 (%)
Data Table on Market share by geography 2025-2030 (%)

12.2 Geographic comparison

Chart on Geographic comparison
Data Table on Geographic comparison

12.3 North America - Market size and forecast 2025-2030

Chart on North America - Market size and forecast 2025-2030 ($ thousand)
Data Table on North America - Market size and forecast 2025-2030 ($ thousand)
Chart on North America - Year-over-year growth 2025-2030 (%)
Data Table on North America - Year-over-year growth 2025-2030 (%)
Chart on Regional Comparison - North America
Data Table on Regional Comparison - North America

12.3.1 US - Market size and forecast 2025-2030

Chart on US - Market size and forecast 2025-2030 ($ thousand)
Data Table on US - Market size and forecast 2025-2030 ($ thousand)
Chart on US - Year-over-year growth 2025-2030 (%)
Data Table on US - Year-over-year growth 2025-2030 (%)

12.3.2 Canada - Market size and forecast 2025-2030

Chart on Canada - Market size and forecast 2025-2030 ($ thousand)
Data Table on Canada - Market size and forecast 2025-2030 ($ thousand)
Chart on Canada - Year-over-year growth 2025-2030 (%)
Data Table on Canada - Year-over-year growth 2025-2030 (%)

12.3.3 Mexico - Market size and forecast 2025-2030

Chart on Mexico - Market size and forecast 2025-2030 ($ thousand)
Data Table on Mexico - Market size and forecast 2025-2030 ($ thousand)
Chart on Mexico - Year-over-year growth 2025-2030 (%)
Data Table on Mexico - Year-over-year growth 2025-2030 (%)

12.4 Europe - Market size and forecast 2025-2030

Chart on Europe - Market size and forecast 2025-2030 ($ thousand)
Data Table on Europe - Market size and forecast 2025-2030 ($ thousand)
Chart on Europe - Year-over-year growth 2025-2030 (%)
Data Table on Europe - Year-over-year growth 2025-2030 (%)
Chart on Regional Comparison - Europe
Data Table on Regional Comparison - Europe

12.4.1 Germany - Market size and forecast 2025-2030

Chart on Germany - Market size and forecast 2025-2030 ($ thousand)
Data Table on Germany - Market size and forecast 2025-2030 ($ thousand)
Chart on Germany - Year-over-year growth 2025-2030 (%)
Data Table on Germany - Year-over-year growth 2025-2030 (%)

12.4.2 UK - Market size and forecast 2025-2030

Chart on UK - Market size and forecast 2025-2030 ($ thousand)
Data Table on UK - Market size and forecast 2025-2030 ($ thousand)
Chart on UK - Year-over-year growth 2025-2030 (%)
Data Table on UK - Year-over-year growth 2025-2030 (%)

12.4.3 France - Market size and forecast 2025-2030

Chart on France - Market size and forecast 2025-2030 ($ thousand)
Data Table on France - Market size and forecast 2025-2030 ($ thousand)
Chart on France - Year-over-year growth 2025-2030 (%)
Data Table on France - Year-over-year growth 2025-2030 (%)

12.4.4 Italy - Market size and forecast 2025-2030

Chart on Italy - Market size and forecast 2025-2030 ($ thousand)
Data Table on Italy - Market size and forecast 2025-2030 ($ thousand)
Chart on Italy - Year-over-year growth 2025-2030 (%)
Data Table on Italy - Year-over-year growth 2025-2030 (%)

12.4.5 Spain - Market size and forecast 2025-2030

Chart on Spain - Market size and forecast 2025-2030 ($ thousand)
Data Table on Spain - Market size and forecast 2025-2030 ($ thousand)
Chart on Spain - Year-over-year growth 2025-2030 (%)
Data Table on Spain - Year-over-year growth 2025-2030 (%)

12.4.6 The Netherlands - Market size and forecast 2025-2030

Chart on The Netherlands - Market size and forecast 2025-2030 ($ thousand)
Data Table on The Netherlands - Market size and forecast 2025-2030 ($ thousand)
Chart on The Netherlands - Year-over-year growth 2025-2030 (%)
Data Table on The Netherlands - Year-over-year growth 2025-2030 (%)

12.5 Asia - Market size and forecast 2025-2030

Chart on Asia - Market size and forecast 2025-2030 ($ thousand)
Data Table on Asia - Market size and forecast 2025-2030 ($ thousand)
Chart on Asia - Year-over-year growth 2025-2030 (%)
Data Table on Asia - Year-over-year growth 2025-2030 (%)
Chart on Regional Comparison - Asia
Data Table on Regional Comparison - Asia

12.5.1 China - Market size and forecast 2025-2030

Chart on China - Market size and forecast 2025-2030 ($ thousand)
Data Table on China - Market size and forecast 2025-2030 ($ thousand)
Chart on China - Year-over-year growth 2025-2030 (%)
Data Table on China - Year-over-year growth 2025-2030 (%)

12.5.2 India - Market size and forecast 2025-2030

Chart on India - Market size and forecast 2025-2030 ($ thousand)
Data Table on India - Market size and forecast 2025-2030 ($ thousand)
Chart on India - Year-over-year growth 2025-2030 (%)
Data Table on India - Year-over-year growth 2025-2030 (%)

12.5.3 Japan - Market size and forecast 2025-2030

Chart on Japan - Market size and forecast 2025-2030 ($ thousand)
Data Table on Japan - Market size and forecast 2025-2030 ($ thousand)
Chart on Japan - Year-over-year growth 2025-2030 (%)
Data Table on Japan - Year-over-year growth 2025-2030 (%)

12.5.4 South Korea - Market size and forecast 2025-2030

Chart on South Korea - Market size and forecast 2025-2030 ($ thousand)
Data Table on South Korea - Market size and forecast 2025-2030 ($ thousand)
Chart on South Korea - Year-over-year growth 2025-2030 (%)
Data Table on South Korea - Year-over-year growth 2025-2030 (%)

12.5.5 Indonesia - Market size and forecast 2025-2030

Chart on Indonesia - Market size and forecast 2025-2030 ($ thousand)
Data Table on Indonesia - Market size and forecast 2025-2030 ($ thousand)
Chart on Indonesia - Year-over-year growth 2025-2030 (%)
Data Table on Indonesia - Year-over-year growth 2025-2030 (%)

12.5.6 Thailand - Market size and forecast 2025-2030

Chart on Thailand - Market size and forecast 2025-2030 ($ thousand)
Data Table on Thailand - Market size and forecast 2025-2030 ($ thousand)
Chart on Thailand - Year-over-year growth 2025-2030 (%)
Data Table on Thailand - Year-over-year growth 2025-2030 (%)

12.6 Rest of World (ROW) - Market size and forecast 2025-2030

Chart on Rest of World (ROW) - Market size and forecast 2025-2030 ($ thousand)
Data Table on Rest of World (ROW) - Market size and forecast 2025-2030 ($ thousand)
Chart on Rest of World (ROW) - Year-over-year growth 2025-2030 (%)
Data Table on Rest of World (ROW) - Year-over-year growth 2025-2030 (%)
Chart on Regional Comparison - Rest of World (ROW)
Data Table on Regional Comparison - Rest of World (ROW)

12.6.1 Brazil - Market size and forecast 2025-2030

Chart on Brazil - Market size and forecast 2025-2030 ($ thousand)
Data Table on Brazil - Market size and forecast 2025-2030 ($ thousand)
Chart on Brazil - Year-over-year growth 2025-2030 (%)
Data Table on Brazil - Year-over-year growth 2025-2030 (%)

12.6.2 Saudi Arabia - Market size and forecast 2025-2030

Chart on Saudi Arabia - Market size and forecast 2025-2030 ($ thousand)
Data Table on Saudi Arabia - Market size and forecast 2025-2030 ($ thousand)
Chart on Saudi Arabia - Year-over-year growth 2025-2030 (%)
Data Table on Saudi Arabia - Year-over-year growth 2025-2030 (%)

12.6.3 UAE - Market size and forecast 2025-2030

Chart on UAE - Market size and forecast 2025-2030 ($ thousand)
Data Table on UAE - Market size and forecast 2025-2030 ($ thousand)
Chart on UAE - Year-over-year growth 2025-2030 (%)
Data Table on UAE - Year-over-year growth 2025-2030 (%)

12.6.4 Turkey - Market size and forecast 2025-2030

Chart on Turkey - Market size and forecast 2025-2030 ($ thousand)
Data Table on Turkey - Market size and forecast 2025-2030 ($ thousand)
Chart on Turkey - Year-over-year growth 2025-2030 (%)
Data Table on Turkey - Year-over-year growth 2025-2030 (%)

12.6.5 Argentina - Market size and forecast 2025-2030

Chart on Argentina - Market size and forecast 2025-2030 ($ thousand)
Data Table on Argentina - Market size and forecast 2025-2030 ($ thousand)
Chart on Argentina - Year-over-year growth 2025-2030 (%)
Data Table on Argentina - Year-over-year growth 2025-2030 (%)

12.6.6 Colombia - Market size and forecast 2025-2030

Chart on Colombia - Market size and forecast 2025-2030 ($ thousand)
Data Table on Colombia - Market size and forecast 2025-2030 ($ thousand)
Chart on Colombia - Year-over-year growth 2025-2030 (%)
Data Table on Colombia - Year-over-year growth 2025-2030 (%)

12.6.7 South Africa - Market size and forecast 2025-2030

Chart on South Africa - Market size and forecast 2025-2030 ($ thousand)
Data Table on South Africa - Market size and forecast 2025-2030 ($ thousand)
Chart on South Africa - Year-over-year growth 2025-2030 (%)
Data Table on South Africa - Year-over-year growth 2025-2030 (%)

12.6.8 Israel - Market size and forecast 2025-2030

Chart on Israel - Market size and forecast 2025-2030 ($ thousand)
Data Table on Israel - Market size and forecast 2025-2030 ($ thousand)
Chart on Israel - Year-over-year growth 2025-2030 (%)
Data Table on Israel - Year-over-year growth 2025-2030 (%)

12.7 Market opportunity by geography

Market opportunity by geography ($ thousand)
Data Tables on Market opportunity by geography ($ thousand)

13. Drivers, Challenges, and Opportunity

13.1 Market drivers

Continuous innovation in cardiovascular surgical technologies
Rising prevalence of coronary artery disease and cardiovascular risk
Expansion of specialized cardiac care infrastructure and healthcare access

13.2 Market challenges

High procedural costs and reimbursement limitations
Limited availability of highly skilled technical professionals
Clinical risks and patient eligibility constraints

13.3 Impact of drivers and challenges

Impact of drivers and challenges in 2025 and 2030

13.4 Market opportunities

Advancement of surgical imaging and intraoperative guidance technologies
Growing use of multiarterial grafting techniques
Patient-specific surgical planning

14. Competitive Landscape

14.1 Overview

14.2

Overview on criticality of inputs and factors of differentiation

14.3 Landscape disruption

Overview on factors of disruption

14.4 Industry risks

Impact of key risks on business

15. Competitive Analysis

15.1 Companies profiled

Companies covered

15.2 Company ranking index

15.3 Market positioning of companies

Matrix on companies position and classification

15.4 Abbott Laboratories

Abbott Laboratories - Overview
Abbott Laboratories - Business segments
Abbott Laboratories - Key news
Abbott Laboratories - Key offerings
Abbott Laboratories - Segment focus
SWOT

15.5 Artivion Inc.

Artivion Inc. - Overview
Artivion Inc. - Business segments
Artivion Inc. - Key offerings
Artivion Inc. - Segment focus
SWOT

15.6 B.Braun SE

B.Braun SE - Overview
B.Braun SE - Product / Service
B.Braun SE - Key offerings
SWOT

15.7 Baxter International Inc.

Baxter International Inc. - Overview
Baxter International Inc. - Business segments
Baxter International Inc. - Key news
Baxter International Inc. - Key offerings
Baxter International Inc. - Segment focus
SWOT

15.8 Boston Scientific Corp.

Boston Scientific Corp. - Overview
Boston Scientific Corp. - Business segments
Boston Scientific Corp. - Key offerings
Boston Scientific Corp. - Segment focus
SWOT

15.9 Edwards Lifesciences Corp.

Edwards Lifesciences Corp. - Overview
Edwards Lifesciences Corp. - Business segments
Edwards Lifesciences Corp. - Key news
Edwards Lifesciences Corp. - Key offerings
Edwards Lifesciences Corp. - Segment focus
SWOT

15.10 Getinge AB

Getinge AB - Overview
Getinge AB - Business segments
Getinge AB - Key offerings
Getinge AB - Segment focus
SWOT

15.11 Haemonetics Corp.

Haemonetics Corp. - Overview
Haemonetics Corp. - Business segments
Haemonetics Corp. - Key offerings
Haemonetics Corp. - Segment focus
SWOT

15.12 Johnson and Johnson

Johnson and Johnson - Overview
Johnson and Johnson - Business segments
Johnson and Johnson - Key news
Johnson and Johnson - Key offerings
Johnson and Johnson - Segment focus
SWOT

15.13 LeMaitre Vascular Inc.

LeMaitre Vascular Inc. - Overview
LeMaitre Vascular Inc. - Product / Service
LeMaitre Vascular Inc. - Key offerings
SWOT

15.14 LivaNova PLC

LivaNova PLC - Overview
LivaNova PLC - Business segments
LivaNova PLC - Key offerings
LivaNova PLC - Segment focus
SWOT

15.15 Medtronic Plc

Medtronic Plc - Overview
Medtronic Plc - Business segments
Medtronic Plc - Key news
Medtronic Plc - Key offerings
Medtronic Plc - Segment focus
SWOT

15.16 Merit Medical Systems Inc.

Merit Medical Systems Inc. - Overview
Merit Medical Systems Inc. - Business segments
Merit Medical Systems Inc. - Key offerings
Merit Medical Systems Inc. - Segment focus
SWOT

15.17 Teleflex Inc.

Teleflex Inc. - Overview
Teleflex Inc. - Business segments
Teleflex Inc. - Key news
Teleflex Inc. - Key offerings
Teleflex Inc. - Segment focus
SWOT

15.18 Terumo Corp.

Terumo Corp. - Overview
Terumo Corp. - Business segments
Terumo Corp. - Key news
Terumo Corp. - Key offerings
Terumo Corp. - Segment focus
SWOT

16. Appendix

16.1 Scope of the report

Market definition
Objectives
Notes and caveats

16.2 Inclusions and exclusions checklist

Inclusions checklist
Exclusions checklist

16.3 Currency conversion rates for US$

16.4 Research methodology

16.5 Data procurement

Information sources

16.6 Data validation

16.7 Validation techniques employed for market sizing

16.8 Data synthesis

16.9 360 degree market analysis

16.10 List of abbreviations

Research Methodology

Technavio presents a detailed picture of the market by way of study, synthesis, and summation of data from multiple sources. The analysts have presented the various facets of the market with a particular focus on identifying the key industry influencers. The data thus presented is comprehensive, reliable, and the result of extensive research, both primary and secondary.

INFORMATION SOURCES

Primary sources

  • Manufacturers and suppliers
  • Channel partners
  • Industry experts
  • Strategic decision makers

Secondary sources

  • Industry journals and periodicals
  • Government data
  • Financial reports of key industry players
  • Historical data
  • Press releases

DATA ANALYSIS

Data Synthesis

  • Collation of data
  • Estimation of key figures
  • Analysis of derived insights

Data Validation

  • Triangulation with data models
  • Reference against proprietary databases
  • Corroboration with industry experts

REPORT WRITING

Qualitative

  • Market drivers
  • Market challenges
  • Market trends
  • Five forces analysis

Quantitative

  • Market size and forecast
  • Market segmentation
  • Geographical insights
  • Competitive landscape

Interested in this report?

Get your sample now to see our research methodology and insights!

Download Now

Frequently Asked Questions

Coronary Artery Bypass Grafting market growth will increase by USD 33369.3 thousand thousand during 2026-2030.

The Coronary Artery Bypass Grafting market is expected to grow at a CAGR of 4.5% during 2026-2030.

Coronary Artery Bypass Grafting market is segmented by Technology (On-pump, Off-pump, Minimally invasive surgery) Type (Triple CABG, Quadruple CABG, Double CABG, Single CABG) Product (Cardiopulmonary bypass machines, Vessel harvesting systems, Heart stabilizers and positioning systems)

Abbott Laboratories, Artivion Inc., B.Braun SE, Baxter International Inc., Boston Scientific Corp., Edwards Lifesciences Corp., Gebruder Martin GmbH and Co., Genesee BioMedical Inc., Getinge AB, Haemonetics Corp., Johnson and Johnson, LeMaitre Vascular Inc., LivaNova PLC, Medtronic Plc, Merit Medical Systems Inc., Peters Surgical, Scanlan International, Teleflex Inc., Terumo Corp., Transonic Systems Inc., W. L. Gore and Associates Inc. are a few of the key vendors in the Coronary Artery Bypass Grafting market.

North America will register the highest growth rate of 40.8% among the other regions. Therefore, the Coronary Artery Bypass Grafting market in North America is expected to garner significant business opportunities for the vendors during the forecast period.

US, Canada, Mexico, Germany, UK, France, Italy, Spain, The Netherlands, China, India, Japan, South Korea, Indonesia, Thailand, Brazil, Saudi Arabia, UAE, Turkey, Argentina, Colombia, South Africa, Israel

  • Continuous innovation in cardiovascular surgical technologies is the driving factor this market.

The Coronary Artery Bypass Grafting market vendors should focus on grabbing business opportunities from the Technology segment as it accounted for the largest market share in the base year.
RIA - Research AI Assistant
Ask RIA
