
Commercial Printing Market Analysis, Size, and Forecast 2026-2030: APAC (China, Japan, and India), North America (US, Canada, and Mexico), Europe (Germany, UK, and France), South America (Brazil, Argentina, and Chile), Middle East and Africa (Saudi Arabia, UAE, and South Africa), and Rest of World (ROW)

Commercial Printing Market Analysis, Size, and Forecast 2026-2030:
APAC (China, Japan, and India), North America (US, Canada, and Mexico), Europe (Germany, UK, and France), South America (Brazil, Argentina, and Chile), Middle East and Africa (Saudi Arabia, UAE, and South Africa), and Rest of World (ROW)

Published: Oct 2026 315 Pages SKU: IRTNTR70758

Market Overview at a Glance

$59.25 B
Market Opportunity
2.8%
CAGR 2025 - 2030
47.5%
APAC Growth
$192.95 B
Packaging segment 2024

Commercial Printing Market Size 2026-2030

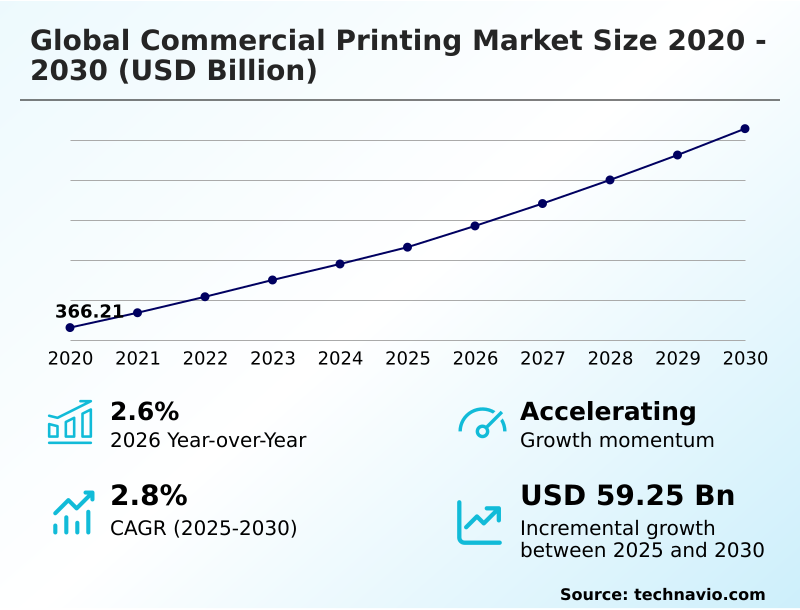
The commercial printing market size is valued to increase by USD 59.25 billion, at a CAGR of 2.8% from 2025 to 2030. Artificial intelligence driving operational print efficiency will drive the commercial printing market.

Major Market Trends & Insights

  • APAC dominated the market and accounted for a 47.5% growth during the forecast period.
  • By Application - Packaging segment was valued at USD 192.95 billion in 2024
  • By Type - Offset lithography segment accounted for the largest market revenue share in 2024

Market Size & Forecast

  • Market Opportunities: USD 99.45 billion
  • Market Future Opportunities: USD 59.25 billion
  • CAGR from 2025 to 2030 : 2.8%

Market Summary

  • Commercial Printing operations continually adapt to integrate intelligent manufacturing workflows and high-speed digital output capabilities. Organizations across the packaging and advertising sectors leverage AI-driven diagnostic tools to preemptively identify mechanical failures, thereby ensuring consistent production uptime. When operators implement automated color management systems, prepress processing times are frequently reduced by up to 40% compared to legacy analog configurations.
  • The primary driver accelerating operational print efficiency remains the integration of artificial intelligence, which streamlines complex job ticketing and drastically minimizes expensive material waste. Conversely, rising operational costs and supply chain fragility present significant structural challenges, as volatile prices for specialized print substrates and specialized chemical inks repeatedly compress operating margins.
  • Manufacturers navigating these constraints increasingly prioritize localized material procurement to stabilize inventory levels. By adopting predictive maintenance algorithms alongside closed-loop recycling programs, facilities enhance their overall equipment effectiveness and comply with stringent sustainability mandates.

What will be the Size of the Commercial Printing Market during the forecast period?
Get Key Insights on Market Forecast (PDF) Get Free Sample

How is the Commercial Printing Market Segmented?

The commercial printing industry research report provides comprehensive data (region-wise segment analysis), with forecasts and estimates in "USD million" for the period 2026-2030, as well as historical data from 2020-2024 for the following segments.

  • Application
    • Packaging
    • Advertising
    • Publishing
    • Others
  • Type
    • Offset lithography
    • Inkjet
    • Flexographic
    • Screen
    • Others
  • End-user
    • Food and beverage
    • Retail
    • Pharmaceutical
    • Automotive
    • Electronics
  • Geography
    • APAC
      • China
      • Japan
      • India
      • South Korea
      • Australia
      • Indonesia
    • North America
      • US
      • Canada
      • Mexico
    • Europe
      • Germany
      • UK
      • France
      • Italy
      • Spain
      • The Netherlands
    • South America
      • Brazil
      • Argentina
      • Chile
    • Middle East and Africa
      • Saudi Arabia
      • UAE
      • South Africa
      • Israel
      • Turkey

By Application Insights

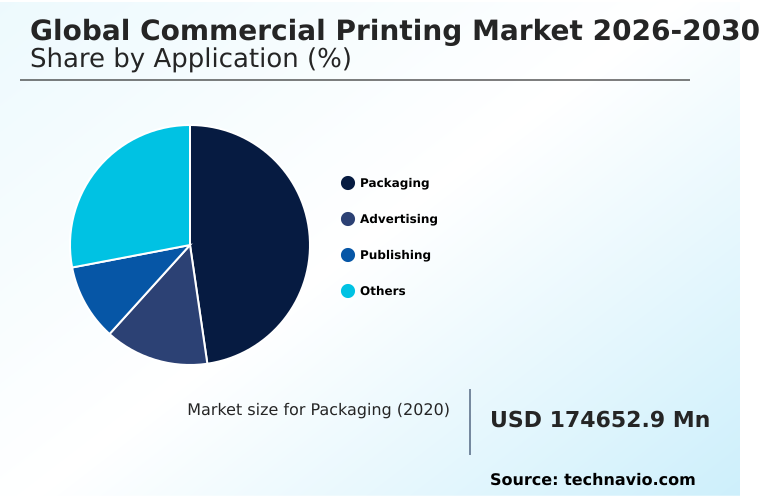
The packaging segment is estimated to witness significant growth during the forecast period.

The packaging sector in the Commercial Printing landscape continuously evolves, integrating advanced flexographic printing and digital inkjet approaches. As e-commerce expands, manufacturers adapt photopolymer plates to accelerate short-run production cycles.

Businesses increasingly adopt sustainable substrates like post-consumer recycled boards and employ soy-based inks alongside water-based coatings to satisfy stringent compliance mandates. This transition facilitates circular economy packaging while maintaining shelf appeal.

Integrating smart packaging integration enables enhanced supply chain traceability, reducing misrouting errors by an estimated 15%. Furthermore, pharmaceutical-grade inks and specialized corrugated board printing help producers target customized buyer demographics efficiently.

Ultimately, incorporating biodegradable packaging materials alongside precision non-porous material adhesion redefines operational output, positioning high-fidelity structural design as a cornerstone of inventory optimization strategies.
Get Free Sample

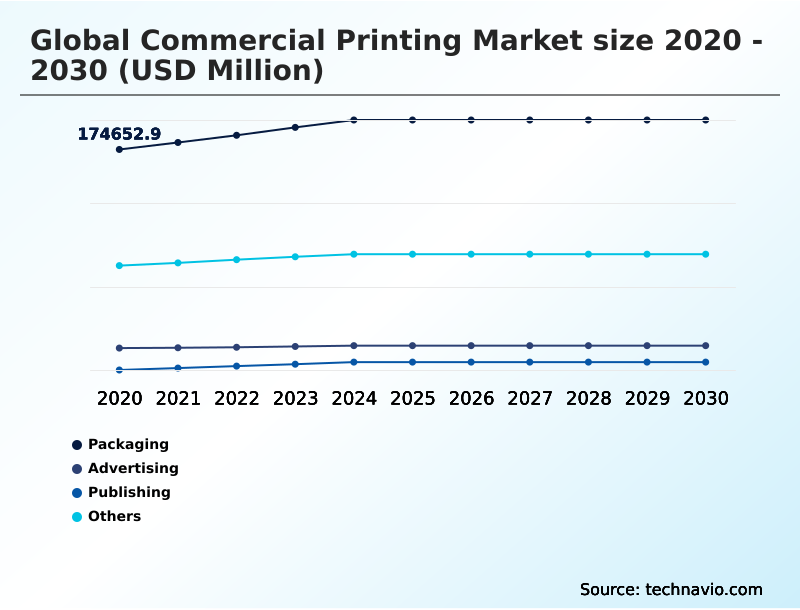
The Packaging segment was valued at USD 192.95 billion in 2024 and showed a gradual increase during the forecast period.
Get Free Sample

Regional Analysis

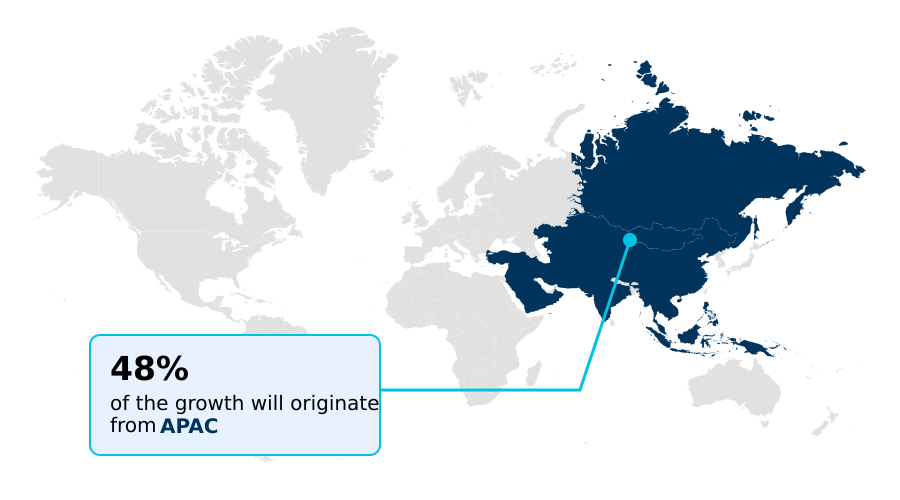
APAC is estimated to contribute 47.5% to the growth of the global market during the forecast period.Technavio’s analysts have elaborately explained the regional trends and drivers that shape the market during the forecast period.
See How Commercial Printing Market Demand is Rising in APAC Get Free Sample

The APAC region currently dictates the expansion of the Commercial Printing landscape, heavily outpacing North America due to aggressive investments in textile digital printing and specialized retail packaging.

While North American facilities focus on consolidating hybrid press workflows to improve short-run agility, APAC producers harness advanced digital inkjet deposition to scale high-volume consumer goods branding.

Integrating IoT equipment monitoring allows Asian manufacturers to reduce machine downtime by roughly 22%, whereas North American operators prioritize cloud-based print management to achieve a 15% reduction in decentralized administrative overhead.

The deployment of automated quality inspection systems further enables seamless cross-border compliance. In both territories, the rapid adoption of UV-cured inks facilitates immediate substrate drying, enhancing overall manufacturing throughput by nearly 30% and addressing strict just-in-time inventory strategies effectively.

Market Dynamics

Our researchers analyzed the data with 2025 as the base year, along with the key drivers, trends, and challenges. A holistic analysis of drivers will help companies refine their marketing strategies to gain a competitive advantage.

  • Operating within the contemporary Commercial Printing environment requires sophisticated integration of digital and analog capabilities. As brands increasingly demand personalized marketing collateral, the execution of variable data direct mail campaigns relies heavily on automated prepress workflow software integration to eliminate manual design bottlenecks.
  • This structural shift allows facilities to support short-run print on demand strategies efficiently, bypassing the excessive warehousing overhead typically associated with static bulk production. In the packaging sector, operators combine traditional methods with modern innovation through hybrid digital flexographic packaging production, ensuring rapid versioning capabilities.
  • Regulatory pressures actively reshape material sourcing, pushing providers toward sustainable forest certified printing substrates and requiring strict water-based ink environmental compliance to satisfy corporate sustainability objectives. For sensitive consumer goods, the adoption of low migration pharmaceutical packaging inks is non-negotiable to maintain product safety parameters.
  • Furthermore, security printing with microscopic signatures and smart packaging with NFC tags have become pivotal for supply chain authentication, deterring counterfeiters more effectively than legacy holograms. Engaging modern consumers also dictates the use of augmented reality integrated print collateral, bridging the gap between physical media and digital platforms.
  • To guarantee precise brand consistency across these diverse outputs, facilities utilize AI powered automated color management alongside cloud managed web-to-print portals. Simultaneously, high speed industrial inkjet processes leverage predictive maintenance for lithographic presses and specialized eco-friendly soy-based ink applications, achieving an indirect 20% operational efficiency gain by maximizing machine uptime compared to reactive servicing protocols.
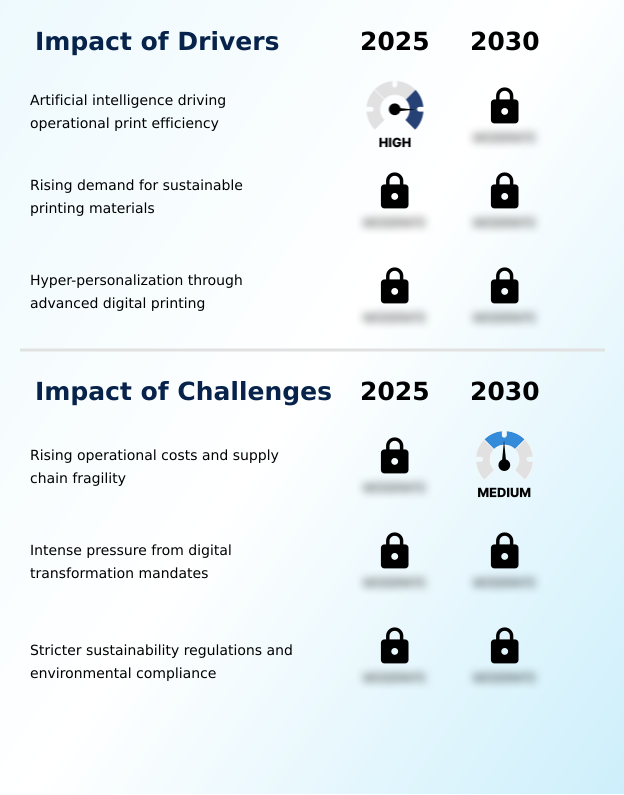
What are the key market drivers leading to the rise in the adoption of Commercial Printing Industry?

  • The integration of artificial intelligence represents a primary catalyst driving operational print efficiency, effectively streamlining workflows and minimizing material waste across the production cycle.

  • Hyper-personalization and intelligent automation operate as the primary drivers propelling the Commercial Printing evolution.
  • As marketers strive to bypass digital advertising fatigue, incorporating augmented reality print integration alongside near-field communication tags transforms static mailers into interactive consumer portals, boosting direct response rates by over 30%.
  • This behavioral shift compels manufacturers to utilize advanced print-on-demand modeling, fundamentally mitigating inventory obsolescence. To sustain these high-frequency, customized runs, facilities deploy AI-driven diagnostics across modern servo-driven presses, successfully decreasing unexpected mechanical downtime by approximately 22%.
  • Furthermore, the adoption of sophisticated color management systems ensures impeccable brand consistency, allowing operators to achieve unparalleled industrial labeling precision. These technological implementations effectively lower material waste by 15%, aligning operational agility with strict environmental stewardship objectives.

What are the market trends shaping the Commercial Printing Industry?

  • Digital transformation is significantly accelerating production workflow efficiencies, representing a pivotal trend shaping Commercial Printing operations. This operational shift enables enhanced precision and automated resource management across high-volume printing facilities.

  • The integration of specialized finishing and authentication techniques represents a transformative shift in the Commercial Printing workflow, directly driven by escalating counterfeit risks and premium brand differentiation. Facilities rapidly adopt advanced variable data software combined with microscopic digital signatures to establish resilient supply chain traceability for luxury and pharmaceutical goods. This integration reduces unauthorized product diversion by an estimated 25%.
  • Simultaneously, the transition from traditional holographic security elements toward embedded digital verification significantly enhances authentication speeds at customs checkpoints. To elevate consumer unboxing experiences, brands implement tactile packaging elements utilizing precise digital varnish capabilities, which increases localized brand engagement metrics by up to 18% compared to standard flat designs.
  • Furthermore, the deployment of high-speed thermal transfer printing allows localized distribution hubs to apply regional compliance data instantly, slashing last-mile packaging bottlenecks by nearly 20% and ensuring rapid market responsiveness.

What challenges does the Commercial Printing Industry face during its growth?

  • Escalating operational costs coupled with supply chain fragility form a critical structural challenge that substantially constrains the profit margins of commercial print service providers.

  • Strict environmental compliance mandates and volatile raw material pricing impose substantial structural limitations on the Commercial Printing output. As regulatory frameworks aggressively enforce volatilized organic compounds reduction, print providers face immense pressure to transition toward advanced water-based coatings and specialized soy-based inks. This sudden chemical reformulation often disrupts existing press calibrations, temporarily reducing throughput efficiency by roughly 15%.
  • Additionally, securing high-quality sustainable substrates, particularly certified post-consumer recycled boards, exposes manufacturers to severe supply chain bottlenecks and localized price inflation. Implementing stringent chemical migration prevention protocols for food-grade packaging further elevates operational expenses.
  • Although adopting predictive demand analytics partially mitigates inventory hoarding, the initial capital expenditure required to upgrade legacy hardware for eco-friendly material compatibility lowers short-term operating margins by an estimated 12% across mid-sized print facilities.

Exclusive Technavio Analysis on Customer Landscape

The commercial printing market forecasting report includes the adoption lifecycle of the market, covering from the innovator’s stage to the laggard’s stage. It focuses on adoption rates in different regions based on penetration. Furthermore, the commercial printing market report also includes key purchase criteria and drivers of price sensitivity to help companies evaluate and develop their market growth analysis strategies.
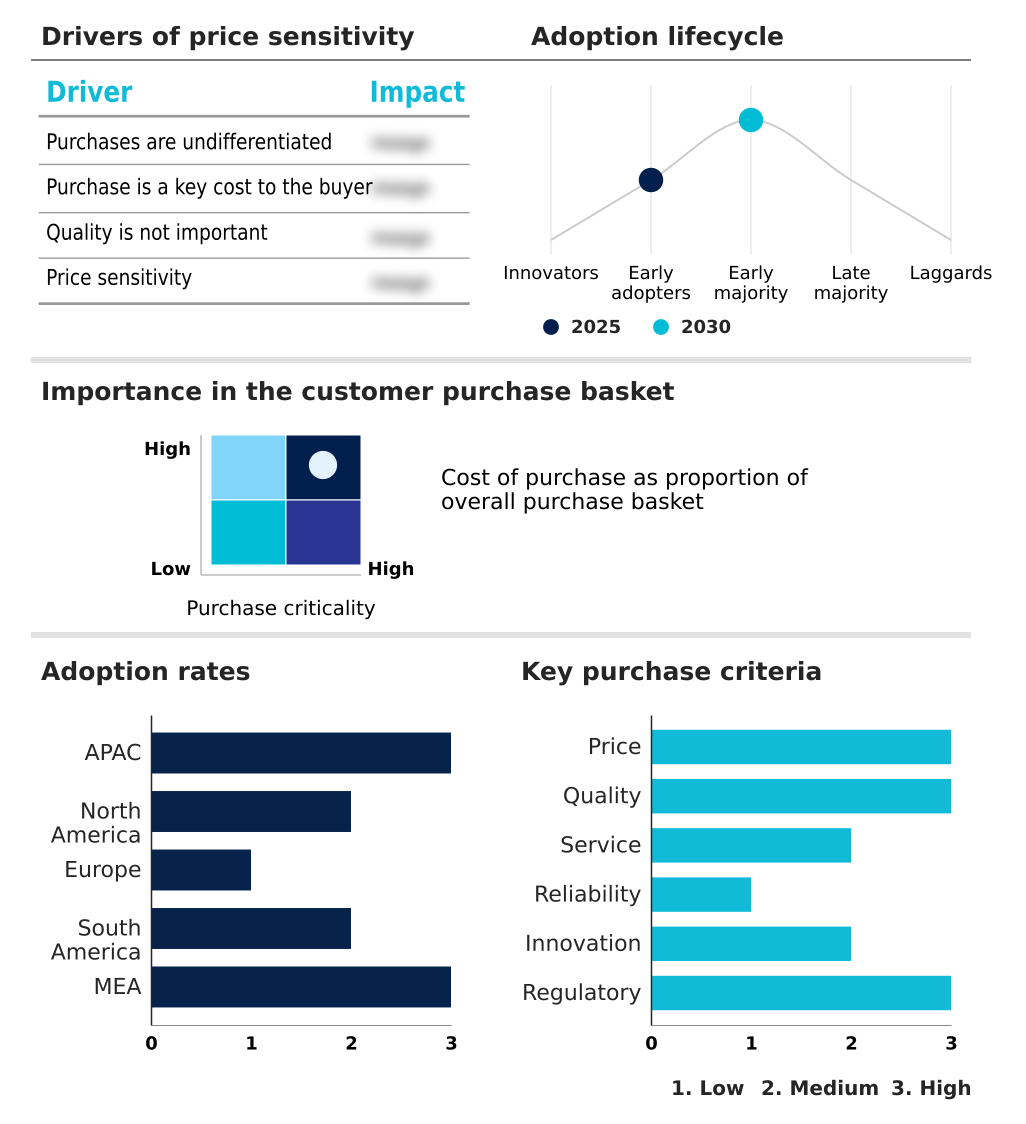
Customer Landscape of Commercial Printing Industry

Competitive Landscape

Companies are implementing various strategies, such as strategic alliances, commercial printing market forecast, partnerships, mergers and acquisitions, geographical expansion, and product/service launches, to enhance their presence in the industry.

AlphaGraphics Inc. - The enterprise delivers diverse commercial printing solutions spanning digital signage, customized business communications, and marketing collateral to optimize enterprise visibility and streamline localized promotional operations.

The industry research and growth report includes detailed analyses of the competitive landscape of the market and information about key companies, including:

  • AlphaGraphics Inc.
  • Brunswick Press
  • Cenveo Worldwide Ltd.
  • Cimpress Plc
  • Dai Nippon Printing Co. Ltd.
  • Ennis Inc.
  • Gorham Printing Inc.
  • LSC Communications LLC
  • Mittera Group
  • Mixam Inc.
  • Multi Color Corp.
  • O Neil Printing
  • Print Logistics
  • Quad Graphics Inc.
  • Quebecor World Inc.
  • Raksul Inc.
  • Resource Label Group LLC
  • RR Donnelley and Sons Co.
  • Shutterfly Business Solutions
  • Taylor Corp.
  • TOPPAN Holdings Inc.
  • Transcontinental Inc.
  • VistaPrint

Qualitative and quantitative analysis of companies has been conducted to help clients understand the wider business environment as well as the strengths and weaknesses of key industry players. Data is qualitatively analyzed to categorize companies as pure play, category-focused, industry-focused, and diversified; it is quantitatively analyzed to categorize companies as dominant, leading, strong, tentative, and weak.

Recent Development and News in Commercial printing market

  • In the Publishing industry, the transition toward decentralized educational curricula accelerated the adoption of localized print-on-demand modeling, directly impacting Commercial Printing demand by requiring agile facilities capable of producing specialized print substrates while reducing inventory holding costs by 30%.
  • Stringent environmental mandates restricting volatilized organic compounds reduction forced traditional publishers to mandate aqueous ink formulation across supply networks, pushing print service providers to upgrade press hardware for water-based compatibility to retain institutional publishing contracts exceeding 20% volume thresholds.
  • The integration of automated file preparation and variable data software within textbook distribution channels enabled personalized academic materials, driving commercial printers to adopt high-speed digital output systems that increased versioning capabilities by over 25% compared to legacy setups.
  • Advancements in augmented reality print integration for technical manuals transitioned static reference guides into interactive digital portals, compelling commercial printing vendors to implement near-field communication tags and specialized laminates that support omnichannel brand experiences and improve user engagement metrics by 18%.

Dive into Technavio’s robust research methodology, blending expert interviews, extensive data synthesis, and validated models for unparalleled Commercial Printing Market insights. See full methodology.

Market Scope
Page number 315
Base year 2025
Historic period 2020-2024
Forecast period 2026-2030
Growth momentum & CAGR Accelerate at a CAGR of 2.8%
Market growth 2026-2030 USD 59251.4 million
Market structure Fragmented
YoY growth 2025-2026(%) 2.6%
Key countries China, Japan, India, South Korea, Australia, Indonesia, US, Canada, Mexico, Germany, UK, France, Italy, Spain, The Netherlands, Brazil, Argentina, Chile, Saudi Arabia, UAE, South Africa, Israel and Turkey
Competitive landscape Leading Companies, Market Positioning of Companies, Competitive Strategies, and Industry Risks

Request Free Sample

Research Analyst Overview

  • Commercial Printing operations undergo profound structural recalibration as modern enterprises align physical output strategies with digital procurement frameworks. The shift away from legacy offset lithography toward agile variable data printing fundamentally alters boardroom budgeting, allowing procurement directors to minimize obsolete inventory risk through targeted, short-run procurement models.
  • Implementing prepress processing automation and robust web-to-print interfaces enables decentralized marketing teams to order localized collateral seamlessly, effectively cutting administrative processing time by 30% compared to traditional manual order intake. Executive committees increasingly mandate sustainable compliance, driving the transition toward water-conscious dye-sublimation processes and advanced screen printing methodologies that utilize non-toxic curing agents.
  • Furthermore, integrating predictive maintenance algorithms into high-speed manufacturing lines transforms reactive capital expenditure into predictable operational budgeting. By preemptively identifying mechanical degradation, operators avoid catastrophic equipment failures, thereby stabilizing the supply chain and ensuring uninterrupted delivery schedules for critical retail packaging. These technologically driven enhancements directly align tangible manufacturing processes with stringent corporate governance and risk mitigation frameworks.

What are the Key Data Covered in this Commercial Printing Market Research and Growth Report?

  • What is the expected growth of the Commercial Printing Market between 2026 and 2030?

    • USD 59.25 billion, at a CAGR of 2.8%

  • What segmentation does the market report cover?

    • The report is segmented by Application (Packaging, Advertising, Publishing, and Others), Type (Offset lithography, Inkjet, Flexographic, Screen, and Others), End-user (Food and beverage, Retail, Pharmaceutical, Automotive, and Electronics) and Geography (APAC, North America, Europe, South America, Middle East and Africa)

  • Which regions are analyzed in the report?

    • APAC, North America, Europe, South America and Middle East and Africa

  • What are the key growth drivers and market challenges?

    • Artificial intelligence driving operational print efficiency, Rising operational costs and supply chain fragility

  • Who are the major players in the Commercial Printing Market?

    • AlphaGraphics Inc., Brunswick Press, Cenveo Worldwide Ltd., Cimpress Plc, Dai Nippon Printing Co. Ltd., Ennis Inc., Gorham Printing Inc., LSC Communications LLC, Mittera Group, Mixam Inc., Multi Color Corp., O Neil Printing, Print Logistics, Quad Graphics Inc., Quebecor World Inc., Raksul Inc., Resource Label Group LLC, RR Donnelley and Sons Co., Shutterfly Business Solutions, Taylor Corp., TOPPAN Holdings Inc., Transcontinental Inc. and VistaPrint

Market Research Insights

  • The Commercial Printing sector actively shifts toward high-efficiency mass customization to support dynamic marketing and packaging requirements. Facilities adopting automated job ticketing realize up to a 35% improvement in processing speeds, drastically minimizing prepress bottlenecks. Furthermore, the integration of low-migration inks combined with eco-certified substrates supports sustainable omnichannel brand experiences, reducing environmental compliance deviations by over 20%.
  • By facilitating just-in-time inventory reduction, modern print service providers decrease warehousing overhead by nearly 15%, ensuring that short-run production cycles align accurately with localized consumer demand. This structural optimization ensures superior output quality while strictly controlling overall operational expenditures.

We can help! Our analysts can customize this commercial printing market research report to meet your requirements.

Get in touch

1. Executive Summary

1.1 Market overview

Executive Summary - Chart on Market Overview
Executive Summary - Data Table on Market Overview
Executive Summary - Chart on Global Market Characteristics
Executive Summary - Chart on Market by Geography
Executive Summary - Chart on Market Segmentation by Application
Executive Summary - Chart on Market Segmentation by Type
Executive Summary - Chart on Market Segmentation by End-user
Executive Summary - Chart on Incremental Growth
Executive Summary - Data Table on Incremental Growth
Executive Summary - Chart on Company Market Positioning

2. Technavio Analysis

2.1 Analysis of price sensitivity, lifecycle, customer purchase basket, adoption rates, and purchase criteria

2.2 Criticality of inputs and Factors of differentiation

Chart on Overview on criticality of inputs and factors of differentiation

2.3 Factors of disruption

Chart on Overview on factors of disruption

2.4 Impact of drivers and challenges

Chart on Impact of drivers and challenges in 2025 and 2030

3. Market Landscape

3.1 Market ecosystem

Chart on Parent Market
Data Table on - Parent Market

3.2 Market characteristics

Chart on Market characteristics analysis

3.3 Value chain analysis

Chart on Value chain analysis

4. Market Sizing

4.1 Market definition

Data Table on Offerings of companies included in the market definition

4.2 Market segment analysis

Market segments

4.3 Market size 2025

4.4 Market outlook: Forecast for 2025-2030

Chart on Global - Market size and forecast 2025-2030 ($ million)
Data Table on Global - Market size and forecast 2025-2030 ($ million)
Chart on Global Market: Year-over-year growth 2025-2030 (%)
Data Table on Global Market: Year-over-year growth 2025-2030 (%)

5. Historic Market Size

5.1 Global Commercial Printing Market 2020 - 2024

Historic Market Size - Data Table on Global Commercial Printing Market 2020 - 2024 ($ million)

5.2 Application segment analysis 2020 - 2024

Historic Market Size - Application Segment 2020 - 2024 ($ million)

5.3 Type segment analysis 2020 - 2024

Historic Market Size - Type Segment 2020 - 2024 ($ million)

5.4 End-user segment analysis 2020 - 2024

Historic Market Size - End-user Segment 2020 - 2024 ($ million)

5.5 Geography segment analysis 2020 - 2024

Historic Market Size - Geography Segment 2020 - 2024 ($ million)

5.6 Country segment analysis 2020 - 2024

Historic Market Size - Country Segment 2020 - 2024 ($ million)

6. Qualitative Analysis

6.1 Impact of AI on Global Commercial Printing Market

6.2 Impact of geopolitical conflicts on Global Commercial Printing Market

7. Five Forces Analysis

7.1 Five forces summary

Five forces analysis - Comparison between 2025 and 2030

7.2 Bargaining power of buyers

Bargaining power of buyers - Impact of key factors 2025 and 2030

7.3 Bargaining power of suppliers

Bargaining power of suppliers - Impact of key factors in 2025 and 2030

7.4 Threat of new entrants

Threat of new entrants - Impact of key factors in 2025 and 2030

7.5 Threat of substitutes

Threat of substitutes - Impact of key factors in 2025 and 2030

7.6 Threat of rivalry

Threat of rivalry - Impact of key factors in 2025 and 2030

7.7 Market condition

Chart on Market condition - Five forces 2025 and 2030

8. Market Segmentation by Application

8.1 Market segments

Chart on Application - Market share 2025-2030 (%)
Data Table on Application - Market share 2025-2030 (%)

8.2 Comparison by Application

Chart on Comparison by Application
Data Table on Comparison by Application

8.3 Packaging - Market size and forecast 2025-2030

Chart on Packaging - Market size and forecast 2025-2030 ($ million)
Data Table on Packaging - Market size and forecast 2025-2030 ($ million)
Chart on Packaging - Year-over-year growth 2025-2030 (%)
Data Table on Packaging - Year-over-year growth 2025-2030 (%)

8.4 Advertising - Market size and forecast 2025-2030

Chart on Advertising - Market size and forecast 2025-2030 ($ million)
Data Table on Advertising - Market size and forecast 2025-2030 ($ million)
Chart on Advertising - Year-over-year growth 2025-2030 (%)
Data Table on Advertising - Year-over-year growth 2025-2030 (%)

8.5 Publishing - Market size and forecast 2025-2030

Chart on Publishing - Market size and forecast 2025-2030 ($ million)
Data Table on Publishing - Market size and forecast 2025-2030 ($ million)
Chart on Publishing - Year-over-year growth 2025-2030 (%)
Data Table on Publishing - Year-over-year growth 2025-2030 (%)

8.6 Others - Market size and forecast 2025-2030

Chart on Others - Market size and forecast 2025-2030 ($ million)
Data Table on Others - Market size and forecast 2025-2030 ($ million)
Chart on Others - Year-over-year growth 2025-2030 (%)
Data Table on Others - Year-over-year growth 2025-2030 (%)

8.7 Market opportunity by Application

Market opportunity by Application ($ million)
Data Table on Market opportunity by Application ($ million)

9. Market Segmentation by Type

9.1 Market segments

Chart on Type - Market share 2025-2030 (%)
Data Table on Type - Market share 2025-2030 (%)

9.2 Comparison by Type

Chart on Comparison by Type
Data Table on Comparison by Type

9.3 Offset lithography - Market size and forecast 2025-2030

Chart on Offset lithography - Market size and forecast 2025-2030 ($ million)
Data Table on Offset lithography - Market size and forecast 2025-2030 ($ million)
Chart on Offset lithography - Year-over-year growth 2025-2030 (%)
Data Table on Offset lithography - Year-over-year growth 2025-2030 (%)

9.4 Inkjet - Market size and forecast 2025-2030

Chart on Inkjet - Market size and forecast 2025-2030 ($ million)
Data Table on Inkjet - Market size and forecast 2025-2030 ($ million)
Chart on Inkjet - Year-over-year growth 2025-2030 (%)
Data Table on Inkjet - Year-over-year growth 2025-2030 (%)

9.5 Flexographic - Market size and forecast 2025-2030

Chart on Flexographic - Market size and forecast 2025-2030 ($ million)
Data Table on Flexographic - Market size and forecast 2025-2030 ($ million)
Chart on Flexographic - Year-over-year growth 2025-2030 (%)
Data Table on Flexographic - Year-over-year growth 2025-2030 (%)

9.6 Screen - Market size and forecast 2025-2030

Chart on Screen - Market size and forecast 2025-2030 ($ million)
Data Table on Screen - Market size and forecast 2025-2030 ($ million)
Chart on Screen - Year-over-year growth 2025-2030 (%)
Data Table on Screen - Year-over-year growth 2025-2030 (%)

9.7 Others - Market size and forecast 2025-2030

Chart on Others - Market size and forecast 2025-2030 ($ million)
Data Table on Others - Market size and forecast 2025-2030 ($ million)
Chart on Others - Year-over-year growth 2025-2030 (%)
Data Table on Others - Year-over-year growth 2025-2030 (%)

9.8 Market opportunity by Type

Market opportunity by Type ($ million)
Data Table on Market opportunity by Type ($ million)

10. Market Segmentation by End-user

10.1 Market segments

Chart on End-user - Market share 2025-2030 (%)
Data Table on End-user - Market share 2025-2030 (%)

10.2 Comparison by End-user

Chart on Comparison by End-user
Data Table on Comparison by End-user

10.3 Food and beverage - Market size and forecast 2025-2030

Chart on Food and beverage - Market size and forecast 2025-2030 ($ million)
Data Table on Food and beverage - Market size and forecast 2025-2030 ($ million)
Chart on Food and beverage - Year-over-year growth 2025-2030 (%)
Data Table on Food and beverage - Year-over-year growth 2025-2030 (%)

10.4 Retail - Market size and forecast 2025-2030

Chart on Retail - Market size and forecast 2025-2030 ($ million)
Data Table on Retail - Market size and forecast 2025-2030 ($ million)
Chart on Retail - Year-over-year growth 2025-2030 (%)
Data Table on Retail - Year-over-year growth 2025-2030 (%)

10.5 Pharmaceutical - Market size and forecast 2025-2030

Chart on Pharmaceutical - Market size and forecast 2025-2030 ($ million)
Data Table on Pharmaceutical - Market size and forecast 2025-2030 ($ million)
Chart on Pharmaceutical - Year-over-year growth 2025-2030 (%)
Data Table on Pharmaceutical - Year-over-year growth 2025-2030 (%)

10.6 Automotive - Market size and forecast 2025-2030

Chart on Automotive - Market size and forecast 2025-2030 ($ million)
Data Table on Automotive - Market size and forecast 2025-2030 ($ million)
Chart on Automotive - Year-over-year growth 2025-2030 (%)
Data Table on Automotive - Year-over-year growth 2025-2030 (%)

10.7 Electronics - Market size and forecast 2025-2030

Chart on Electronics - Market size and forecast 2025-2030 ($ million)
Data Table on Electronics - Market size and forecast 2025-2030 ($ million)
Chart on Electronics - Year-over-year growth 2025-2030 (%)
Data Table on Electronics - Year-over-year growth 2025-2030 (%)

10.8 Market opportunity by End-user

Market opportunity by End-user ($ million)
Data Table on Market opportunity by End-user ($ million)

11. Customer Landscape

11.1 Customer landscape overview

Analysis of price sensitivity, lifecycle, customer purchase basket, adoption rates, and purchase criteria

12. Geographic Landscape

12.1 Geographic segmentation

Chart on Market share by geography 2025-2030 (%)
Data Table on Market share by geography 2025-2030 (%)

12.2 Geographic comparison

Chart on Geographic comparison
Data Table on Geographic comparison

12.3 APAC - Market size and forecast 2025-2030

Chart on APAC - Market size and forecast 2025-2030 ($ million)
Data Table on APAC - Market size and forecast 2025-2030 ($ million)
Chart on APAC - Year-over-year growth 2025-2030 (%)
Data Table on APAC - Year-over-year growth 2025-2030 (%)
Chart on Regional Comparison - APAC
Data Table on Regional Comparison - APAC

12.3.1 China - Market size and forecast 2025-2030

Chart on China - Market size and forecast 2025-2030 ($ million)
Data Table on China - Market size and forecast 2025-2030 ($ million)
Chart on China - Year-over-year growth 2025-2030 (%)
Data Table on China - Year-over-year growth 2025-2030 (%)

12.3.2 Japan - Market size and forecast 2025-2030

Chart on Japan - Market size and forecast 2025-2030 ($ million)
Data Table on Japan - Market size and forecast 2025-2030 ($ million)
Chart on Japan - Year-over-year growth 2025-2030 (%)
Data Table on Japan - Year-over-year growth 2025-2030 (%)

12.3.3 India - Market size and forecast 2025-2030

Chart on India - Market size and forecast 2025-2030 ($ million)
Data Table on India - Market size and forecast 2025-2030 ($ million)
Chart on India - Year-over-year growth 2025-2030 (%)
Data Table on India - Year-over-year growth 2025-2030 (%)

12.3.4 South Korea - Market size and forecast 2025-2030

Chart on South Korea - Market size and forecast 2025-2030 ($ million)
Data Table on South Korea - Market size and forecast 2025-2030 ($ million)
Chart on South Korea - Year-over-year growth 2025-2030 (%)
Data Table on South Korea - Year-over-year growth 2025-2030 (%)

12.3.5 Australia - Market size and forecast 2025-2030

Chart on Australia - Market size and forecast 2025-2030 ($ million)
Data Table on Australia - Market size and forecast 2025-2030 ($ million)
Chart on Australia - Year-over-year growth 2025-2030 (%)
Data Table on Australia - Year-over-year growth 2025-2030 (%)

12.3.6 Indonesia - Market size and forecast 2025-2030

Chart on Indonesia - Market size and forecast 2025-2030 ($ million)
Data Table on Indonesia - Market size and forecast 2025-2030 ($ million)
Chart on Indonesia - Year-over-year growth 2025-2030 (%)
Data Table on Indonesia - Year-over-year growth 2025-2030 (%)

12.4 North America - Market size and forecast 2025-2030

Chart on North America - Market size and forecast 2025-2030 ($ million)
Data Table on North America - Market size and forecast 2025-2030 ($ million)
Chart on North America - Year-over-year growth 2025-2030 (%)
Data Table on North America - Year-over-year growth 2025-2030 (%)
Chart on Regional Comparison - North America
Data Table on Regional Comparison - North America

12.4.1 US - Market size and forecast 2025-2030

Chart on US - Market size and forecast 2025-2030 ($ million)
Data Table on US - Market size and forecast 2025-2030 ($ million)
Chart on US - Year-over-year growth 2025-2030 (%)
Data Table on US - Year-over-year growth 2025-2030 (%)

12.4.2 Canada - Market size and forecast 2025-2030

Chart on Canada - Market size and forecast 2025-2030 ($ million)
Data Table on Canada - Market size and forecast 2025-2030 ($ million)
Chart on Canada - Year-over-year growth 2025-2030 (%)
Data Table on Canada - Year-over-year growth 2025-2030 (%)

12.4.3 Mexico - Market size and forecast 2025-2030

Chart on Mexico - Market size and forecast 2025-2030 ($ million)
Data Table on Mexico - Market size and forecast 2025-2030 ($ million)
Chart on Mexico - Year-over-year growth 2025-2030 (%)
Data Table on Mexico - Year-over-year growth 2025-2030 (%)

12.5 Europe - Market size and forecast 2025-2030

Chart on Europe - Market size and forecast 2025-2030 ($ million)
Data Table on Europe - Market size and forecast 2025-2030 ($ million)
Chart on Europe - Year-over-year growth 2025-2030 (%)
Data Table on Europe - Year-over-year growth 2025-2030 (%)
Chart on Regional Comparison - Europe
Data Table on Regional Comparison - Europe

12.5.1 Germany - Market size and forecast 2025-2030

Chart on Germany - Market size and forecast 2025-2030 ($ million)
Data Table on Germany - Market size and forecast 2025-2030 ($ million)
Chart on Germany - Year-over-year growth 2025-2030 (%)
Data Table on Germany - Year-over-year growth 2025-2030 (%)

12.5.2 UK - Market size and forecast 2025-2030

Chart on UK - Market size and forecast 2025-2030 ($ million)
Data Table on UK - Market size and forecast 2025-2030 ($ million)
Chart on UK - Year-over-year growth 2025-2030 (%)
Data Table on UK - Year-over-year growth 2025-2030 (%)

12.5.3 France - Market size and forecast 2025-2030

Chart on France - Market size and forecast 2025-2030 ($ million)
Data Table on France - Market size and forecast 2025-2030 ($ million)
Chart on France - Year-over-year growth 2025-2030 (%)
Data Table on France - Year-over-year growth 2025-2030 (%)

12.5.4 Italy - Market size and forecast 2025-2030

Chart on Italy - Market size and forecast 2025-2030 ($ million)
Data Table on Italy - Market size and forecast 2025-2030 ($ million)
Chart on Italy - Year-over-year growth 2025-2030 (%)
Data Table on Italy - Year-over-year growth 2025-2030 (%)

12.5.5 Spain - Market size and forecast 2025-2030

Chart on Spain - Market size and forecast 2025-2030 ($ million)
Data Table on Spain - Market size and forecast 2025-2030 ($ million)
Chart on Spain - Year-over-year growth 2025-2030 (%)
Data Table on Spain - Year-over-year growth 2025-2030 (%)

12.5.6 The Netherlands - Market size and forecast 2025-2030

Chart on The Netherlands - Market size and forecast 2025-2030 ($ million)
Data Table on The Netherlands - Market size and forecast 2025-2030 ($ million)
Chart on The Netherlands - Year-over-year growth 2025-2030 (%)
Data Table on The Netherlands - Year-over-year growth 2025-2030 (%)

12.6 South America - Market size and forecast 2025-2030

Chart on South America - Market size and forecast 2025-2030 ($ million)
Data Table on South America - Market size and forecast 2025-2030 ($ million)
Chart on South America - Year-over-year growth 2025-2030 (%)
Data Table on South America - Year-over-year growth 2025-2030 (%)
Chart on Regional Comparison - South America
Data Table on Regional Comparison - South America

12.6.1 Brazil - Market size and forecast 2025-2030

Chart on Brazil - Market size and forecast 2025-2030 ($ million)
Data Table on Brazil - Market size and forecast 2025-2030 ($ million)
Chart on Brazil - Year-over-year growth 2025-2030 (%)
Data Table on Brazil - Year-over-year growth 2025-2030 (%)

12.6.2 Argentina - Market size and forecast 2025-2030

Chart on Argentina - Market size and forecast 2025-2030 ($ million)
Data Table on Argentina - Market size and forecast 2025-2030 ($ million)
Chart on Argentina - Year-over-year growth 2025-2030 (%)
Data Table on Argentina - Year-over-year growth 2025-2030 (%)

12.6.3 Chile - Market size and forecast 2025-2030

Chart on Chile - Market size and forecast 2025-2030 ($ million)
Data Table on Chile - Market size and forecast 2025-2030 ($ million)
Chart on Chile - Year-over-year growth 2025-2030 (%)
Data Table on Chile - Year-over-year growth 2025-2030 (%)

12.7 Middle East and Africa - Market size and forecast 2025-2030

Chart on Middle East and Africa - Market size and forecast 2025-2030 ($ million)
Data Table on Middle East and Africa - Market size and forecast 2025-2030 ($ million)
Chart on Middle East and Africa - Year-over-year growth 2025-2030 (%)
Data Table on Middle East and Africa - Year-over-year growth 2025-2030 (%)
Chart on Regional Comparison - Middle East and Africa
Data Table on Regional Comparison - Middle East and Africa

12.7.1 Saudi Arabia - Market size and forecast 2025-2030

Chart on Saudi Arabia - Market size and forecast 2025-2030 ($ million)
Data Table on Saudi Arabia - Market size and forecast 2025-2030 ($ million)
Chart on Saudi Arabia - Year-over-year growth 2025-2030 (%)
Data Table on Saudi Arabia - Year-over-year growth 2025-2030 (%)

12.7.2 UAE - Market size and forecast 2025-2030

Chart on UAE - Market size and forecast 2025-2030 ($ million)
Data Table on UAE - Market size and forecast 2025-2030 ($ million)
Chart on UAE - Year-over-year growth 2025-2030 (%)
Data Table on UAE - Year-over-year growth 2025-2030 (%)

12.7.3 South Africa - Market size and forecast 2025-2030

Chart on South Africa - Market size and forecast 2025-2030 ($ million)
Data Table on South Africa - Market size and forecast 2025-2030 ($ million)
Chart on South Africa - Year-over-year growth 2025-2030 (%)
Data Table on South Africa - Year-over-year growth 2025-2030 (%)

12.7.4 Israel - Market size and forecast 2025-2030

Chart on Israel - Market size and forecast 2025-2030 ($ million)
Data Table on Israel - Market size and forecast 2025-2030 ($ million)
Chart on Israel - Year-over-year growth 2025-2030 (%)
Data Table on Israel - Year-over-year growth 2025-2030 (%)

12.7.5 Turkey - Market size and forecast 2025-2030

Chart on Turkey - Market size and forecast 2025-2030 ($ million)
Data Table on Turkey - Market size and forecast 2025-2030 ($ million)
Chart on Turkey - Year-over-year growth 2025-2030 (%)
Data Table on Turkey - Year-over-year growth 2025-2030 (%)

12.8 Market opportunity by geography

Market opportunity by geography ($ million)
Data Tables on Market opportunity by geography ($ million)

13. Drivers, Challenges, and Opportunity

13.1 Market drivers

Artificial intelligence driving operational print efficiency
Rising demand for sustainable printing materials
Hyper-personalization through advanced digital printing

13.2 Market challenges

Rising operational costs and supply chain fragility
Intense pressure from digital transformation mandates
Stricter sustainability regulations and environmental compliance

13.3 Impact of drivers and challenges

Impact of drivers and challenges in 2025 and 2030

13.4 Market opportunities

Digital transformation accelerating production workflow efficiencies
Sustainability imperatives driving material innovation adoption
Integrating predictive maintenance for enhanced operational uptime

14. Competitive Landscape

14.1 Overview

14.2

Overview on criticality of inputs and factors of differentiation

14.3 Landscape disruption

Overview on factors of disruption

14.4 Industry risks

Impact of key risks on business

15. Competitive Analysis

15.1 Companies profiled

Companies covered

15.2 Company ranking index

15.3 Market positioning of companies

Matrix on companies position and classification

15.4 AlphaGraphics Inc.

AlphaGraphics Inc. - Overview
AlphaGraphics Inc. - Product / Service
AlphaGraphics Inc. - Key offerings
SWOT

15.5 Cenveo Worldwide Ltd.

Cenveo Worldwide Ltd. - Overview
Cenveo Worldwide Ltd. - Product / Service
Cenveo Worldwide Ltd. - Key offerings
SWOT

15.6 Cimpress Plc

Cimpress Plc - Overview
Cimpress Plc - Business segments
Cimpress Plc - Key offerings
Cimpress Plc - Segment focus
SWOT

15.7 Dai Nippon Printing Co. Ltd.

Dai Nippon Printing Co. Ltd. - Overview
Dai Nippon Printing Co. Ltd. - Business segments
Dai Nippon Printing Co. Ltd. - Key offerings
Dai Nippon Printing Co. Ltd. - Segment focus
SWOT

15.8 Ennis Inc.

Ennis Inc. - Overview
Ennis Inc. - Product / Service
Ennis Inc. - Key offerings
SWOT

15.9 LSC Communications LLC

LSC Communications LLC - Overview
LSC Communications LLC - Product / Service
LSC Communications LLC - Key offerings
SWOT

15.10 Mittera Group

Mittera Group - Overview
Mittera Group - Product / Service
Mittera Group - Key offerings
SWOT

15.11 Multi Color Corp.

Multi Color Corp. - Overview
Multi Color Corp. - Product / Service
Multi Color Corp. - Key offerings
SWOT

15.12 Quad Graphics Inc.

Quad Graphics Inc. - Overview
Quad Graphics Inc. - Product / Service
Quad Graphics Inc. - Key offerings
SWOT

15.13 Quebecor World Inc.

Quebecor World Inc. - Overview
Quebecor World Inc. - Product / Service
Quebecor World Inc. - Key offerings
SWOT

15.14 Raksul Inc.

Raksul Inc. - Overview
Raksul Inc. - Business segments
Raksul Inc. - Key offerings
Raksul Inc. - Segment focus
SWOT

15.15 Resource Label Group LLC

Resource Label Group LLC - Overview
Resource Label Group LLC - Product / Service
Resource Label Group LLC - Key offerings
SWOT

15.16 RR Donnelley and Sons Co.

RR Donnelley and Sons Co. - Overview
RR Donnelley and Sons Co. - Product / Service
RR Donnelley and Sons Co. - Key offerings
SWOT

15.17 Shutterfly Business Solutions

Shutterfly Business Solutions - Overview
Shutterfly Business Solutions - Product / Service
Shutterfly Business Solutions - Key offerings
SWOT

15.18 TOPPAN Holdings Inc.

TOPPAN Holdings Inc. - Overview
TOPPAN Holdings Inc. - Business segments
TOPPAN Holdings Inc. - Key news
TOPPAN Holdings Inc. - Key offerings
TOPPAN Holdings Inc. - Segment focus
SWOT

16. Appendix

16.1 Scope of the report

Market definition
Objectives
Notes and caveats

16.2 Inclusions and exclusions checklist

Inclusions checklist
Exclusions checklist

16.3 Currency conversion rates for US$

16.4 Research methodology

16.5 Data procurement

Information sources

16.6 Data validation

16.7 Validation techniques employed for market sizing

16.8 Data synthesis

16.9 360 degree market analysis

16.10 List of abbreviations

Research Methodology

Technavio presents a detailed picture of the market by way of study, synthesis, and summation of data from multiple sources. The analysts have presented the various facets of the market with a particular focus on identifying the key industry influencers. The data thus presented is comprehensive, reliable, and the result of extensive research, both primary and secondary.

INFORMATION SOURCES

Primary sources

  • Manufacturers and suppliers
  • Channel partners
  • Industry experts
  • Strategic decision makers

Secondary sources

  • Industry journals and periodicals
  • Government data
  • Financial reports of key industry players
  • Historical data
  • Press releases

DATA ANALYSIS

Data Synthesis

  • Collation of data
  • Estimation of key figures
  • Analysis of derived insights

Data Validation

  • Triangulation with data models
  • Reference against proprietary databases
  • Corroboration with industry experts

REPORT WRITING

Qualitative

  • Market drivers
  • Market challenges
  • Market trends
  • Five forces analysis

Quantitative

  • Market size and forecast
  • Market segmentation
  • Geographical insights
  • Competitive landscape

Interested in this report?

Get your sample now to see our research methodology and insights!

Download Now

Frequently Asked Questions

Commercial Printing market growth will increase by USD 59251.4 million during 2026-2030.

The Commercial Printing market is expected to grow at a CAGR of 2.8% during 2026-2030.

Commercial Printing market is segmented by Application (Packaging, Advertising, Publishing, Others) Type (Offset lithography, Inkjet, Flexographic, Screen, Others) End-user (Food and beverage, Retail, Pharmaceutical, Automotive, Electronics)

AlphaGraphics Inc., Brunswick Press, Cenveo Worldwide Ltd., Cimpress Plc, Dai Nippon Printing Co. Ltd., Ennis Inc., Gorham Printing Inc., LSC Communications LLC, Mittera Group, Mixam Inc., Multi Color Corp., O Neil Printing, Print Logistics, Quad Graphics Inc., Quebecor World Inc., Raksul Inc., Resource Label Group LLC, RR Donnelley and Sons Co., Shutterfly Business Solutions, Taylor Corp., TOPPAN Holdings Inc., Transcontinental Inc., VistaPrint are a few of the key vendors in the Commercial Printing market.

APAC will register the highest growth rate of 47.5% among the other regions. Therefore, the Commercial Printing market in APAC is expected to garner significant business opportunities for the vendors during the forecast period.

China, Japan, India, South Korea, Australia, Indonesia, US, Canada, Mexico, Germany, UK, France, Italy, Spain, The Netherlands, Brazil, Argentina, Chile, Saudi Arabia, UAE, South Africa, Israel, Turkey

  • Artificial intelligence driving operational print efficiency is the driving factor this market.

The Commercial Printing market vendors should focus on grabbing business opportunities from the Application segment as it accounted for the largest market share in the base year.
RIA - Research AI Assistant
Ask RIA
