Cleanroom Storage Cabinet Market Analysis, Size, and Forecast 2026-2030: APAC (China, Japan, and South Korea), North America (US, Canada, and Mexico), Europe (Germany, UK, and France), South America (Brazil, Argentina, and Colombia), Middle East and Africa (Saudi Arabia, UAE, and South Africa), and Rest of World (ROW)

Cleanroom Storage Cabinet Market Analysis, Size, and Forecast 2026-2030:
APAC (China, Japan, and South Korea), North America (US, Canada, and Mexico), Europe (Germany, UK, and France), South America (Brazil, Argentina, and Colombia), Middle East and Africa (Saudi Arabia, UAE, and South Africa), and Rest of World (ROW)

Published: Apr 2026 299 Pages SKU: IRTNTR70269

Market Overview at a Glance

$707.9 Mn
Market Opportunity
10.6%
CAGR 2025 - 2030
42.5%
APAC Growth
$503.1 Mn
Medical segment 2024

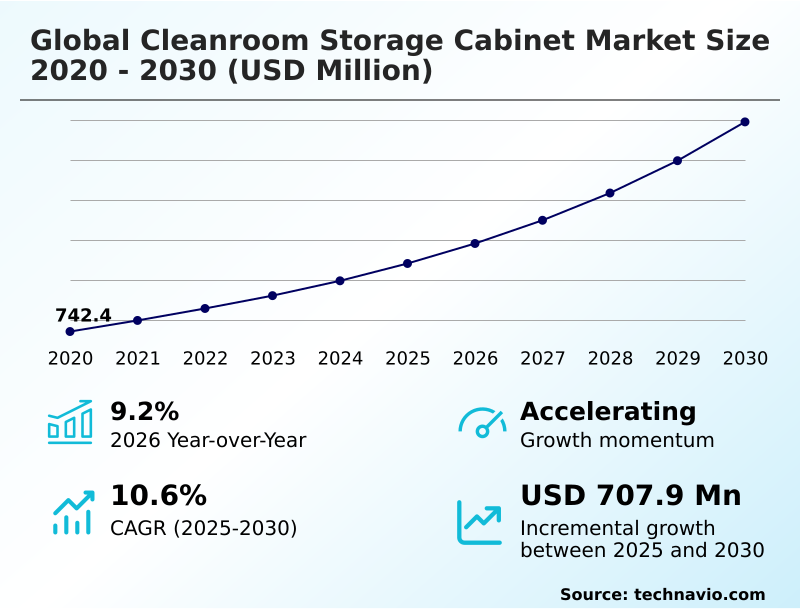
Cleanroom Storage Cabinet Market Size 2026-2030

The cleanroom storage cabinet market size is valued to increase by USD 707.9 million, at a CAGR of 10.6% from 2025 to 2030. Robust expansion of pharmaceutical and biotechnology industries will drive the cleanroom storage cabinet market.

Major Market Trends & Insights

  • APAC dominated the market and accounted for a 42.5% growth during the forecast period.
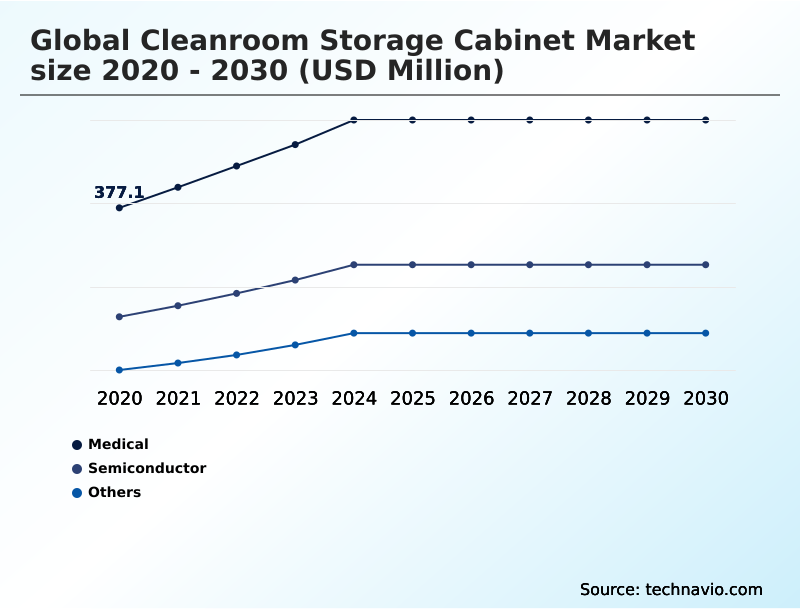
  • By End-user - Medical segment was valued at USD 503.1 million in 2024
  • By Type - Stainless steel segment accounted for the largest market revenue share in 2024

Market Size & Forecast

  • Market Opportunities: USD 1.05 billion
  • Market Future Opportunities: USD 707.9 million
  • CAGR from 2025 to 2030 : 10.6%

Market Summary

  • The cleanroom storage cabinet market is expanding as industries demand stricter contamination control for high-value manufacturing and research. Growth is driven by the pharmaceutical and semiconductor sectors, where particulate contamination control is essential for product integrity and yield. A key trend is the integration of smart technologies, transforming cabinets into networked assets with environmental monitoring systems for temperature and humidity.
  • For instance, a biologics facility can use cabinets with differential pressure monitoring and laminar airflow to ensure an aseptic environment, automatically logging access and conditions to streamline validation documentation and meet cGMP compliance. This enhances operational efficiency and reduces the risk of contamination.
  • However, the market faces challenges from volatile raw material prices and the need to adapt designs for automated robotics. The diversification into new applications, like advanced battery manufacturing and aerospace, further propels the need for specialized solutions, including nitrogen-purged desiccator cabinets. Success hinges on providing customized, compliant, and intelligent storage solutions that address these complex industrial requirements for biocontamination control.

What will be the Size of the Cleanroom Storage Cabinet Market during the forecast period?

Get Key Insights on Market Forecast (PDF) Request Free Sample

How is the Cleanroom Storage Cabinet Market Segmented?

The cleanroom storage cabinet industry research report provides comprehensive data (region-wise segment analysis), with forecasts and estimates in "USD million" for the period 2026-2030, as well as historical data from 2020-2024 for the following segments.

  • End-user
    • Medical
    • Semiconductor
    • Others
  • Type
    • Stainless steel
    • Plastic
  • Product
    • Tall cabinets
    • Wall-mounted cabinets
    • Pass-through cabinets
    • Under-counter cabinets
    • Mobile cabinets
  • Geography
    • APAC
      • China
      • Japan
      • South Korea
    • North America
      • US
      • Canada
      • Mexico
    • Europe
      • Germany
      • UK
      • France
    • South America
      • Brazil
      • Argentina
      • Colombia
    • Middle East and Africa
      • Saudi Arabia
      • UAE
      • South Africa
    • Rest of World (ROW)

By End-user Insights

The medical segment is estimated to witness significant growth during the forecast period.

The medical segment's demand is driven by the absolute necessity for an aseptic environment in applications ranging from pharmaceutical research and development to medical device manufacturing.

Adherence to Good Manufacturing Practices (GMP) and other strict regulations necessitates advanced sterile storage solutions for sterile instrument storage and clinical trial material storage.

Effective biocontamination control is paramount, with facilities investing heavily in equipment that supports aseptic compounding and provides particulate-free storage. Achieving cGMP compliance through comprehensive cleanroom validation services has been shown to reduce contamination-related batch failures by over 15%.

This focus on validated sterile manufacturing supplies underscores the critical role of specialized storage in maintaining product integrity and patient safety.

Request Free Sample

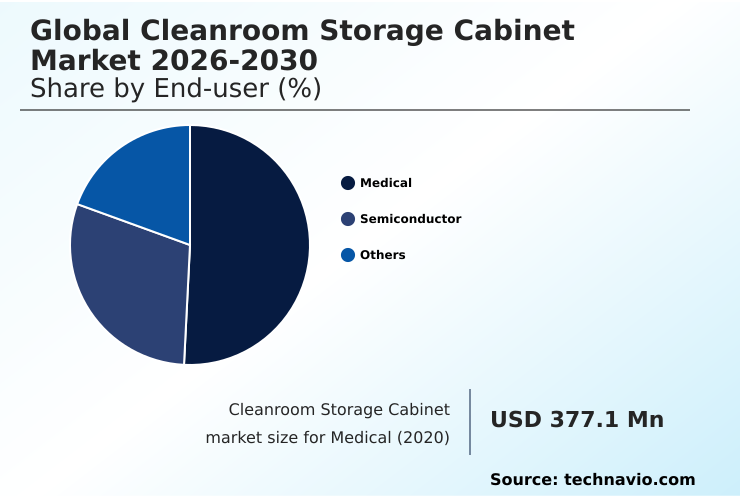
The Medical segment was valued at USD 503.1 million in 2024 and showed a gradual increase during the forecast period.

Request Free Sample

Regional Analysis

APAC is estimated to contribute 42.5% to the growth of the global market during the forecast period.Technavio’s analysts have elaborately explained the regional trends and drivers that shape the market during the forecast period.

See How Cleanroom Storage Cabinet Market Demand is Rising in APAC Request Free Sample

The geographic landscape is dominated by APAC, which accounts for over 42% of the market’s incremental growth, driven by its leadership in semiconductor and electronics manufacturing.

The construction of new semiconductor fabrication plant facilities requires advanced equipment with features like outgassing prevention. North America and Europe are also significant, with strong pharmaceutical and biotechnology sectors focusing on gene therapy manufacturing and viral vector production.

In Europe, demand is increasing from automotive electronics manufacturing and solid-state battery production. For example, facilities are adopting turnkey sterile storage solution systems, which can accelerate project completion by up to 20% compared to sourcing individual components.

This is crucial for applications from sterile compounding area setups to large-scale biologics manufacturing. Specialized requirements also come from the aerospace sector for optical systems assembly and satellite component protection.

Market Dynamics

Our researchers analyzed the data with 2025 as the base year, along with the key drivers, trends, and challenges. A holistic analysis of drivers will help companies refine their marketing strategies to gain a competitive advantage.

  • Strategic decisions in acquiring cleanroom storage solutions require a detailed analysis of operational needs and total cost of ownership. The choice between polypropylene vs stainless steel cabinets often depends on the specific chemicals used, while a cleanroom cabinet with UV-C sterilization offers enhanced aseptic assurance.
  • For facilities focused on microelectronics, an ESD safe cleanroom storage cabinet is non-negotiable, and the specifications for a cleanroom cabinet for semiconductor fabs are among the most stringent. In pharmaceuticals, a HEPA filtered garment storage cabinet is standard for gowning areas, and a pass-through cabinet for sterile processing is essential for material transfer.
  • The cost of building a cleanroom is a major factor, pushing many to adopt mobile cleanroom storage cabinet solutions and modular cleanroom furniture for flexibility to adapt to changing workflows. For instance, facilities using modular designs report project deployment times that are up to 30% faster than traditional construction.
  • The cleanroom cabinet validation process is critical for ensuring compliance with ISO 7 cleanroom storage requirements. Customization is also key, as seen in demand for custom cleanroom cabinet design specifications for temperature controlled cleanroom storage and specialized gowning room storage for sterile garments.
  • Desiccator cabinets for moisture control are vital in battery manufacturing, and the nitrogen purge desiccator cabinet cost must be weighed against the high cost of product failure. Finally, understanding aseptic processing storage best practices is essential for designing effective cleanroom furniture for pharmaceutical labs and ensuring efficient cleanroom storage for sterile compounding with anti-static cabinets for electronics.

What are the key market drivers leading to the rise in the adoption of Cleanroom Storage Cabinet Industry?

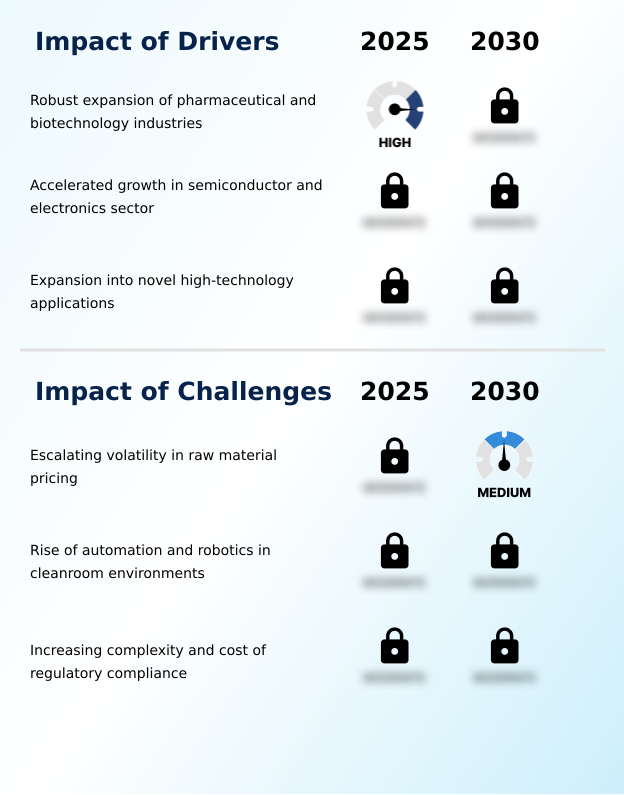
  • The robust and sustained expansion of the pharmaceutical and biotechnology industries serves as a primary driver propelling growth in the global cleanroom storage cabinet market.

  • Market growth is driven by the robust expansion of pharmaceutical and biotechnology industries, where maintaining an aseptic environment is critical.
  • The need for sterile storage solutions that support cGMP compliance and prevent biocontamination control is paramount for applications like medical device manufacturing.
  • Simultaneously, the accelerated growth in semiconductor and electronics sector fuels demand for specialized equipment that ensures particulate contamination control for semiconductor wafer storage. These systems have been shown to improve manufacturing yields by over 5% by minimizing defects.
  • A third driver is the expansion into novel high-technology applications, such as advanced battery manufacturing, which requires nitrogen-purged desiccator cabinets to prevent moisture contamination and ensure product performance.

What are the market trends shaping the Cleanroom Storage Cabinet Industry?

  • The integration of Industry 4.0 and smart technologies is a key market trend. This is transforming passive storage units into intelligent, networked assets within a connected cleanroom ecosystem.

  • A key trend is the integration of smart technologies into modular cleanroom furniture, transforming controlled environment storage into intelligent assets. Modern cabinets feature integrated environmental monitoring systems that provide real-time data on temperature, humidity, and differential pressure monitoring, ensuring compliance with ISO 14644 standards. This cleanroom workflow optimization can reduce monitoring labor by up to 30%.
  • Advanced units incorporate HEPA filtration and UV-C sterilization to maintain particulate-free storage conditions, vital for aseptic processing. Digitalization also enhances cleanroom material handling and simplifies validation documentation with automated logging, which cuts audit preparation time by 25%. This shift toward intelligent, adaptable systems supports more efficient and compliant operations.

What challenges does the Cleanroom Storage Cabinet Industry face during its growth?

  • Escalating volatility in the pricing of essential raw materials, such as stainless steel and specialized polymers, poses a significant challenge to manufacturers and affects market stability.

  • The market faces challenges from the escalating volatility in raw material pricing, particularly for materials like electropolished stainless steel and corrosion-resistant polymers, which can increase production costs by 10-15% unpredictably. Another challenge is the rise of automation and robotics in cleanroom environments, which alters demand from standard laboratory casework solutions to specialized, robot-compatible units for aseptic fill-finish operations.
  • Finally, the increasing complexity and cost of regulatory compliance requires significant investment in testing and cleanroom validation services. This burden is particularly high for manufacturers of pharmaceutical cleanroom equipment and biotechnology lab furniture, impacting both large companies and contract development and manufacturing organization (CDMO) partners trying to maintain profitability.

Exclusive Technavio Analysis on Customer Landscape

The cleanroom storage cabinet market forecasting report includes the adoption lifecycle of the market, covering from the innovator’s stage to the laggard’s stage. It focuses on adoption rates in different regions based on penetration. Furthermore, the cleanroom storage cabinet market report also includes key purchase criteria and drivers of price sensitivity to help companies evaluate and develop their market growth analysis strategies.

Customer Landscape of Cleanroom Storage Cabinet Industry

Competitive Landscape

Companies are implementing various strategies, such as strategic alliances, cleanroom storage cabinet market forecast, partnerships, mergers and acquisitions, geographical expansion, and product/service launches, to enhance their presence in the industry.

AirClean Systems - Offers specialized filtered storage cabinets designed for secure chemical and biological safety in controlled environments, protecting critical materials and medical probes from contamination.

The industry research and growth report includes detailed analyses of the competitive landscape of the market and information about key companies, including:

  • AirClean Systems
  • Azbil Telstar SL
  • Biobase Biodusty Shandong Co. Ltd.
  • Clean Air Products
  • Cleatech LLC
  • Connect 2 Cleanrooms Ltd.
  • Eagle Group
  • Erlab DFS
  • Esco Lifesciences
  • Germfree Laboratories Inc.
  • HEMCO Corp.
  • Integrated Cleanroom Technologies
  • Kewaunee Scientific Corp.
  • Laminar Flow Inc.
  • Nicomac Srl
  • Palbam AC Ltd.
  • Sentry Air Systems Inc.
  • Technical Air Products
  • Terra Universal Inc.
  • Thermo Fisher Scientific Inc.

Qualitative and quantitative analysis of companies has been conducted to help clients understand the wider business environment as well as the strengths and weaknesses of key industry players. Data is qualitatively analyzed to categorize companies as pure play, category-focused, industry-focused, and diversified; it is quantitatively analyzed to categorize companies as dominant, leading, strong, tentative, and weak.

Recent Development and News in Cleanroom storage cabinet market

  • In March 2025, Honeywell and Camfil formed a strategic partnership to provide integrated modular cleanroom and filtration solutions tailored for the life sciences manufacturing sector.
  • In February 2025, a leading international biotechnology consortium announced a multi-billion dollar investment for a new viral vector manufacturing facility in Singapore, aimed at producing components for next-generation gene therapies.
  • In March 2025, a major technology conglomerate announced a landmark investment to build a new semiconductor fabrication plant in Germany, designed for sub-5-nanometer chip production.
  • In May 2025, a major European automotive group announced a fifty billion Euro investment to construct multiple gigafactories for solid-state battery production, requiring ISO 6 certified dry rooms.

Dive into Technavio’s robust research methodology, blending expert interviews, extensive data synthesis, and validated models for unparalleled Cleanroom Storage Cabinet Market insights. See full methodology.

Market Scope
Page number 299
Base year 2025
Historic period 2020-2024
Forecast period 2026-2030
Growth momentum & CAGR Accelerate at a CAGR of 10.6%
Market growth 2026-2030 USD 707.9 million
Market structure Fragmented
YoY growth 2025-2026(%) 9.2%
Key countries China, Japan, South Korea, India, Malaysia, Singapore, US, Canada, Mexico, Germany, UK, France, Italy, Spain, The Netherlands, Brazil, Argentina, Colombia, Saudi Arabia, UAE, South Africa, Turkey and Egypt
Competitive landscape Leading Companies, Market Positioning of Companies, Competitive Strategies, and Industry Risks

Request Free Sample

Research Analyst Overview

  • The cleanroom storage cabinet market is defined by its role in enabling high-stakes manufacturing and research where particulate contamination control is paramount. The core technology centers on creating an aseptic environment through advanced systems like HEPA filtration, laminar airflow, and UV-C sterilization. Materials are critical, with electropolished stainless steel, corrosion-resistant polymers, and other non-shedding materials being standard for ensuring chemical-resistant surfaces.
  • Adherence to ISO 14644 standards and cGMP compliance is mandatory, requiring extensive validation documentation for all equipment, from a desiccator cabinet to a pass-through chamber. Boardroom decisions are increasingly influenced by the need for equipment that supports both current and future operational models.
  • For example, the integration of environmental monitoring systems for differential pressure monitoring can reduce manual compliance checks by over 40%. The demand for specialized solutions like nitrogen-purged desiccator units for outgassing prevention in optics, anti-static properties in electronics, and robust gowning room furniture for cleanroom garment storage is growing.
  • The market is moving toward modular cleanroom furniture with cleanroom-grade casters to offer flexibility, supporting everything from aseptic processing and biocontamination control to creating a dedicated sterile compounding area with turnkey sterile storage solution. This evolution is about delivering microbial contamination prevention, sterile storage solutions and enabling cleanroom workflow optimization for sterile instrument storage and aseptic material transfer.

What are the Key Data Covered in this Cleanroom Storage Cabinet Market Research and Growth Report?

  • What is the expected growth of the Cleanroom Storage Cabinet Market between 2026 and 2030?

    • USD 707.9 million, at a CAGR of 10.6%

  • What segmentation does the market report cover?

    • The report is segmented by End-user (Medical, Semiconductor, and Others), Type (Stainless steel, and Plastic), Product (Tall cabinets, Wall-mounted cabinets, Pass-through cabinets, Under-counter cabinets, and Mobile cabinets) and Geography (APAC, North America, Europe, South America, Middle East and Africa)

  • Which regions are analyzed in the report?

    • APAC, North America, Europe, South America and Middle East and Africa

  • What are the key growth drivers and market challenges?

    • Robust expansion of pharmaceutical and biotechnology industries, Escalating volatility in raw material pricing

  • Who are the major players in the Cleanroom Storage Cabinet Market?

    • AirClean Systems, Azbil Telstar SL, Biobase Biodusty Shandong Co. Ltd., Clean Air Products, Cleatech LLC, Connect 2 Cleanrooms Ltd., Eagle Group, Erlab DFS, Esco Lifesciences, Germfree Laboratories Inc., HEMCO Corp., Integrated Cleanroom Technologies, Kewaunee Scientific Corp., Laminar Flow Inc., Nicomac Srl, Palbam AC Ltd., Sentry Air Systems Inc., Technical Air Products, Terra Universal Inc. and Thermo Fisher Scientific Inc.

Market Research Insights

  • The market is shaped by a shift toward specialized solutions for diverse industrial needs. The adoption of controlled environment storage in biotechnology lab furniture and for semiconductor wafer storage is standard. However, expansion into aerospace cleanroom applications and electronics assembly environment demands new functionalities. For instance, integrated systems improve cleanroom material handling efficiency by over 25% compared to manual processes.
  • This is critical for aseptic fill-finish operations and medical device manufacturing, where adherence to Good Manufacturing Practices (GMP) is non-negotiable. Furthermore, end-to-end cleanroom validation services for pharmaceutical cleanroom equipment can reduce compliance documentation errors by 18%, a vital metric for operations in sterile manufacturing supplies, aseptic compounding, and particulate-free storage.
  • The focus is now on delivering systems for complex environments like ISO Class 5 cleanroom facilities and optimizing the cleanroom gowning procedure through better laboratory casework solutions.

We can help! Our analysts can customize this cleanroom storage cabinet market research report to meet your requirements.

Get in touch

1. Executive Summary

1.1 Market overview

Executive Summary - Chart on Market Overview
Executive Summary - Data Table on Market Overview
Executive Summary - Chart on Global Market Characteristics
Executive Summary - Chart on Market by Geography
Executive Summary - Chart on Market Segmentation by End-user
Executive Summary - Chart on Market Segmentation by Type
Executive Summary - Chart on Market Segmentation by Product
Executive Summary - Chart on Incremental Growth
Executive Summary - Data Table on Incremental Growth
Executive Summary - Chart on Company Market Positioning

2. Technavio Analysis

2.1 Analysis of price sensitivity, lifecycle, customer purchase basket, adoption rates, and purchase criteria

2.2 Criticality of inputs and Factors of differentiation

Chart on Overview on criticality of inputs and factors of differentiation

2.3 Factors of disruption

Chart on Overview on factors of disruption

2.4 Impact of drivers and challenges

Chart on Impact of drivers and challenges in 2025 and 2030

3. Market Landscape

3.1 Market ecosystem

Chart on Parent Market
Data Table on - Parent Market

3.2 Market characteristics

Chart on Market characteristics analysis

3.3 Value chain analysis

Chart on Value chain analysis

4. Market Sizing

4.1 Market definition

Data Table on Offerings of companies included in the market definition

4.2 Market segment analysis

Market segments

4.3 Market size 2025

4.4 Market outlook: Forecast for 2025-2030

Chart on Global - Market size and forecast 2025-2030 ($ million)
Data Table on Global - Market size and forecast 2025-2030 ($ million)
Chart on Global Market: Year-over-year growth 2025-2030 (%)
Data Table on Global Market: Year-over-year growth 2025-2030 (%)

5. Historic Market Size

5.1 Global Cleanroom Storage Cabinet Market 2020 - 2024

Historic Market Size - Data Table on Global Cleanroom Storage Cabinet Market 2020 - 2024 ($ million)

5.2 End-user segment analysis 2020 - 2024

Historic Market Size - End-user Segment 2020 - 2024 ($ million)

5.3 Type segment analysis 2020 - 2024

Historic Market Size - Type Segment 2020 - 2024 ($ million)

5.4 Product segment analysis 2020 - 2024

Historic Market Size - Product Segment 2020 - 2024 ($ million)

5.5 Geography segment analysis 2020 - 2024

Historic Market Size - Geography Segment 2020 - 2024 ($ million)

5.6 Country segment analysis 2020 - 2024

Historic Market Size - Country Segment 2020 - 2024 ($ million)

6. Qualitative Analysis

6.1 Impact of AI on Global Cleanroom Storage Cabinet Market

6.2 Impact of Geopolitical Conflicts on Global Cleanroom Storage Cabinet Market

7. Five Forces Analysis

7.1 Five forces summary

Five forces analysis - Comparison between 2025 and 2030

7.2 Bargaining power of buyers

Bargaining power of buyers - Impact of key factors 2025 and 2030

7.3 Bargaining power of suppliers

Bargaining power of suppliers - Impact of key factors in 2025 and 2030

7.4 Threat of new entrants

Threat of new entrants - Impact of key factors in 2025 and 2030

7.5 Threat of substitutes

Threat of substitutes - Impact of key factors in 2025 and 2030

7.6 Threat of rivalry

Threat of rivalry - Impact of key factors in 2025 and 2030

7.7 Market condition

Chart on Market condition - Five forces 2025 and 2030

8. Market Segmentation by End-user

8.1 Market segments

Chart on End-user - Market share 2025-2030 (%)
Data Table on End-user - Market share 2025-2030 (%)

8.2 Comparison by End-user

Chart on Comparison by End-user
Data Table on Comparison by End-user

8.3 Medical - Market size and forecast 2025-2030

Chart on Medical - Market size and forecast 2025-2030 ($ million)
Data Table on Medical - Market size and forecast 2025-2030 ($ million)
Chart on Medical - Year-over-year growth 2025-2030 (%)
Data Table on Medical - Year-over-year growth 2025-2030 (%)

8.4 Semiconductor - Market size and forecast 2025-2030

Chart on Semiconductor - Market size and forecast 2025-2030 ($ million)
Data Table on Semiconductor - Market size and forecast 2025-2030 ($ million)
Chart on Semiconductor - Year-over-year growth 2025-2030 (%)
Data Table on Semiconductor - Year-over-year growth 2025-2030 (%)

8.5 Others - Market size and forecast 2025-2030

Chart on Others - Market size and forecast 2025-2030 ($ million)
Data Table on Others - Market size and forecast 2025-2030 ($ million)
Chart on Others - Year-over-year growth 2025-2030 (%)
Data Table on Others - Year-over-year growth 2025-2030 (%)

8.6 Market opportunity by End-user

Market opportunity by End-user ($ million)
Data Table on Market opportunity by End-user ($ million)

9. Market Segmentation by Type

9.1 Market segments

Chart on Type - Market share 2025-2030 (%)
Data Table on Type - Market share 2025-2030 (%)

9.2 Comparison by Type

Chart on Comparison by Type
Data Table on Comparison by Type

9.3 Stainless steel - Market size and forecast 2025-2030

Chart on Stainless steel - Market size and forecast 2025-2030 ($ million)
Data Table on Stainless steel - Market size and forecast 2025-2030 ($ million)
Chart on Stainless steel - Year-over-year growth 2025-2030 (%)
Data Table on Stainless steel - Year-over-year growth 2025-2030 (%)

9.4 Plastic - Market size and forecast 2025-2030

Chart on Plastic - Market size and forecast 2025-2030 ($ million)
Data Table on Plastic - Market size and forecast 2025-2030 ($ million)
Chart on Plastic - Year-over-year growth 2025-2030 (%)
Data Table on Plastic - Year-over-year growth 2025-2030 (%)

9.5 Market opportunity by Type

Market opportunity by Type ($ million)
Data Table on Market opportunity by Type ($ million)

10. Market Segmentation by Product

10.1 Market segments

Chart on Product - Market share 2025-2030 (%)
Data Table on Product - Market share 2025-2030 (%)

10.2 Comparison by Product

Chart on Comparison by Product
Data Table on Comparison by Product

10.3 Tall cabinets - Market size and forecast 2025-2030

Chart on Tall cabinets - Market size and forecast 2025-2030 ($ million)
Data Table on Tall cabinets - Market size and forecast 2025-2030 ($ million)
Chart on Tall cabinets - Year-over-year growth 2025-2030 (%)
Data Table on Tall cabinets - Year-over-year growth 2025-2030 (%)

10.4 Wall-mounted cabinets - Market size and forecast 2025-2030

Chart on Wall-mounted cabinets - Market size and forecast 2025-2030 ($ million)
Data Table on Wall-mounted cabinets - Market size and forecast 2025-2030 ($ million)
Chart on Wall-mounted cabinets - Year-over-year growth 2025-2030 (%)
Data Table on Wall-mounted cabinets - Year-over-year growth 2025-2030 (%)

10.5 Pass-through cabinets - Market size and forecast 2025-2030

Chart on Pass-through cabinets - Market size and forecast 2025-2030 ($ million)
Data Table on Pass-through cabinets - Market size and forecast 2025-2030 ($ million)
Chart on Pass-through cabinets - Year-over-year growth 2025-2030 (%)
Data Table on Pass-through cabinets - Year-over-year growth 2025-2030 (%)

10.6 Under-counter cabinets - Market size and forecast 2025-2030

Chart on Under-counter cabinets - Market size and forecast 2025-2030 ($ million)
Data Table on Under-counter cabinets - Market size and forecast 2025-2030 ($ million)
Chart on Under-counter cabinets - Year-over-year growth 2025-2030 (%)
Data Table on Under-counter cabinets - Year-over-year growth 2025-2030 (%)

10.7 Mobile cabinets - Market size and forecast 2025-2030

Chart on Mobile cabinets - Market size and forecast 2025-2030 ($ million)
Data Table on Mobile cabinets - Market size and forecast 2025-2030 ($ million)
Chart on Mobile cabinets - Year-over-year growth 2025-2030 (%)
Data Table on Mobile cabinets - Year-over-year growth 2025-2030 (%)

10.8 Market opportunity by Product

Market opportunity by Product ($ million)
Data Table on Market opportunity by Product ($ million)

11. Customer Landscape

11.1 Customer landscape overview

Analysis of price sensitivity, lifecycle, customer purchase basket, adoption rates, and purchase criteria

12. Geographic Landscape

12.1 Geographic segmentation

Chart on Market share by geography 2025-2030 (%)
Data Table on Market share by geography 2025-2030 (%)

12.2 Geographic comparison

Chart on Geographic comparison
Data Table on Geographic comparison

12.3 APAC - Market size and forecast 2025-2030

Chart on APAC - Market size and forecast 2025-2030 ($ million)
Data Table on APAC - Market size and forecast 2025-2030 ($ million)
Chart on APAC - Year-over-year growth 2025-2030 (%)
Data Table on APAC - Year-over-year growth 2025-2030 (%)
Chart on Regional Comparison - APAC
Data Table on Regional Comparison - APAC

12.3.1 China - Market size and forecast 2025-2030

Chart on China - Market size and forecast 2025-2030 ($ million)
Data Table on China - Market size and forecast 2025-2030 ($ million)
Chart on China - Year-over-year growth 2025-2030 (%)
Data Table on China - Year-over-year growth 2025-2030 (%)

12.3.2 Japan - Market size and forecast 2025-2030

Chart on Japan - Market size and forecast 2025-2030 ($ million)
Data Table on Japan - Market size and forecast 2025-2030 ($ million)
Chart on Japan - Year-over-year growth 2025-2030 (%)
Data Table on Japan - Year-over-year growth 2025-2030 (%)

12.3.3 South Korea - Market size and forecast 2025-2030

Chart on South Korea - Market size and forecast 2025-2030 ($ million)
Data Table on South Korea - Market size and forecast 2025-2030 ($ million)
Chart on South Korea - Year-over-year growth 2025-2030 (%)
Data Table on South Korea - Year-over-year growth 2025-2030 (%)

12.3.4 India - Market size and forecast 2025-2030

Chart on India - Market size and forecast 2025-2030 ($ million)
Data Table on India - Market size and forecast 2025-2030 ($ million)
Chart on India - Year-over-year growth 2025-2030 (%)
Data Table on India - Year-over-year growth 2025-2030 (%)

12.3.5 Malaysia - Market size and forecast 2025-2030

Chart on Malaysia - Market size and forecast 2025-2030 ($ million)
Data Table on Malaysia - Market size and forecast 2025-2030 ($ million)
Chart on Malaysia - Year-over-year growth 2025-2030 (%)
Data Table on Malaysia - Year-over-year growth 2025-2030 (%)

12.3.6 Singapore - Market size and forecast 2025-2030

Chart on Singapore - Market size and forecast 2025-2030 ($ million)
Data Table on Singapore - Market size and forecast 2025-2030 ($ million)
Chart on Singapore - Year-over-year growth 2025-2030 (%)
Data Table on Singapore - Year-over-year growth 2025-2030 (%)

12.4 North America - Market size and forecast 2025-2030

Chart on North America - Market size and forecast 2025-2030 ($ million)
Data Table on North America - Market size and forecast 2025-2030 ($ million)
Chart on North America - Year-over-year growth 2025-2030 (%)
Data Table on North America - Year-over-year growth 2025-2030 (%)
Chart on Regional Comparison - North America
Data Table on Regional Comparison - North America

12.4.1 US - Market size and forecast 2025-2030

Chart on US - Market size and forecast 2025-2030 ($ million)
Data Table on US - Market size and forecast 2025-2030 ($ million)
Chart on US - Year-over-year growth 2025-2030 (%)
Data Table on US - Year-over-year growth 2025-2030 (%)

12.4.2 Canada - Market size and forecast 2025-2030

Chart on Canada - Market size and forecast 2025-2030 ($ million)
Data Table on Canada - Market size and forecast 2025-2030 ($ million)
Chart on Canada - Year-over-year growth 2025-2030 (%)
Data Table on Canada - Year-over-year growth 2025-2030 (%)

12.4.3 Mexico - Market size and forecast 2025-2030

Chart on Mexico - Market size and forecast 2025-2030 ($ million)
Data Table on Mexico - Market size and forecast 2025-2030 ($ million)
Chart on Mexico - Year-over-year growth 2025-2030 (%)
Data Table on Mexico - Year-over-year growth 2025-2030 (%)

12.5 Europe - Market size and forecast 2025-2030

Chart on Europe - Market size and forecast 2025-2030 ($ million)
Data Table on Europe - Market size and forecast 2025-2030 ($ million)
Chart on Europe - Year-over-year growth 2025-2030 (%)
Data Table on Europe - Year-over-year growth 2025-2030 (%)
Chart on Regional Comparison - Europe
Data Table on Regional Comparison - Europe

12.5.1 Germany - Market size and forecast 2025-2030

Chart on Germany - Market size and forecast 2025-2030 ($ million)
Data Table on Germany - Market size and forecast 2025-2030 ($ million)
Chart on Germany - Year-over-year growth 2025-2030 (%)
Data Table on Germany - Year-over-year growth 2025-2030 (%)

12.5.2 UK - Market size and forecast 2025-2030

Chart on UK - Market size and forecast 2025-2030 ($ million)
Data Table on UK - Market size and forecast 2025-2030 ($ million)
Chart on UK - Year-over-year growth 2025-2030 (%)
Data Table on UK - Year-over-year growth 2025-2030 (%)

12.5.3 France - Market size and forecast 2025-2030

Chart on France - Market size and forecast 2025-2030 ($ million)
Data Table on France - Market size and forecast 2025-2030 ($ million)
Chart on France - Year-over-year growth 2025-2030 (%)
Data Table on France - Year-over-year growth 2025-2030 (%)

12.5.4 Italy - Market size and forecast 2025-2030

Chart on Italy - Market size and forecast 2025-2030 ($ million)
Data Table on Italy - Market size and forecast 2025-2030 ($ million)
Chart on Italy - Year-over-year growth 2025-2030 (%)
Data Table on Italy - Year-over-year growth 2025-2030 (%)

12.5.5 Spain - Market size and forecast 2025-2030

Chart on Spain - Market size and forecast 2025-2030 ($ million)
Data Table on Spain - Market size and forecast 2025-2030 ($ million)
Chart on Spain - Year-over-year growth 2025-2030 (%)
Data Table on Spain - Year-over-year growth 2025-2030 (%)

12.5.6 The Netherlands - Market size and forecast 2025-2030

Chart on The Netherlands - Market size and forecast 2025-2030 ($ million)
Data Table on The Netherlands - Market size and forecast 2025-2030 ($ million)
Chart on The Netherlands - Year-over-year growth 2025-2030 (%)
Data Table on The Netherlands - Year-over-year growth 2025-2030 (%)

12.6 South America - Market size and forecast 2025-2030

Chart on South America - Market size and forecast 2025-2030 ($ million)
Data Table on South America - Market size and forecast 2025-2030 ($ million)
Chart on South America - Year-over-year growth 2025-2030 (%)
Data Table on South America - Year-over-year growth 2025-2030 (%)
Chart on Regional Comparison - South America
Data Table on Regional Comparison - South America

12.6.1 Brazil - Market size and forecast 2025-2030

Chart on Brazil - Market size and forecast 2025-2030 ($ million)
Data Table on Brazil - Market size and forecast 2025-2030 ($ million)
Chart on Brazil - Year-over-year growth 2025-2030 (%)
Data Table on Brazil - Year-over-year growth 2025-2030 (%)

12.6.2 Argentina - Market size and forecast 2025-2030

Chart on Argentina - Market size and forecast 2025-2030 ($ million)
Data Table on Argentina - Market size and forecast 2025-2030 ($ million)
Chart on Argentina - Year-over-year growth 2025-2030 (%)
Data Table on Argentina - Year-over-year growth 2025-2030 (%)

12.6.3 Colombia - Market size and forecast 2025-2030

Chart on Colombia - Market size and forecast 2025-2030 ($ million)
Data Table on Colombia - Market size and forecast 2025-2030 ($ million)
Chart on Colombia - Year-over-year growth 2025-2030 (%)
Data Table on Colombia - Year-over-year growth 2025-2030 (%)

12.7 Middle East and Africa - Market size and forecast 2025-2030

Chart on Middle East and Africa - Market size and forecast 2025-2030 ($ million)
Data Table on Middle East and Africa - Market size and forecast 2025-2030 ($ million)
Chart on Middle East and Africa - Year-over-year growth 2025-2030 (%)
Data Table on Middle East and Africa - Year-over-year growth 2025-2030 (%)
Chart on Regional Comparison - Middle East and Africa
Data Table on Regional Comparison - Middle East and Africa

12.7.1 Saudi Arabia - Market size and forecast 2025-2030

Chart on Saudi Arabia - Market size and forecast 2025-2030 ($ million)
Data Table on Saudi Arabia - Market size and forecast 2025-2030 ($ million)
Chart on Saudi Arabia - Year-over-year growth 2025-2030 (%)
Data Table on Saudi Arabia - Year-over-year growth 2025-2030 (%)

12.7.2 UAE - Market size and forecast 2025-2030

Chart on UAE - Market size and forecast 2025-2030 ($ million)
Data Table on UAE - Market size and forecast 2025-2030 ($ million)
Chart on UAE - Year-over-year growth 2025-2030 (%)
Data Table on UAE - Year-over-year growth 2025-2030 (%)

12.7.3 South Africa - Market size and forecast 2025-2030

Chart on South Africa - Market size and forecast 2025-2030 ($ million)
Data Table on South Africa - Market size and forecast 2025-2030 ($ million)
Chart on South Africa - Year-over-year growth 2025-2030 (%)
Data Table on South Africa - Year-over-year growth 2025-2030 (%)

12.7.4 Turkey - Market size and forecast 2025-2030

Chart on Turkey - Market size and forecast 2025-2030 ($ million)
Data Table on Turkey - Market size and forecast 2025-2030 ($ million)
Chart on Turkey - Year-over-year growth 2025-2030 (%)
Data Table on Turkey - Year-over-year growth 2025-2030 (%)

12.7.5 Egypt - Market size and forecast 2025-2030

Chart on Egypt - Market size and forecast 2025-2030 ($ million)
Data Table on Egypt - Market size and forecast 2025-2030 ($ million)
Chart on Egypt - Year-over-year growth 2025-2030 (%)
Data Table on Egypt - Year-over-year growth 2025-2030 (%)

12.8 Market opportunity by geography

Market opportunity by geography ($ million)
Data Tables on Market opportunity by geography ($ million)

13. Drivers, Challenges, and Opportunity

13.1 Market drivers

Robust expansion of pharmaceutical and biotechnology industries
Accelerated growth in semiconductor and electronics sector
Expansion into novel high-technology applications

13.2 Market challenges

Escalating volatility in raw material pricing
Rise of automation and robotics in cleanroom environments
Increasing complexity and cost of regulatory compliance

13.3 Impact of drivers and challenges

Impact of drivers and challenges in 2025 and 2030

13.4 Market opportunities

Integration of industry 4.0 and smart technologies
Rising demand for application-specific customization
Emphasis on modularity and operational flexibility

14. Competitive Landscape

14.1 Overview

14.2

Overview on criticality of inputs and factors of differentiation

14.3 Landscape disruption

Overview on factors of disruption

14.4 Industry risks

Impact of key risks on business

15. Competitive Analysis

15.1 Companies profiled

Companies covered

15.2 Company ranking index

15.3 Market positioning of companies

Matrix on companies position and classification

15.4 AirClean Systems

AirClean Systems - Overview
AirClean Systems - Product / Service
AirClean Systems - Key offerings
SWOT

15.5 Azbil Telstar SL

Azbil Telstar SL - Overview
Azbil Telstar SL - Product / Service
Azbil Telstar SL - Key offerings
SWOT

15.6 Biobase Biodusty Shandong Co. Ltd.

Biobase Biodusty Shandong Co. Ltd. - Overview
Biobase Biodusty Shandong Co. Ltd. - Product / Service
Biobase Biodusty Shandong Co. Ltd. - Key offerings
SWOT

15.7 Clean Air Products

Clean Air Products - Overview
Clean Air Products - Product / Service
Clean Air Products - Key offerings
SWOT

15.8 Erlab DFS

Erlab DFS - Overview
Erlab DFS - Product / Service
Erlab DFS - Key offerings
SWOT

15.9 Esco Lifesciences

Esco Lifesciences - Overview
Esco Lifesciences - Product / Service
Esco Lifesciences - Key offerings
SWOT

15.10 Germfree Laboratories Inc.

Germfree Laboratories Inc. - Overview
Germfree Laboratories Inc. - Product / Service
Germfree Laboratories Inc. - Key offerings
SWOT

15.11 HEMCO Corp.

HEMCO Corp. - Overview
HEMCO Corp. - Product / Service
HEMCO Corp. - Key offerings
SWOT

15.12 Kewaunee Scientific Corp.

Kewaunee Scientific Corp. - Overview
Kewaunee Scientific Corp. - Business segments
Kewaunee Scientific Corp. - Key offerings
Kewaunee Scientific Corp. - Segment focus
SWOT

15.13 Nicomac Srl

Nicomac Srl - Overview
Nicomac Srl - Product / Service
Nicomac Srl - Key offerings
SWOT

15.14 Palbam AC Ltd.

Palbam AC Ltd. - Overview
Palbam AC Ltd. - Product / Service
Palbam AC Ltd. - Key offerings
SWOT

15.15 Sentry Air Systems Inc.

Sentry Air Systems Inc. - Overview
Sentry Air Systems Inc. - Product / Service
Sentry Air Systems Inc. - Key offerings
SWOT

15.16 Technical Air Products

Technical Air Products - Overview
Technical Air Products - Product / Service
Technical Air Products - Key offerings
SWOT

15.17 Terra Universal Inc.

Terra Universal Inc. - Overview
Terra Universal Inc. - Product / Service
Terra Universal Inc. - Key offerings
SWOT

15.18 Thermo Fisher Scientific Inc.

Thermo Fisher Scientific Inc. - Overview
Thermo Fisher Scientific Inc. - Business segments
Thermo Fisher Scientific Inc. - Key news
Thermo Fisher Scientific Inc. - Key offerings
Thermo Fisher Scientific Inc. - Segment focus
SWOT

16. Appendix

16.1 Scope of the report

Market definition
Objectives
Notes and caveats

16.2 Inclusions and exclusions checklist

Inclusions checklist
Exclusions checklist

16.3 Currency conversion rates for US$

16.4 Research methodology

16.5 Data procurement

Information sources

16.6 Data validation

16.7 Validation techniques employed for market sizing

16.8 Data synthesis

16.9 360 degree market analysis

16.10 List of abbreviations

Research Methodology

Technavio presents a detailed picture of the market by way of study, synthesis, and summation of data from multiple sources. The analysts have presented the various facets of the market with a particular focus on identifying the key industry influencers. The data thus presented is comprehensive, reliable, and the result of extensive research, both primary and secondary.

INFORMATION SOURCES

Primary sources

  • Manufacturers and suppliers
  • Channel partners
  • Industry experts
  • Strategic decision makers

Secondary sources

  • Industry journals and periodicals
  • Government data
  • Financial reports of key industry players
  • Historical data
  • Press releases

DATA ANALYSIS

Data Synthesis

  • Collation of data
  • Estimation of key figures
  • Analysis of derived insights

Data Validation

  • Triangulation with data models
  • Reference against proprietary databases
  • Corroboration with industry experts

REPORT WRITING

Qualitative

  • Market drivers
  • Market challenges
  • Market trends
  • Five forces analysis

Quantitative

  • Market size and forecast
  • Market segmentation
  • Geographical insights
  • Competitive landscape

Interested in this report?

Get your sample now to see our research methodology and insights!

Download Now

Frequently Asked Questions

Cleanroom Storage Cabinet market growth will increase by USD 707.9 million during 2026-2030.

The Cleanroom Storage Cabinet market is expected to grow at a CAGR of 10.6% during 2026-2030.

Cleanroom Storage Cabinet market is segmented by End-user (Medical, Semiconductor, Others) Type (Stainless steel, Plastic) Product (Tall cabinets, Wall-mounted cabinets, Pass-through cabinets, Under-counter cabinets, Mobile cabinets)

AirClean Systems, Azbil Telstar SL, Biobase Biodusty Shandong Co. Ltd., Clean Air Products, Cleatech LLC, Connect 2 Cleanrooms Ltd., Eagle Group, Erlab DFS, Esco Lifesciences, Germfree Laboratories Inc., HEMCO Corp., Integrated Cleanroom Technologies, Kewaunee Scientific Corp., Laminar Flow Inc., Nicomac Srl, Palbam AC Ltd., Sentry Air Systems Inc., Technical Air Products, Terra Universal Inc., Thermo Fisher Scientific Inc. are a few of the key vendors in the Cleanroom Storage Cabinet market.

APAC will register the highest growth rate of 42.5% among the other regions. Therefore, the Cleanroom Storage Cabinet market in APAC is expected to garner significant business opportunities for the vendors during the forecast period.

China, Japan, South Korea, India, Malaysia, Singapore, US, Canada, Mexico, Germany, UK, France, Italy, Spain, The Netherlands, Brazil, Argentina, Colombia, Saudi Arabia, UAE, South Africa, Turkey, Egypt

  • Robust expansion of pharmaceutical and biotechnology industries is the driving factor this market.

The Cleanroom Storage Cabinet market vendors should focus on grabbing business opportunities from the End-user segment as it accounted for the largest market share in the base year.
RIA - Research AI Assistant
Ask RIA