Cardiovascular Medical Devices Market Analysis, Size, and Forecast 2026-2030: North America (US, Canada, and Mexico), Europe (Germany, UK, and France), APAC (China, Japan, and India), South America (Brazil, Argentina, and Colombia), Middle East and Africa (Saudi Arabia, UAE, and Turkey), Asia, Rest of World (ROW)

Cardiovascular Medical Devices Market Analysis, Size, and Forecast 2026-2030:
North America (US, Canada, and Mexico), Europe (Germany, UK, and France), APAC (China, Japan, and India), South America (Brazil, Argentina, and Colombia), Middle East and Africa (Saudi Arabia, UAE, and Turkey), Asia, Rest of World (ROW)

Published: Apr 2026 308 Pages SKU: IRTNTR72063

Market Overview at a Glance

$24.31 B
Market Opportunity
7.9%
CAGR 2025 - 2030
42.5%
North America Growth
$27.52 B
Diagnostic systems segment 2024

Cardiovascular Medical Devices Market Size 2026-2030

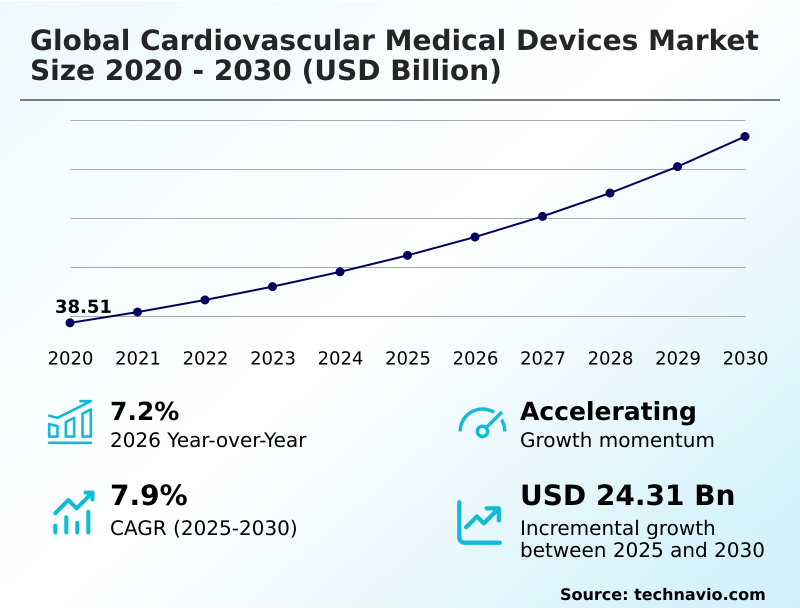
The cardiovascular medical devices market size is valued to increase by USD 24.31 billion, at a CAGR of 7.9% from 2025 to 2030. Increasing adoption of minimally invasive and transcatheter procedures will drive the cardiovascular medical devices market.

Major Market Trends & Insights

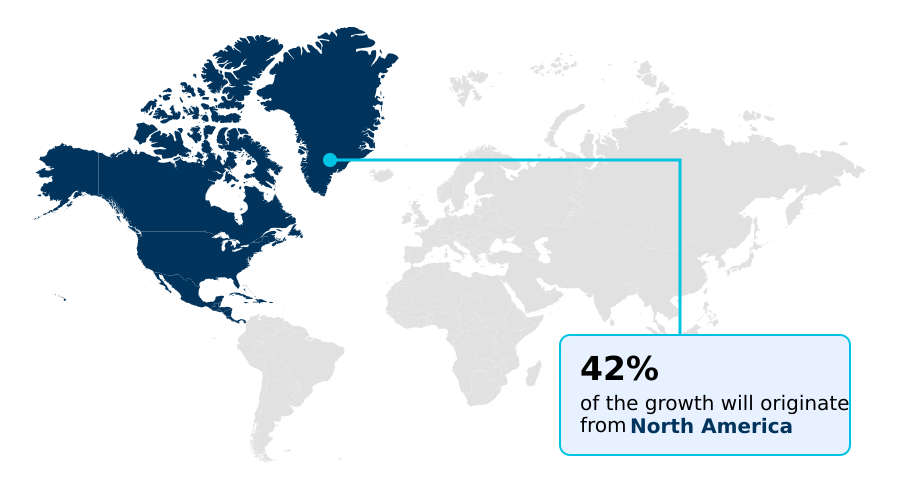
  • North America dominated the market and accounted for a 42.5% growth during the forecast period.
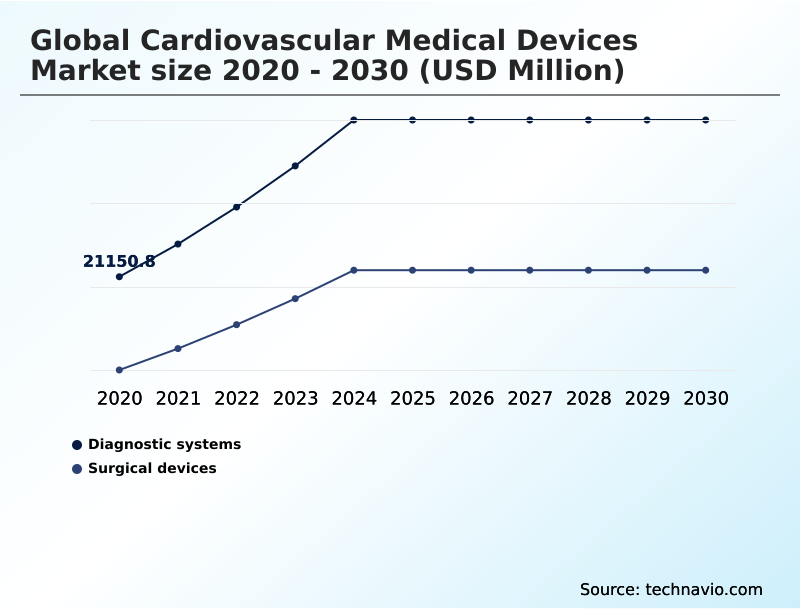
  • By Product - Diagnostic systems segment was valued at USD 27.52 billion in 2024
  • By Disease Type - Coronary artery disease segment accounted for the largest market revenue share in 2024

Market Size & Forecast

  • Market Opportunities: USD 38.11 billion
  • Market Future Opportunities: USD 24.31 billion
  • CAGR from 2025 to 2030 : 7.9%

Market Summary

  • The cardiovascular medical devices market is characterized by a dynamic interplay of demographic shifts and technological evolution. An aging global population and the rising prevalence of lifestyle-related diseases create a sustained demand for both diagnostic and therapeutic interventions. This drives innovation across key areas, including cardiac rhythm management and structural heart intervention.
  • A pivotal trend is the move towards minimally invasive cardiac surgery, utilizing advanced electrophysiology catheters and drug-eluting stents, which offer reduced recovery times and improved patient outcomes. This shift is supported by digital health integration, where remote patient monitoring platforms enable continuous oversight of chronic conditions.
  • For instance, a healthcare system implementing a value-based healthcare model might evaluate new pacemaker technology not just on device cost, but on its ability to reduce hospital readmissions, leveraging cardiac device data analytics to prove long-term economic and clinical value.
  • However, manufacturers face challenges from stringent regulatory pathways and the need to demonstrate clear cost-effectiveness, pushing the industry towards solutions that offer superior cardiac device biocompatibility and proven real-world performance.

What will be the Size of the Cardiovascular Medical Devices Market during the forecast period?

Get Key Insights on Market Forecast (PDF) Request Free Sample

How is the Cardiovascular Medical Devices Market Segmented?

The cardiovascular medical devices industry research report provides comprehensive data (region-wise segment analysis), with forecasts and estimates in "USD million" for the period 2026-2030, as well as historical data from 2020-2024 for the following segments.

  • Product
    • Diagnostic systems
    • Surgical devices
  • Disease type
    • Coronary artery disease
    • Arrhythmia
    • Heart failure
    • Structural heart disease
    • Others
  • End-user
    • Hospitals
    • ASCs
    • Specialty clinics
    • Home healthcare settings
    • Rehabilitation centers
  • Geography
    • North America
      • US
      • Canada
      • Mexico
    • Europe
      • Germany
      • UK
      • France
    • Asia
    • Rest of World (ROW)

By Product Insights

The diagnostic systems segment is estimated to witness significant growth during the forecast period.

The diagnostic systems segment is shifting toward proactive and decentralized care models. This evolution is propelled by a growing emphasis on preventive health and the need for early detection of cardiovascular conditions.

Innovations in cardiovascular diagnostic imaging and the integration of AI in cardiovascular diagnostics are enabling greater accuracy and portability, moving surveillance from clinical settings to remote environments.

The rise of remote patient monitoring through smart implantable sensors and wearable ECG monitors facilitates continuous data collection for managing chronic diseases.

This transition toward digital health integration is critical for healthcare providers, as systems incorporating predictive analytics in cardiology have improved early anomaly detection rates by over 20%, directly enhancing patient outcomes and operational efficiency within value-based healthcare models.

Request Free Sample

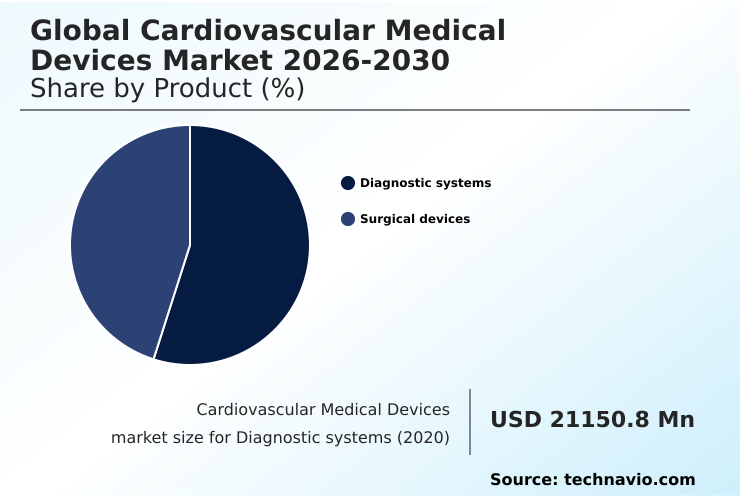
The Diagnostic systems segment was valued at USD 27.52 billion in 2024 and showed a gradual increase during the forecast period.

Request Free Sample

Regional Analysis

North America is estimated to contribute 42.5% to the growth of the global market during the forecast period.Technavio’s analysts have elaborately explained the regional trends and drivers that shape the market during the forecast period.

See How Cardiovascular Medical Devices Market Demand is Rising in North America Request Free Sample

The geographic landscape of the cardiovascular medical devices market is led by North America, which benefits from high healthcare spending, advanced infrastructure, and favorable reimbursement for innovative procedures like transcatheter aortic valve replacement.

Policy alignment in the region has accelerated the adoption of advanced technologies, contributing to a 15% reduction in average hospital stays for certain interventions. Europe remains a mature market focused on real-world evidence generation and cost-effectiveness.

Asia is the fastest-growing region, driven by expanding access to care and rising investment in healthcare infrastructure, with procedural volumes for percutaneous coronary intervention growing over 10% annually in major urban centers.

This growth supports the expanding use of advanced circulatory support systems and catheter navigation systems across the region.

Market Dynamics

Our researchers analyzed the data with 2025 as the base year, along with the key drivers, trends, and challenges. A holistic analysis of drivers will help companies refine their marketing strategies to gain a competitive advantage.

  • Clinical decision-making in cardiac care involves complex evaluations, such as the ongoing debate between transcatheter vs surgical valve replacement, where patient risk profiles and long-term durability are key considerations. Similarly, the choice between drug-eluting vs bare-metal stents is guided by factors like thrombosis risk and the need for dual antiplatelet therapy.
  • The growing emphasis on economic value is highlighted by assessments of the cost-effectiveness of leadless pacemakers, which offer benefits by eliminating lead-related complications. In procedural innovation, the use of AI algorithms for arrhythmia detection is becoming integral to electrophysiology.
  • Hospitals that pair these algorithms with remote monitoring for heart failure have reported a twofold increase in early intervention rates compared to facilities relying on traditional follow-ups, demonstrating a significant impact on operational planning.
  • This trend complements other advancements, including the application of robotic surgery for coronary bypass, which aims to enhance precision and reduce recovery times, further shaping the modern therapeutic landscape.

What are the key market drivers leading to the rise in the adoption of Cardiovascular Medical Devices Industry?

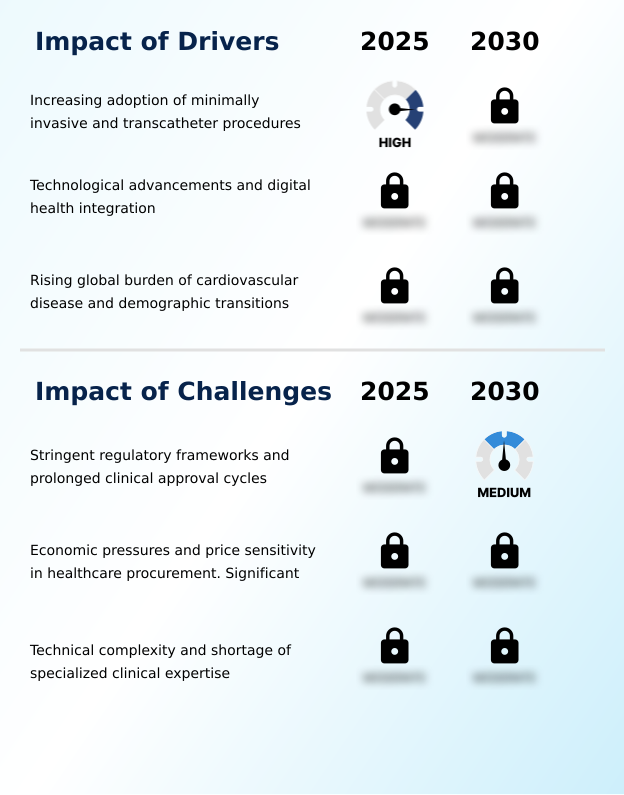
  • The increasing adoption of minimally invasive and transcatheter procedures serves as a key driver for market growth.

  • The primary driver for the market is the increasing adoption of minimally invasive techniques, such as transcatheter mitral valve repair and endovascular aneurysm repair, which offer significant benefits over traditional open surgery.
  • These procedures, leveraging innovations in robotic catheter systems and catheter ablation technologies, reduce patient trauma and shorten recovery times. For example, the use of robotic-assisted surgery for certain cardiac procedures has been linked to a 40% reduction in hospital stays.
  • Furthermore, technological advancements in cardiac mapping systems and electromechanical mapping enhance procedural precision, improving success rates for complex arrhythmia treatments.
  • The development of customized cardiovascular implants and 3D printed heart models for pre-surgical planning is also enabling more personalized and effective interventions, with some studies showing a 25% reduction in operative time.

What are the market trends shaping the Cardiovascular Medical Devices Industry?

  • A key market trend is the proliferation of value-based procurement strategies. These are increasingly tied to outcome-focused reimbursement models.

  • A significant trend reshaping the market is the strategic shift toward value-based healthcare models, compelling manufacturers to focus on real-world evidence generation. This transition prioritizes clinical outcomes over procedural volume, favoring technologies like bioresorbable vascular scaffolds and advanced hemodynamic monitoring systems that demonstrate long-term efficacy.
  • Hospitals are increasingly adopting cardiac contractility modulation and other advanced therapies that reduce readmissions, with some systems reporting an 18% decrease in 30-day returns for heart failure patients. This outcome-centric approach is also driving the expansion of minimally invasive procedures into ambulatory surgery centers, where patient-specific instrumentation and efficient workflows are paramount.
  • The focus on pediatric cardiac devices is also growing, demanding miniaturized and highly biocompatible solutions for congenital defects.

What challenges does the Cardiovascular Medical Devices Industry face during its growth?

  • Stringent regulatory frameworks, coupled with prolonged clinical approval cycles, present a key challenge to industry growth.

  • A major challenge confronting the market is the complex and stringent regulatory landscape, which can delay the commercialization of innovative devices. The transition to new regulatory frameworks has increased clinical data requirements by up to 50% for some device classes, impacting development timelines for technologies like next-generation heart valves and biodegradable cardiac patches.
  • Additionally, the technical complexity of devices such as ventricular assist devices and wireless cardiac stimulation systems necessitates specialized clinical expertise, which can be a limiting factor for adoption. Ensuring cardiac device cybersecurity for connected platforms, including wearable defibrillators and remote monitoring systems, adds another layer of complexity and cost, with security compliance audits increasing verification workloads by an estimated 30%.

Exclusive Technavio Analysis on Customer Landscape

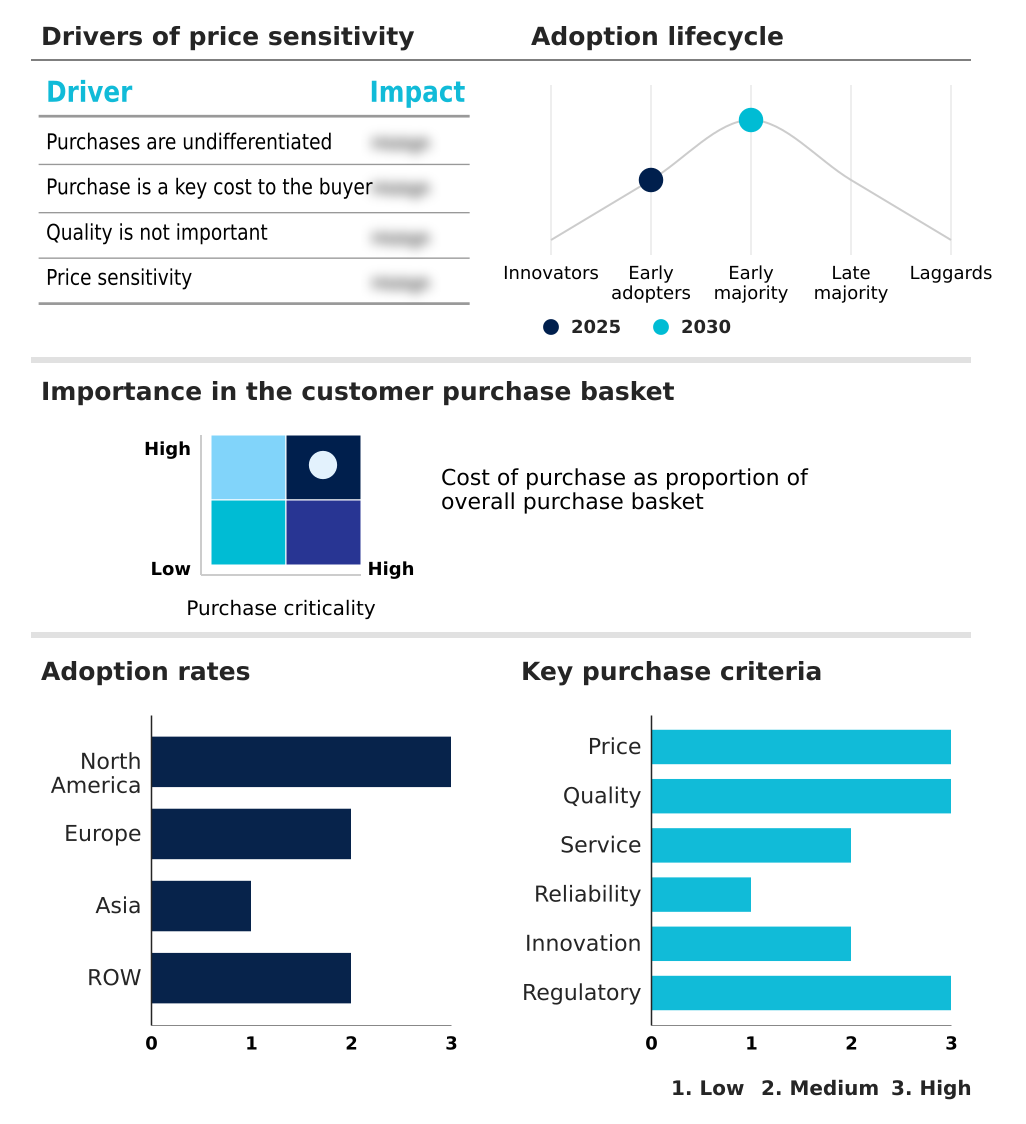
The cardiovascular medical devices market forecasting report includes the adoption lifecycle of the market, covering from the innovator’s stage to the laggard’s stage. It focuses on adoption rates in different regions based on penetration. Furthermore, the cardiovascular medical devices market report also includes key purchase criteria and drivers of price sensitivity to help companies evaluate and develop their market growth analysis strategies.

Customer Landscape of Cardiovascular Medical Devices Industry

Competitive Landscape

Companies are implementing various strategies, such as strategic alliances, cardiovascular medical devices market forecast, partnerships, mergers and acquisitions, geographical expansion, and product/service launches, to enhance their presence in the industry.

Argon Medical Devices Inc. - Key offerings encompass a broad portfolio of technologies for interventional cardiology, cardiac rhythm management, and structural heart therapies, addressing a wide spectrum of cardiovascular diseases.

The industry research and growth report includes detailed analyses of the competitive landscape of the market and information about key companies, including:

  • Argon Medical Devices Inc.
  • B.Braun SE
  • Boston Scientific Corp.
  • Canon Inc.
  • Cardinal Health Inc.
  • Cook Group Inc.
  • Edwards Lifesciences Corp.
  • Eurocor Tech GmbH
  • GE HealthCare Technologies
  • Getinge AB
  • Johnson and Johnson Services
  • Lepu Medical Co. Ltd.
  • LivaNova PLC
  • Medtronic Plc
  • Merit Medical Systems Inc.
  • Newtech Medical Devices
  • Siemens AG
  • Teleflex Inc.
  • Terumo Corp.
  • W. L. Gore and Associates

Qualitative and quantitative analysis of companies has been conducted to help clients understand the wider business environment as well as the strengths and weaknesses of key industry players. Data is qualitatively analyzed to categorize companies as pure play, category-focused, industry-focused, and diversified; it is quantitatively analyzed to categorize companies as dominant, leading, strong, tentative, and weak.

Recent Development and News in Cardiovascular medical devices market

  • In November 2024, Abbott Laboratories launched its latest-generation MitraClip device, the G5 system, featuring an enhanced design for more precise mitral valve repair in a wider range of patient anatomies.
  • In January 2025, Medtronic Plc announced it had received regulatory approval from the FDA for its next-generation leadless pacemaker system, setting a new benchmark for cardiac rhythm management technology.
  • In March 2025, Edwards Lifesciences Corp. announced CE Mark approval for its next-generation SAPIEN 4 transcatheter heart valve, featuring innovations designed to improve outcomes in aortic valve replacement procedures.
  • In April 2025, Johnson and Johnson Services Inc. announced the completion of the first clinical use cases for the OTTAVA robotic system, a platform designed to enhance capabilities in minimally invasive cardiac surgery.

Dive into Technavio’s robust research methodology, blending expert interviews, extensive data synthesis, and validated models for unparalleled Cardiovascular Medical Devices Market insights. See full methodology.

Market Scope
Page number 308
Base year 2025
Historic period 2020-2024
Forecast period 2026-2030
Growth momentum & CAGR Accelerate at a CAGR of 7.9%
Market growth 2026-2030 USD 24314.7 million
Market structure Fragmented
YoY growth 2025-2026(%) 7.2%
Key countries US, Canada, Mexico, Germany, UK, France, Italy, Spain, The Netherlands, China, Japan, India, South Korea, Thailand, Indonesia, Brazil, Saudi Arabia, UAE, Turkey, Argentina, Colombia, South Africa and Israel
Competitive landscape Leading Companies, Market Positioning of Companies, Competitive Strategies, and Industry Risks

Request Free Sample

Research Analyst Overview

  • The cardiovascular medical devices landscape is advancing rapidly beyond traditional coronary artery bypass grafting. The field of interventional cardiology now heavily relies on drug-eluting stents for percutaneous coronary intervention, with bioresorbable vascular scaffold technologies emerging. Cardiac rhythm management has evolved from standard pacemaker technology to sophisticated implantable cardioverter defibrillator systems, cardiac resynchronization therapy, and the leadless pacemaker.
  • Procedures like catheter ablation and atrial fibrillation ablation are guided by electrophysiology catheters and cardiac mapping systems. Structural heart intervention is increasingly common, featuring transcatheter aortic valve replacement and mitral valve repair. Intravascular imaging with optical coherence tomography and intravascular ultrasound, along with fractional flow reserve assessment, optimizes outcomes.
  • Innovations such as intravascular lithotripsy, left atrial appendage closure, and thrombectomy devices are gaining traction. For advanced heart failure, ventricular assist device support, cardiac contractility modulation, and extracorporeal membrane oxygenation are pivotal.
  • The integration of remote patient monitoring through wearable ECG monitors and the pulmonary artery pressure sensor is a strategic boardroom focus, as efficient use of vascular closure devices improves throughput by 15%.

What are the Key Data Covered in this Cardiovascular Medical Devices Market Research and Growth Report?

  • What is the expected growth of the Cardiovascular Medical Devices Market between 2026 and 2030?

    • USD 24.31 billion, at a CAGR of 7.9%

  • What segmentation does the market report cover?

    • The report is segmented by Product (Diagnostic systems, and Surgical devices), Disease Type (Coronary artery disease, Arrhythmia, Heart failure, Structural heart disease, and Others), End-user (Hospitals, ASCs, Specialty clinics, Home healthcare settings, and Rehabilitation centers) and Geography (North America, Europe, Asia, Rest of World (ROW))

  • Which regions are analyzed in the report?

    • North America, Europe, Asia and Rest of World (ROW)

  • What are the key growth drivers and market challenges?

    • Increasing adoption of minimally invasive and transcatheter procedures, Stringent regulatory frameworks and prolonged clinical approval cycles

  • Who are the major players in the Cardiovascular Medical Devices Market?

    • Argon Medical Devices Inc., B.Braun SE, Boston Scientific Corp., Canon Inc., Cardinal Health Inc., Cook Group Inc., Edwards Lifesciences Corp., Eurocor Tech GmbH, GE HealthCare Technologies, Getinge AB, Johnson and Johnson Services, Lepu Medical Co. Ltd., LivaNova PLC, Medtronic Plc, Merit Medical Systems Inc., Newtech Medical Devices, Siemens AG, Teleflex Inc., Terumo Corp. and W. L. Gore and Associates

Market Research Insights

  • The market's momentum is fueled by technological convergence, where digital health integration reshapes care delivery. The adoption of remote cardiac monitoring platforms has been shown to reduce hospital readmission rates for heart failure patients by up to 25%, a compelling factor for providers operating under value-based healthcare models.
  • Furthermore, the application of AI in cardiovascular diagnostics is delivering significant clinical gains; some algorithms have improved the accuracy of early arrhythmia detection by over 30% compared to conventional methods. This fusion of advanced hardware, such as next-generation heart valves, with sophisticated software is expanding treatment possibilities.
  • As procedures increasingly shift to ambulatory surgery centers, demand grows for devices that facilitate efficiency, while the proliferation of connected technologies heightens the focus on cardiac device cybersecurity to ensure patient safety and data integrity.

We can help! Our analysts can customize this cardiovascular medical devices market research report to meet your requirements.

Get in touch

1. Executive Summary

1.1 Market overview

Executive Summary - Chart on Market Overview
Executive Summary - Data Table on Market Overview
Executive Summary - Chart on Global Market Characteristics
Executive Summary - Chart on Market by Geography
Executive Summary - Chart on Market Segmentation by Product
Executive Summary - Chart on Market Segmentation by Disease Type
Executive Summary - Chart on Market Segmentation by End-user
Executive Summary - Chart on Incremental Growth
Executive Summary - Data Table on Incremental Growth
Executive Summary - Chart on Company Market Positioning

2. Technavio Analysis

2.1 Analysis of price sensitivity, lifecycle, customer purchase basket, adoption rates, and purchase criteria

2.2 Criticality of inputs and Factors of differentiation

Chart on Overview on criticality of inputs and factors of differentiation

2.3 Factors of disruption

Chart on Overview on factors of disruption

2.4 Impact of drivers and challenges

Chart on Impact of drivers and challenges in 2025 and 2030

3. Market Landscape

3.1 Market ecosystem

Chart on Parent Market
Data Table on - Parent Market

3.2 Market characteristics

Chart on Market characteristics analysis

3.3 Value chain analysis

Chart on Value chain analysis

4. Market Sizing

4.1 Market definition

Data Table on Offerings of companies included in the market definition

4.2 Market segment analysis

Market segments

4.3 Market size 2025

4.4 Market outlook: Forecast for 2025-2030

Chart on Global - Market size and forecast 2025-2030 ($ million)
Data Table on Global - Market size and forecast 2025-2030 ($ million)
Chart on Global Market: Year-over-year growth 2025-2030 (%)
Data Table on Global Market: Year-over-year growth 2025-2030 (%)

5. Historic Market Size

5.1 Global Cardiovascular Medical Devices Market 2020 - 2024

Historic Market Size - Data Table on Global Cardiovascular Medical Devices Market 2020 - 2024 ($ million)

5.2 Product segment analysis 2020 - 2024

Historic Market Size - Product Segment 2020 - 2024 ($ million)

5.3 Disease Type segment analysis 2020 - 2024

Historic Market Size - Disease Type Segment 2020 - 2024 ($ million)

5.4 End-user segment analysis 2020 - 2024

Historic Market Size - End-user Segment 2020 - 2024 ($ million)

5.5 Geography segment analysis 2020 - 2024

Historic Market Size - Geography Segment 2020 - 2024 ($ million)

5.6 Country segment analysis 2020 - 2024

Historic Market Size - Country Segment 2020 - 2024 ($ million)

6. Qualitative Analysis

6.1 Impact of AI on global cardiovascular medical devices market

6.2 Impact of geopolitical conflicts on global cardiovascular medical devices market

7. Five Forces Analysis

7.1 Five forces summary

Five forces analysis - Comparison between 2025 and 2030

7.2 Bargaining power of buyers

Bargaining power of buyers - Impact of key factors 2025 and 2030

7.3 Bargaining power of suppliers

Bargaining power of suppliers - Impact of key factors in 2025 and 2030

7.4 Threat of new entrants

Threat of new entrants - Impact of key factors in 2025 and 2030

7.5 Threat of substitutes

Threat of substitutes - Impact of key factors in 2025 and 2030

7.6 Threat of rivalry

Threat of rivalry - Impact of key factors in 2025 and 2030

7.7 Market condition

Chart on Market condition - Five forces 2025 and 2030

8. Market Segmentation by Product

8.1 Market segments

Chart on Product - Market share 2025-2030 (%)
Data Table on Product - Market share 2025-2030 (%)

8.2 Comparison by Product

Chart on Comparison by Product
Data Table on Comparison by Product

8.3 Diagnostic systems - Market size and forecast 2025-2030

Chart on Diagnostic systems - Market size and forecast 2025-2030 ($ million)
Data Table on Diagnostic systems - Market size and forecast 2025-2030 ($ million)
Chart on Diagnostic systems - Year-over-year growth 2025-2030 (%)
Data Table on Diagnostic systems - Year-over-year growth 2025-2030 (%)

8.4 Surgical devices - Market size and forecast 2025-2030

Chart on Surgical devices - Market size and forecast 2025-2030 ($ million)
Data Table on Surgical devices - Market size and forecast 2025-2030 ($ million)
Chart on Surgical devices - Year-over-year growth 2025-2030 (%)
Data Table on Surgical devices - Year-over-year growth 2025-2030 (%)

8.5 Market opportunity by Product

Market opportunity by Product ($ million)
Data Table on Market opportunity by Product ($ million)

9. Market Segmentation by Disease Type

9.1 Market segments

Chart on Disease Type - Market share 2025-2030 (%)
Data Table on Disease Type - Market share 2025-2030 (%)

9.2 Comparison by Disease Type

Chart on Comparison by Disease Type
Data Table on Comparison by Disease Type

9.3 Coronary artery disease - Market size and forecast 2025-2030

Chart on Coronary artery disease - Market size and forecast 2025-2030 ($ million)
Data Table on Coronary artery disease - Market size and forecast 2025-2030 ($ million)
Chart on Coronary artery disease - Year-over-year growth 2025-2030 (%)
Data Table on Coronary artery disease - Year-over-year growth 2025-2030 (%)

9.4 Arrhythmia - Market size and forecast 2025-2030

Chart on Arrhythmia - Market size and forecast 2025-2030 ($ million)
Data Table on Arrhythmia - Market size and forecast 2025-2030 ($ million)
Chart on Arrhythmia - Year-over-year growth 2025-2030 (%)
Data Table on Arrhythmia - Year-over-year growth 2025-2030 (%)

9.5 Heart failure - Market size and forecast 2025-2030

Chart on Heart failure - Market size and forecast 2025-2030 ($ million)
Data Table on Heart failure - Market size and forecast 2025-2030 ($ million)
Chart on Heart failure - Year-over-year growth 2025-2030 (%)
Data Table on Heart failure - Year-over-year growth 2025-2030 (%)

9.6 Structural heart disease - Market size and forecast 2025-2030

Chart on Structural heart disease - Market size and forecast 2025-2030 ($ million)
Data Table on Structural heart disease - Market size and forecast 2025-2030 ($ million)
Chart on Structural heart disease - Year-over-year growth 2025-2030 (%)
Data Table on Structural heart disease - Year-over-year growth 2025-2030 (%)

9.7 Others - Market size and forecast 2025-2030

Chart on Others - Market size and forecast 2025-2030 ($ million)
Data Table on Others - Market size and forecast 2025-2030 ($ million)
Chart on Others - Year-over-year growth 2025-2030 (%)
Data Table on Others - Year-over-year growth 2025-2030 (%)

9.8 Market opportunity by Disease Type

Market opportunity by Disease Type ($ million)
Data Table on Market opportunity by Disease Type ($ million)

10. Market Segmentation by End-user

10.1 Market segments

Chart on End-user - Market share 2025-2030 (%)
Data Table on End-user - Market share 2025-2030 (%)

10.2 Comparison by End-user

Chart on Comparison by End-user
Data Table on Comparison by End-user

10.3 Hospitals - Market size and forecast 2025-2030

Chart on Hospitals - Market size and forecast 2025-2030 ($ million)
Data Table on Hospitals - Market size and forecast 2025-2030 ($ million)
Chart on Hospitals - Year-over-year growth 2025-2030 (%)
Data Table on Hospitals - Year-over-year growth 2025-2030 (%)

10.4 ASCs - Market size and forecast 2025-2030

Chart on ASCs - Market size and forecast 2025-2030 ($ million)
Data Table on ASCs - Market size and forecast 2025-2030 ($ million)
Chart on ASCs - Year-over-year growth 2025-2030 (%)
Data Table on ASCs - Year-over-year growth 2025-2030 (%)

10.5 Specialty clinics - Market size and forecast 2025-2030

Chart on Specialty clinics - Market size and forecast 2025-2030 ($ million)
Data Table on Specialty clinics - Market size and forecast 2025-2030 ($ million)
Chart on Specialty clinics - Year-over-year growth 2025-2030 (%)
Data Table on Specialty clinics - Year-over-year growth 2025-2030 (%)

10.6 Home healthcare settings - Market size and forecast 2025-2030

Chart on Home healthcare settings - Market size and forecast 2025-2030 ($ million)
Data Table on Home healthcare settings - Market size and forecast 2025-2030 ($ million)
Chart on Home healthcare settings - Year-over-year growth 2025-2030 (%)
Data Table on Home healthcare settings - Year-over-year growth 2025-2030 (%)

10.7 Rehabilitation centers - Market size and forecast 2025-2030

Chart on Rehabilitation centers - Market size and forecast 2025-2030 ($ million)
Data Table on Rehabilitation centers - Market size and forecast 2025-2030 ($ million)
Chart on Rehabilitation centers - Year-over-year growth 2025-2030 (%)
Data Table on Rehabilitation centers - Year-over-year growth 2025-2030 (%)

10.8 Market opportunity by End-user

Market opportunity by End-user ($ million)
Data Table on Market opportunity by End-user ($ million)

11. Customer Landscape

11.1 Customer landscape overview

Analysis of price sensitivity, lifecycle, customer purchase basket, adoption rates, and purchase criteria

12. Geographic Landscape

12.1 Geographic segmentation

Chart on Market share by geography 2025-2030 (%)
Data Table on Market share by geography 2025-2030 (%)

12.2 Geographic comparison

Chart on Geographic comparison
Data Table on Geographic comparison

12.3 North America - Market size and forecast 2025-2030

Chart on North America - Market size and forecast 2025-2030 ($ million)
Data Table on North America - Market size and forecast 2025-2030 ($ million)
Chart on North America - Year-over-year growth 2025-2030 (%)
Data Table on North America - Year-over-year growth 2025-2030 (%)
Chart on Regional Comparison - North America
Data Table on Regional Comparison - North America

12.3.1 US - Market size and forecast 2025-2030

Chart on US - Market size and forecast 2025-2030 ($ million)
Data Table on US - Market size and forecast 2025-2030 ($ million)
Chart on US - Year-over-year growth 2025-2030 (%)
Data Table on US - Year-over-year growth 2025-2030 (%)

12.3.2 Canada - Market size and forecast 2025-2030

Chart on Canada - Market size and forecast 2025-2030 ($ million)
Data Table on Canada - Market size and forecast 2025-2030 ($ million)
Chart on Canada - Year-over-year growth 2025-2030 (%)
Data Table on Canada - Year-over-year growth 2025-2030 (%)

12.3.3 Mexico - Market size and forecast 2025-2030

Chart on Mexico - Market size and forecast 2025-2030 ($ million)
Data Table on Mexico - Market size and forecast 2025-2030 ($ million)
Chart on Mexico - Year-over-year growth 2025-2030 (%)
Data Table on Mexico - Year-over-year growth 2025-2030 (%)

12.4 Europe - Market size and forecast 2025-2030

Chart on Europe - Market size and forecast 2025-2030 ($ million)
Data Table on Europe - Market size and forecast 2025-2030 ($ million)
Chart on Europe - Year-over-year growth 2025-2030 (%)
Data Table on Europe - Year-over-year growth 2025-2030 (%)
Chart on Regional Comparison - Europe
Data Table on Regional Comparison - Europe

12.4.1 Germany - Market size and forecast 2025-2030

Chart on Germany - Market size and forecast 2025-2030 ($ million)
Data Table on Germany - Market size and forecast 2025-2030 ($ million)
Chart on Germany - Year-over-year growth 2025-2030 (%)
Data Table on Germany - Year-over-year growth 2025-2030 (%)

12.4.2 UK - Market size and forecast 2025-2030

Chart on UK - Market size and forecast 2025-2030 ($ million)
Data Table on UK - Market size and forecast 2025-2030 ($ million)
Chart on UK - Year-over-year growth 2025-2030 (%)
Data Table on UK - Year-over-year growth 2025-2030 (%)

12.4.3 France - Market size and forecast 2025-2030

Chart on France - Market size and forecast 2025-2030 ($ million)
Data Table on France - Market size and forecast 2025-2030 ($ million)
Chart on France - Year-over-year growth 2025-2030 (%)
Data Table on France - Year-over-year growth 2025-2030 (%)

12.4.4 Italy - Market size and forecast 2025-2030

Chart on Italy - Market size and forecast 2025-2030 ($ million)
Data Table on Italy - Market size and forecast 2025-2030 ($ million)
Chart on Italy - Year-over-year growth 2025-2030 (%)
Data Table on Italy - Year-over-year growth 2025-2030 (%)

12.4.5 Spain - Market size and forecast 2025-2030

Chart on Spain - Market size and forecast 2025-2030 ($ million)
Data Table on Spain - Market size and forecast 2025-2030 ($ million)
Chart on Spain - Year-over-year growth 2025-2030 (%)
Data Table on Spain - Year-over-year growth 2025-2030 (%)

12.4.6 The Netherlands - Market size and forecast 2025-2030

Chart on The Netherlands - Market size and forecast 2025-2030 ($ million)
Data Table on The Netherlands - Market size and forecast 2025-2030 ($ million)
Chart on The Netherlands - Year-over-year growth 2025-2030 (%)
Data Table on The Netherlands - Year-over-year growth 2025-2030 (%)

12.5 Asia - Market size and forecast 2025-2030

Chart on Asia - Market size and forecast 2025-2030 ($ million)
Data Table on Asia - Market size and forecast 2025-2030 ($ million)
Chart on Asia - Year-over-year growth 2025-2030 (%)
Data Table on Asia - Year-over-year growth 2025-2030 (%)
Chart on Regional Comparison - Asia
Data Table on Regional Comparison - Asia

12.5.1 China - Market size and forecast 2025-2030

Chart on China - Market size and forecast 2025-2030 ($ million)
Data Table on China - Market size and forecast 2025-2030 ($ million)
Chart on China - Year-over-year growth 2025-2030 (%)
Data Table on China - Year-over-year growth 2025-2030 (%)

12.5.2 Japan - Market size and forecast 2025-2030

Chart on Japan - Market size and forecast 2025-2030 ($ million)
Data Table on Japan - Market size and forecast 2025-2030 ($ million)
Chart on Japan - Year-over-year growth 2025-2030 (%)
Data Table on Japan - Year-over-year growth 2025-2030 (%)

12.5.3 India - Market size and forecast 2025-2030

Chart on India - Market size and forecast 2025-2030 ($ million)
Data Table on India - Market size and forecast 2025-2030 ($ million)
Chart on India - Year-over-year growth 2025-2030 (%)
Data Table on India - Year-over-year growth 2025-2030 (%)

12.5.4 South Korea - Market size and forecast 2025-2030

Chart on South Korea - Market size and forecast 2025-2030 ($ million)
Data Table on South Korea - Market size and forecast 2025-2030 ($ million)
Chart on South Korea - Year-over-year growth 2025-2030 (%)
Data Table on South Korea - Year-over-year growth 2025-2030 (%)

12.5.5 Thailand - Market size and forecast 2025-2030

Chart on Thailand - Market size and forecast 2025-2030 ($ million)
Data Table on Thailand - Market size and forecast 2025-2030 ($ million)
Chart on Thailand - Year-over-year growth 2025-2030 (%)
Data Table on Thailand - Year-over-year growth 2025-2030 (%)

12.5.6 Indonesia - Market size and forecast 2025-2030

Chart on Indonesia - Market size and forecast 2025-2030 ($ million)
Data Table on Indonesia - Market size and forecast 2025-2030 ($ million)
Chart on Indonesia - Year-over-year growth 2025-2030 (%)
Data Table on Indonesia - Year-over-year growth 2025-2030 (%)

12.6 Rest of World (ROW) - Market size and forecast 2025-2030

Chart on Rest of World (ROW) - Market size and forecast 2025-2030 ($ million)
Data Table on Rest of World (ROW) - Market size and forecast 2025-2030 ($ million)
Chart on Rest of World (ROW) - Year-over-year growth 2025-2030 (%)
Data Table on Rest of World (ROW) - Year-over-year growth 2025-2030 (%)
Chart on Regional Comparison - Rest of World (ROW)
Data Table on Regional Comparison - Rest of World (ROW)

12.6.1 Brazil - Market size and forecast 2025-2030

Chart on Brazil - Market size and forecast 2025-2030 ($ million)
Data Table on Brazil - Market size and forecast 2025-2030 ($ million)
Chart on Brazil - Year-over-year growth 2025-2030 (%)
Data Table on Brazil - Year-over-year growth 2025-2030 (%)

12.6.2 Saudi Arabia - Market size and forecast 2025-2030

Chart on Saudi Arabia - Market size and forecast 2025-2030 ($ million)
Data Table on Saudi Arabia - Market size and forecast 2025-2030 ($ million)
Chart on Saudi Arabia - Year-over-year growth 2025-2030 (%)
Data Table on Saudi Arabia - Year-over-year growth 2025-2030 (%)

12.6.3 UAE - Market size and forecast 2025-2030

Chart on UAE - Market size and forecast 2025-2030 ($ million)
Data Table on UAE - Market size and forecast 2025-2030 ($ million)
Chart on UAE - Year-over-year growth 2025-2030 (%)
Data Table on UAE - Year-over-year growth 2025-2030 (%)

12.6.4 Turkey - Market size and forecast 2025-2030

Chart on Turkey - Market size and forecast 2025-2030 ($ million)
Data Table on Turkey - Market size and forecast 2025-2030 ($ million)
Chart on Turkey - Year-over-year growth 2025-2030 (%)
Data Table on Turkey - Year-over-year growth 2025-2030 (%)

12.6.5 Argentina - Market size and forecast 2025-2030

Chart on Argentina - Market size and forecast 2025-2030 ($ million)
Data Table on Argentina - Market size and forecast 2025-2030 ($ million)
Chart on Argentina - Year-over-year growth 2025-2030 (%)
Data Table on Argentina - Year-over-year growth 2025-2030 (%)

12.6.6 Colombia - Market size and forecast 2025-2030

Chart on Colombia - Market size and forecast 2025-2030 ($ million)
Data Table on Colombia - Market size and forecast 2025-2030 ($ million)
Chart on Colombia - Year-over-year growth 2025-2030 (%)
Data Table on Colombia - Year-over-year growth 2025-2030 (%)

12.6.7 South Africa - Market size and forecast 2025-2030

Chart on South Africa - Market size and forecast 2025-2030 ($ million)
Data Table on South Africa - Market size and forecast 2025-2030 ($ million)
Chart on South Africa - Year-over-year growth 2025-2030 (%)
Data Table on South Africa - Year-over-year growth 2025-2030 (%)

12.6.8 Israel - Market size and forecast 2025-2030

Chart on Israel - Market size and forecast 2025-2030 ($ million)
Data Table on Israel - Market size and forecast 2025-2030 ($ million)
Chart on Israel - Year-over-year growth 2025-2030 (%)
Data Table on Israel - Year-over-year growth 2025-2030 (%)

12.7 Market opportunity by geography

Market opportunity by geography ($ million)
Data Tables on Market opportunity by geography ($ million)

13. Drivers, Challenges, and Opportunity

13.1 Market drivers

Increasing adoption of minimally invasive and transcatheter procedures
Technological advancements and digital health integration
Rising global burden of cardiovascular disease and demographic transitions

13.2 Market challenges

Stringent regulatory frameworks and prolonged clinical approval cycles
Economic pressures and price sensitivity in healthcare procurement. Significant
Technical complexity and shortage of specialized clinical expertise

13.3 Impact of drivers and challenges

Impact of drivers and challenges in 2025 and 2030

13.4 Market opportunities

Proliferation of value based procurement and outcome focused reimbursement models
Advancements in bioresorbable materials and next generation biocompatible coatings
Strategic expansion into specialized ambulatory surgery centers and outpatient settings

14. Competitive Landscape

14.1 Overview

14.2

Overview on criticality of inputs and factors of differentiation

14.3 Landscape disruption

Overview on factors of disruption

14.4 Industry risks

Impact of key risks on business

15. Competitive Analysis

15.1 Companies profiled

Companies covered

15.2 Company ranking index

15.3 Market positioning of companies

Matrix on companies position and classification

15.4 Argon Medical Devices Inc.

Argon Medical Devices Inc. - Overview
Argon Medical Devices Inc. - Product / Service
Argon Medical Devices Inc. - Key offerings
SWOT

15.5 B.Braun SE

B.Braun SE - Overview
B.Braun SE - Product / Service
B.Braun SE - Key offerings
SWOT

15.6 Boston Scientific Corp.

Boston Scientific Corp. - Overview
Boston Scientific Corp. - Business segments
Boston Scientific Corp. - Key news
Boston Scientific Corp. - Key offerings
Boston Scientific Corp. - Segment focus
SWOT

15.7 Canon Inc.

Canon Inc. - Overview
Canon Inc. - Business segments
Canon Inc. - Key offerings
Canon Inc. - Segment focus
SWOT

15.8 Cardinal Health Inc.

Cardinal Health Inc. - Overview
Cardinal Health Inc. - Business segments
Cardinal Health Inc. - Key offerings
Cardinal Health Inc. - Segment focus
SWOT

15.9 Cook Group Inc.

Cook Group Inc. - Overview
Cook Group Inc. - Product / Service
Cook Group Inc. - Key offerings
SWOT

15.10 Edwards Lifesciences Corp.

Edwards Lifesciences Corp. - Overview
Edwards Lifesciences Corp. - Business segments
Edwards Lifesciences Corp. - Key offerings
Edwards Lifesciences Corp. - Segment focus
SWOT

15.11 GE HealthCare Technologies

GE HealthCare Technologies - Overview
GE HealthCare Technologies - Business segments
GE HealthCare Technologies - Key news
GE HealthCare Technologies - Key offerings
GE HealthCare Technologies - Segment focus
SWOT

15.12 Getinge AB

Getinge AB - Overview
Getinge AB - Business segments
Getinge AB - Key offerings
Getinge AB - Segment focus
SWOT

15.13 Johnson and Johnson Services

Johnson and Johnson Services - Overview
Johnson and Johnson Services - Business segments
Johnson and Johnson Services - Key news
Johnson and Johnson Services - Key offerings
Johnson and Johnson Services - Segment focus
SWOT

15.14 Medtronic Plc

Medtronic Plc - Overview
Medtronic Plc - Business segments
Medtronic Plc - Key news
Medtronic Plc - Key offerings
Medtronic Plc - Segment focus
SWOT

15.15 Siemens AG

Siemens AG - Overview
Siemens AG - Business segments
Siemens AG - Key news
Siemens AG - Key offerings
Siemens AG - Segment focus
SWOT

15.16 Teleflex Inc.

Teleflex Inc. - Overview
Teleflex Inc. - Business segments
Teleflex Inc. - Key news
Teleflex Inc. - Key offerings
Teleflex Inc. - Segment focus
SWOT

15.17 Terumo Corp.

Terumo Corp. - Overview
Terumo Corp. - Business segments
Terumo Corp. - Key news
Terumo Corp. - Key offerings
Terumo Corp. - Segment focus
SWOT

15.18 W. L. Gore and Associates

W. L. Gore and Associates - Overview
W. L. Gore and Associates - Product / Service
W. L. Gore and Associates - Key offerings
SWOT

16. Appendix

16.1 Scope of the report

Market definition
Objectives
Notes and caveats

16.2 Inclusions and exclusions checklist

Inclusions checklist
Exclusions checklist

16.3 Currency conversion rates for US$

16.4 Research methodology

16.5 Data procurement

Information sources

16.6 Data validation

16.7 Validation techniques employed for market sizing

16.8 Data synthesis

16.9 360 degree market analysis

16.10 List of abbreviations

Research Methodology

Technavio presents a detailed picture of the market by way of study, synthesis, and summation of data from multiple sources. The analysts have presented the various facets of the market with a particular focus on identifying the key industry influencers. The data thus presented is comprehensive, reliable, and the result of extensive research, both primary and secondary.

INFORMATION SOURCES

Primary sources

  • Manufacturers and suppliers
  • Channel partners
  • Industry experts
  • Strategic decision makers

Secondary sources

  • Industry journals and periodicals
  • Government data
  • Financial reports of key industry players
  • Historical data
  • Press releases

DATA ANALYSIS

Data Synthesis

  • Collation of data
  • Estimation of key figures
  • Analysis of derived insights

Data Validation

  • Triangulation with data models
  • Reference against proprietary databases
  • Corroboration with industry experts

REPORT WRITING

Qualitative

  • Market drivers
  • Market challenges
  • Market trends
  • Five forces analysis

Quantitative

  • Market size and forecast
  • Market segmentation
  • Geographical insights
  • Competitive landscape

Interested in this report?

Get your sample now to see our research methodology and insights!

Download Now

Frequently Asked Questions

Cardiovascular Medical Devices market growth will increase by USD 24314.7 million during 2026-2030.

The Cardiovascular Medical Devices market is expected to grow at a CAGR of 7.9% during 2026-2030.

Cardiovascular Medical Devices market is segmented by Product (Diagnostic systems, Surgical devices) Disease type (Coronary artery disease, Arrhythmia, Heart failure, Structural heart disease, Others) End-user (Hospitals, ASCs, Specialty clinics, Home healthcare settings, Rehabilitation centers)

Argon Medical Devices Inc., B.Braun SE, Boston Scientific Corp., Canon Inc., Cardinal Health Inc., Cook Group Inc., Edwards Lifesciences Corp., Eurocor Tech GmbH, GE HealthCare Technologies, Getinge AB, Johnson and Johnson Services, Lepu Medical Co. Ltd., LivaNova PLC, Medtronic Plc, Merit Medical Systems Inc., Newtech Medical Devices, Siemens AG, Teleflex Inc., Terumo Corp., W. L. Gore and Associates are a few of the key vendors in the Cardiovascular Medical Devices market.

North America will register the highest growth rate of 42.5% among the other regions. Therefore, the Cardiovascular Medical Devices market in North America is expected to garner significant business opportunities for the vendors during the forecast period.

US, Canada, Mexico, Germany, UK, France, Italy, Spain, The Netherlands, China, Japan, India, South Korea, Thailand, Indonesia, Brazil, Saudi Arabia, UAE, Turkey, Argentina, Colombia, South Africa, Israel

  • Increasing adoption of minimally invasive and transcatheter procedures is the driving factor this market.

The Cardiovascular Medical Devices market vendors should focus on grabbing business opportunities from the Product segment as it accounted for the largest market share in the base year.
RIA - Research AI Assistant
Ask RIA