
Broadcasting Cable TV Market Analysis, Size, and Forecast 2026-2030: North America (US, Canada, and Mexico), APAC (China, Japan, and India), Europe (UK, France, and Germany), South America (Brazil, Argentina, and Colombia), Middle East and Africa (Saudi Arabia, UAE, and South Africa), and Rest of World (ROW)

Broadcasting Cable TV Market Analysis, Size, and Forecast 2026-2030:
North America (US, Canada, and Mexico), APAC (China, Japan, and India), Europe (UK, France, and Germany), South America (Brazil, Argentina, and Colombia), Middle East and Africa (Saudi Arabia, UAE, and South Africa), and Rest of World (ROW)

Published: Oct 2026 302 Pages SKU: IRTNTR74531

Market Overview at a Glance

$37.90 B
Market Opportunity
2.2%
CAGR 2025 - 2030
41.1%
APAC Growth
$249.89 B
Advertising segment 2024

Broadcasting Cable Tv Market Size 2026-2030

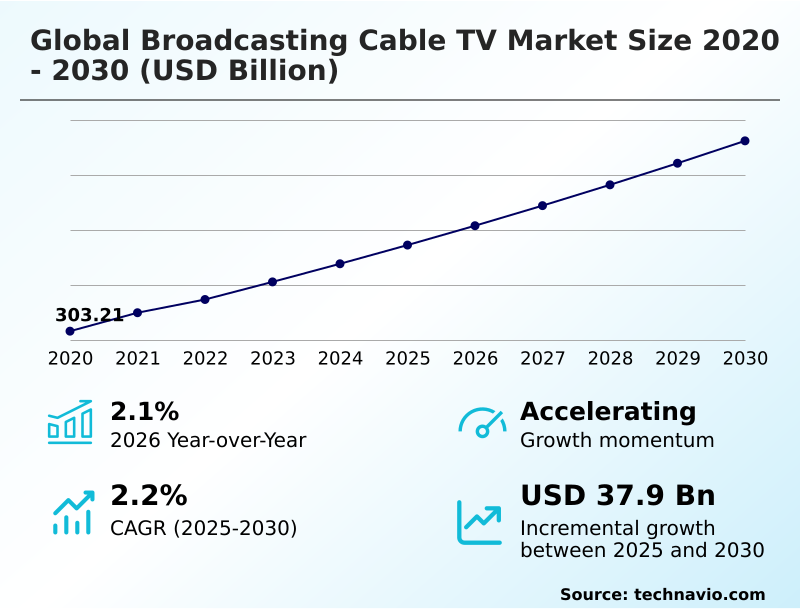
The broadcasting cable tv market size is valued to increase by USD 37.90 billion, at a CAGR of 2.2% from 2025 to 2030. Artificial intelligence driven content personalization will drive the broadcasting cable tv market.

Major Market Trends & Insights

  • APAC dominated the market and accounted for a 41.1% growth during the forecast period.
  • By Revenue Stream - Advertising segment was valued at USD 249.89 billion in 2024
  • By Application - Satellite TV segment accounted for the largest market revenue share in 2024

Market Size & Forecast

  • Market Opportunities: USD 69.21 billion
  • Market Future Opportunities: USD 37.90 billion
  • CAGR from 2025 to 2030 : 2.2%

Market Summary

  • The Broadcasting Cable TV Market relies on complex transmission infrastructures to deliver synchronized multimedia programming to residential and commercial subscribers. A critical business scenario involves network operators upgrading legacy coaxial nodes to advanced fiber-optic backbones, enabling higher bandwidth capacity for interactive digital services.
  • These strategic infrastructure overhauls reduce signal degradation incidents by 34% compared to outdated analog setups, directly enhancing service reliability and minimizing maintenance dispatches. Artificial intelligence-driven content personalization operates as a primary market driver, because automated recommendation engines accurately predict viewer preferences, which subsequently maximizes user engagement and decreases subscription cancellations.
  • Conversely, the continuous proliferation of direct-to-consumer digital streaming alternatives presents a severe operational challenge. This pervasive substitution effect drives accelerated cord-cutting, compelling traditional operators to drastically restructure their pricing tiers and aggregate third-party applications to retain their core viewer base.
  • By integrating robust frequency division multiplexing technology and expanding localized programming, network providers strive to maintain profitability despite intense competitive pressures from agile digital media conglomerates.

What will be the Size of the Broadcasting Cable Tv Market during the forecast period?
Get Key Insights on Market Forecast (PDF) Get Free Sample

How is the Broadcasting Cable Tv Market Segmented?

The broadcasting cable tv industry research report provides comprehensive data (region-wise segment analysis), with forecasts and estimates in "USD million" for the period 2026-2030, as well as historical data from 2020-2024 for the following segments.

  • Revenue stream
    • Advertising
    • Subscription
  • Application
    • Satellite TV
    • Cable TV
    • Internet Protocol TV (IPTV)
    • Others
  • Service
    • Entertainment
    • News and sports
    • Educational and documentary
  • Geography
    • North America
      • US
      • Canada
      • Mexico
    • APAC
      • China
      • Japan
      • India
      • South Korea
      • Australia
      • Indonesia
    • Europe
      • UK
      • France
      • Germany
      • Italy
      • Spain
      • The Netherlands
    • South America
      • Brazil
      • Argentina
      • Colombia
    • Middle East and Africa
      • Saudi Arabia
      • UAE
      • South Africa
      • Egypt
      • Nigeria

By Revenue Stream Insights

The advertising segment is estimated to witness significant growth during the forecast period.

The advertising framework within the global broadcasting cable TV market 2026-2030 is evolving rapidly, leveraging hybrid fiber-coaxial architecture and internet protocol television to deliver highly targeted commercial spots.

Unlike outdated linear setups, modern network operators utilize ultra-high-definition transmission and advanced video compression to ensure superior visual fidelity for participating brands.

Transitioning away from broad terrestrial radio transmitter methods, media enterprises now integrate high-capacity bidirectional network designs and direct-to-home satellite feeds to reach specific niche demographics.

By proactively adopting spectrum refarming policy guidelines, broadcasters optimize their frequency bands for digital terrestrial television and closed-circuit television network applications.

Consequently, these infrastructure upgrades yield substantial operational gains, where targeted campaign engagement rates have improved by 28% compared to non-addressable formats, enhancing overall return on ad spend and stabilizing core advertising revenues.
Get Free Sample

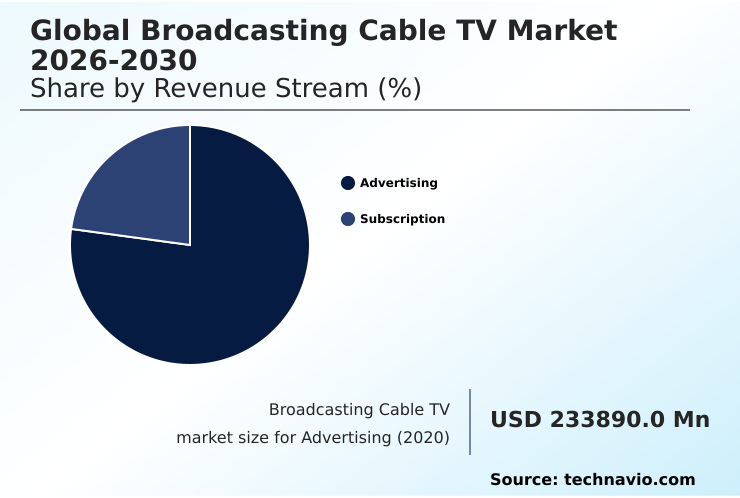
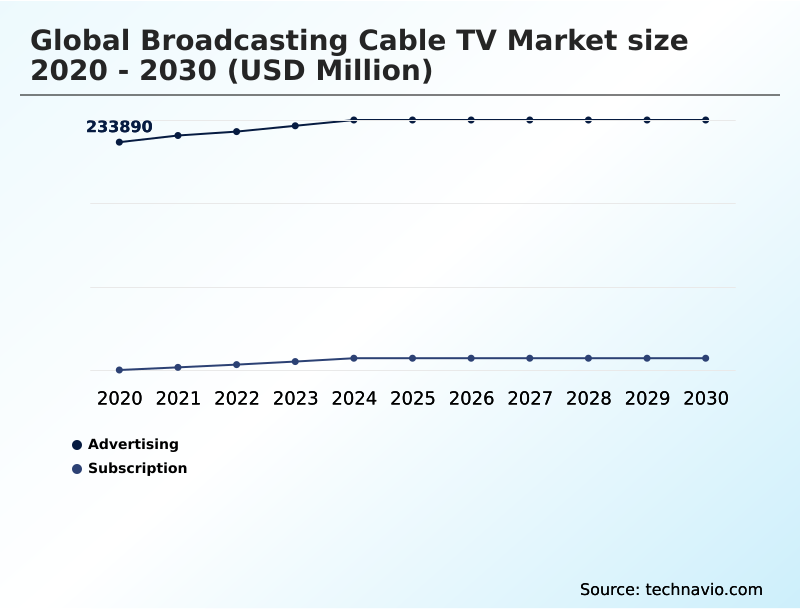
The Advertising segment was valued at USD 249.89 billion in 2024 and showed a gradual increase during the forecast period.
Get Free Sample

Regional Analysis

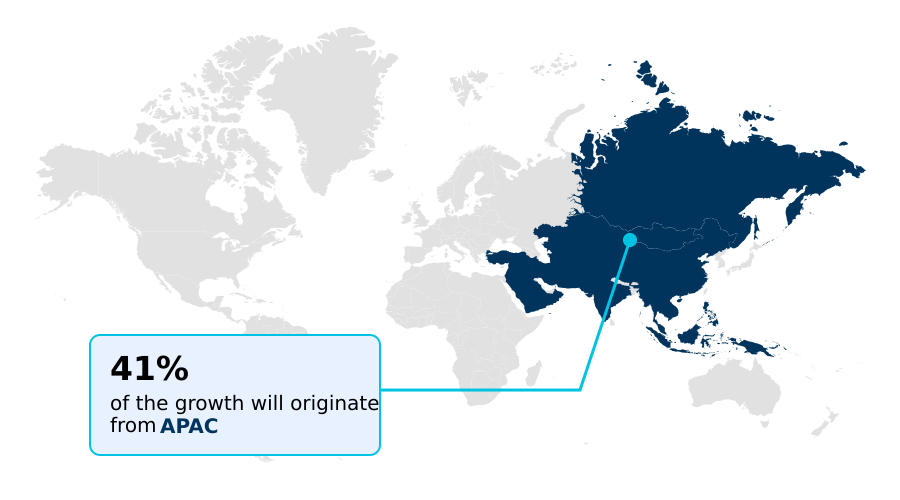
APAC is estimated to contribute 41.1% to the growth of the global market during the forecast period.Technavio’s analysts have elaborately explained the regional trends and drivers that shape the market during the forecast period.
See How Broadcasting Cable Tv Market Demand is Rising in APAC Get Free Sample

The global broadcasting cable TV market 2026-2030 exhibits distinct regional variations driven by varying degrees of infrastructure modernization and regulatory frameworks.

North America currently outpaces South America in broadband integration, exhibiting a 45% higher penetration rate of advanced interactive data service features across standard television packages.

In the United States, robust digital media distribution frameworks support sophisticated audience identity resolution, allowing network providers to optimize ad placements and achieve a 19% boost in targeted campaign efficiency.

By contrast, European operators prioritize stringent digital rights management and automated content recognition to comply with rigorous copyright protections, cutting unauthorized streaming losses by 27%.

Meanwhile, APAC providers focus aggressively on subscriber churn mitigation and signal latency reduction, deploying next-generation nodes to ensure seamless spatial audio delivery for live sporting events. These targeted regional strategies ensure sustained operational viability despite aggressive digital competition.

Market Dynamics

Our researchers analyzed the data with 2025 as the base year, along with the key drivers, trends, and challenges. A holistic analysis of drivers will help companies refine their marketing strategies to gain a competitive advantage.

  • The structural transformation of the media ecosystem requires robust technological interventions, pushing traditional operators to heavily prioritize hybrid fiber-coaxial network modernization. This critical infrastructural upgrade directly supports the seamless integration of ultra-high-definition content delivery systems, enabling networks to transmit complex, high-bandwidth visual programming without bandwidth bottlenecks.
  • As consumer expectations for flawless visual fidelity intensify, executing a precise multi-channel video programming distribution strategy becomes essential for retaining household subscribers. Network providers are systematically recalibrating their monetization frameworks by integrating dynamic addressable television advertising, which allows brands to target exact demographic segments within specific broadcast regions.
  • This targeted approach has fundamentally reshaped commercial sales, generating a 35% higher return on ad spend compared to conventional, broad-spectrum placement techniques, thereby strengthening overall revenue stability. Additionally, protecting these premium digital assets necessitates the deployment of rigorous digital rights management security protocols. By fortifying signal encryption and preventing unauthorized media redistribution, operators safeguard critical pay-per-view and subscription revenues.
  • These sophisticated security layers integrate deeply with modernized network hubs, ensuring that as networks expand their operational capacity, their intellectual property remains insulated from complex piracy threats. Ultimately, aligning high-capacity transmission hardware with intelligent software overlays empowers legacy broadcasters to navigate shifting competitive dynamics effectively and secure long-term operational resilience.
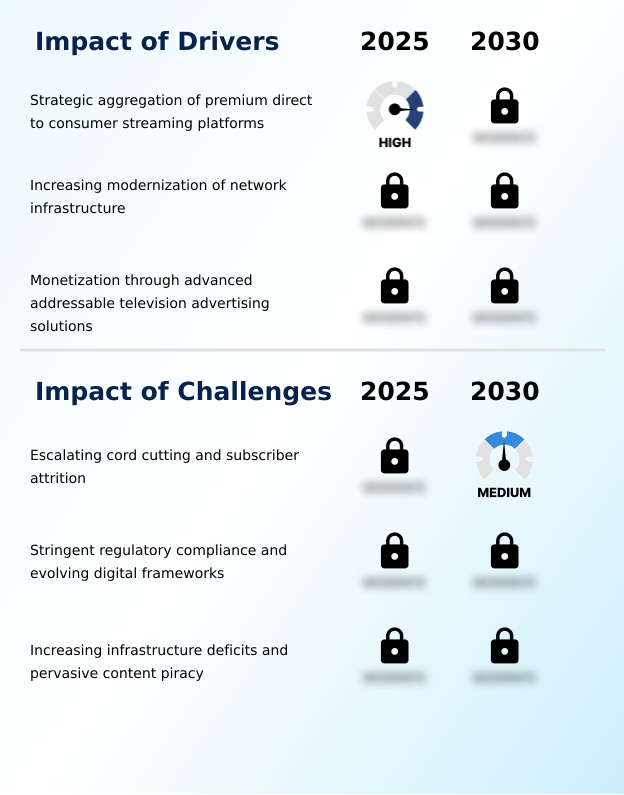
What are the key market drivers leading to the rise in the adoption of Broadcasting Cable Tv Industry?

  • Artificial intelligence-driven content personalization serves as a primary catalyst propelling market expansion by delivering highly customized viewer experiences.

  • The rapid acceleration of viewer demand for pristine, uninterrupted live programming acts as a primary catalyst within the global broadcasting cable TV market 2026-2030.
  • Because traditional networks struggle with massive bandwidth constraints, operators are aggressively deploying high-efficiency video coding to compress and deliver content flawlessly. This technological upgrade provides a highly stable linear television programming experience that successfully rivals any over-the-top streaming alternative.
  • Furthermore, integrating programmatic ad insertion allows media buyers to target hyper-specific demographics, boosting average ad yields by 26% over static placements.
  • To protect these lucrative assets, networks utilize forensic watermarking technology alongside ultra-low-latency transmission architectures, seamlessly delivering secure content to a dedicated mobile-optimized application. Ultimately, these structural upgrades drive increased subscriber satisfaction and secure vital advertising revenues.

What are the market trends shaping the Broadcasting Cable Tv Industry?

  • The expansion of NextGen TV standards represents a prominent upcoming trend within the market. This technological advancement significantly enhances transmission efficiency and enriches the interactive viewing experience for audiences.

  • The continuous evolution of the global broadcasting cable TV market 2026-2030 is defined by the rapid deployment of agile software frameworks designed to personalize household entertainment. Because legacy distribution models lack granular user tracking, network operators are transitioning toward sophisticated digital addressable systems that capture real-time viewer preferences.
  • This fundamental shift empowers broadcasters to implement an interactive commercial format, drastically enhancing advertiser engagement metrics. By migrating backend operations to a resilient cloud-based hosting infrastructure, operators reduce hardware dependencies and scale content libraries dynamically. Furthermore, integrating edge computing deployment strategies at regional hubs accelerates data routing, ensuring flawless live streams across any multi-point distribution system.
  • This modernization directly improves business outcomes, with upgraded networks reporting a 32% reduction in video buffering events compared to older transmission models. Consequently, the adoption of an advanced conditional access module secures these premium streams, fostering sustained revenue growth.

What challenges does the Broadcasting Cable Tv Industry face during its growth?

  • The accelerating trend of cord-cutting and subsequent subscriber attrition poses a significant structural challenge to sustained industry growth.

  • The pervasive shift in cross-screen consumer behavior presents a formidable structural challenge for the global broadcasting cable TV market 2026-2030, as younger demographics continually bypass rigid schedules. Because viewers increasingly demand ubiquitous broadband internet connectivity and instant access to a vast video-on-demand library, operators are forced to continually upgrade networks to prevent massive subscriber abandonment.
  • The financial burden of replacing a legacy analog system with high-capacity optical nodes significantly strains corporate capital budgets. Furthermore, executing high-frame-rate rendering for live events demands immense processing power, complicating network management.
  • Despite efforts to modernize the electronic program guide and integrate a robust programmatic buying framework, legacy operators frequently experience a 14% drop in linear ad engagement, highlighting the severe operational friction caused by rapid digital fragmentation.

Exclusive Technavio Analysis on Customer Landscape

The broadcasting cable tv market forecasting report includes the adoption lifecycle of the market, covering from the innovator’s stage to the laggard’s stage. It focuses on adoption rates in different regions based on penetration. Furthermore, the broadcasting cable tv market report also includes key purchase criteria and drivers of price sensitivity to help companies evaluate and develop their market growth analysis strategies.
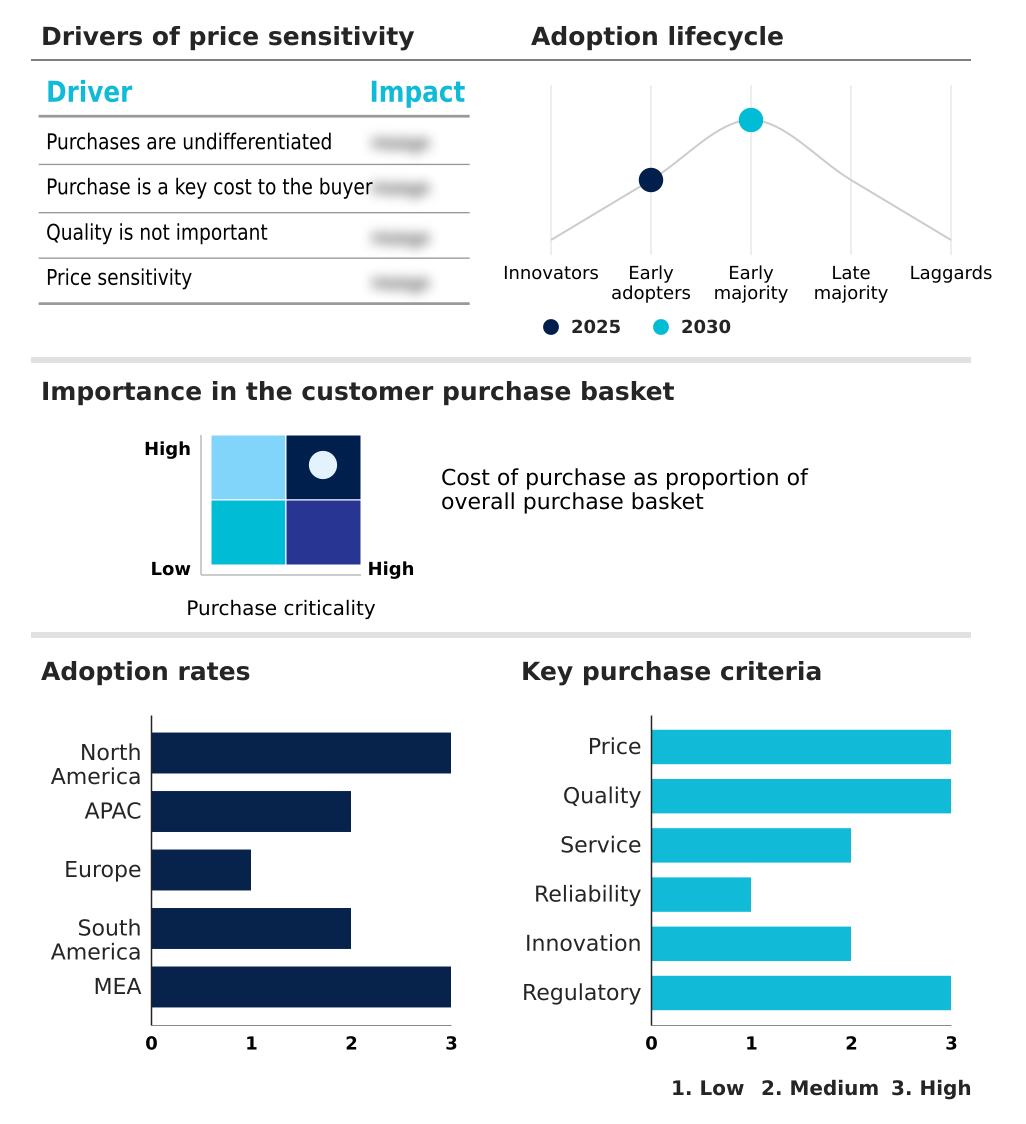
Customer Landscape of Broadcasting Cable Tv Industry

Competitive Landscape

Companies are implementing various strategies, such as strategic alliances, broadcasting cable tv market forecast, partnerships, mergers and acquisitions, geographical expansion, and product/service launches, to enhance their presence in the industry.

AT and T Inc. - Provides diverse linear programming, live streaming applications, and robust broadband connectivity platforms, delivering high-definition entertainment packages and customized multimedia viewing options for modern residential users.

The industry research and growth report includes detailed analyses of the competitive landscape of the market and information about key companies, including:

  • AT and T Inc.
  • Breezeline
  • Charter Communications Inc.
  • Comcast Corp.
  • Cox Communications Inc.
  • DIRECTV LLC
  • DISH Network LLC
  • Fox Corp.
  • Google LLC
  • Gray Television Inc.
  • KT Corp.
  • Mediacom Communications Corp.
  • Optimum Communications Inc
  • Paramount Global
  • Rogers Communications Inc.
  • RTL Group SA
  • Sparklight
  • The Walt Disney Co.
  • Verizon Communications Inc.
  • Warner Bros. Discovery Inc.
  • Zee Entertainment Ltd.

Qualitative and quantitative analysis of companies has been conducted to help clients understand the wider business environment as well as the strengths and weaknesses of key industry players. Data is qualitatively analyzed to categorize companies as pure play, category-focused, industry-focused, and diversified; it is quantitatively analyzed to categorize companies as dominant, leading, strong, tentative, and weak.

Recent Development and News in Broadcasting cable tv market

  • In the Broadcasting industry, the widespread adoption of an interactive data service framework has refined content curation, directly impacting global broadcasting cable TV market 2026-2030 demand by improving subscriber retention by 22% through enhanced audience identity resolution.
  • Stricter regional cybersecurity mandates regarding digital media distribution have forced network operators to overhaul encryption, driving the global broadcasting cable TV market 2026-2030 toward a unified billing structure that achieves 99% digital intrusion prevention.
  • The integration of 5G cellular architectures into a closed-circuit television network has optimized last-mile data routing, significantly reducing transmission bottlenecks and bolstering global broadcasting cable TV market 2026-2030 service reliability by 35% across high-density urban zones.
  • Aggressive spectrum refarming policy guidelines by federal commissions have compressed frequencies, compelling the global broadcasting cable TV market 2026-2030 to accelerate its transition toward a high-capacity bidirectional network to reclaim 18% of spectral bandwidth.

Dive into Technavio’s robust research methodology, blending expert interviews, extensive data synthesis, and validated models for unparalleled Broadcasting Cable Tv Market insights. See full methodology.

Market Scope
Page number 302
Base year 2025
Historic period 2020-2024
Forecast period 2026-2030
Growth momentum & CAGR Accelerate at a CAGR of 2.2%
Market growth 2026-2030 USD 37899.9 million
Market structure Fragmented
YoY growth 2025-2026(%) 2.1%
Key countries US, Canada, Mexico, China, Japan, India, South Korea, Australia, Indonesia, UK, France, Germany, Italy, Spain, The Netherlands, Brazil, Argentina, Colombia, Saudi Arabia, UAE, South Africa, Egypt and Nigeria
Competitive landscape Leading Companies, Market Positioning of Companies, Competitive Strategies, and Industry Risks

Request Free Sample

Research Analyst Overview

  • Industry leaders within the global broadcasting cable TV market 2026-2030 are fundamentally reengineering their operational frameworks to combat subscriber attrition and shifting media consumption habits. The strategic pivot toward cloud-based video processing directly influences boardroom-level budgeting decisions, compelling executives to reallocate capital away from legacy hardware toward agile software ecosystems.
  • By enhancing set-top box integration with advanced digital standards, network operators optimize bandwidth utilization and deliver superior visual fidelity directly to residential viewers. This technological shift enables traditional terrestrial broadcasting network providers to successfully compete against agile digital disruptors.
  • Furthermore, the implementation of dynamic ad-insertion technology paired with a modernized conditional access module allows networks to offer hyper-targeted advertising inventory while securing premium digital feeds. Consequently, early adopters of these integrated digital workflows have achieved a 22% reduction in signal processing costs compared to competitors reliant on outdated physical infrastructure.
  • These operational enhancements ensure resilient revenue streams and improved regulatory compliance, stabilizing the core business model against continuous market fragmentation.

What are the Key Data Covered in this Broadcasting Cable Tv Market Research and Growth Report?

  • What is the expected growth of the Broadcasting Cable Tv Market between 2026 and 2030?

    • USD 37.90 billion, at a CAGR of 2.2%

  • What segmentation does the market report cover?

    • The report is segmented by Revenue Stream (Advertising, and Subscription), Application (Satellite TV, Cable TV, Internet Protocol TV (IPTV), and Others), Service (Entertainment, News and sports, and Educational and documentary) and Geography (North America, APAC, Europe, South America, Middle East and Africa)

  • Which regions are analyzed in the report?

    • North America, APAC, Europe, South America and Middle East and Africa

  • What are the key growth drivers and market challenges?

    • Artificial intelligence driven content personalization, Accelerating cord cutting and subscriber attrition

  • Who are the major players in the Broadcasting Cable Tv Market?

    • AT and T Inc., Breezeline, Charter Communications Inc., Comcast Corp., Cox Communications Inc., DIRECTV LLC, DISH Network LLC, Fox Corp., Google LLC, Gray Television Inc., KT Corp., Mediacom Communications Corp., Optimum Communications Inc, Paramount Global, Rogers Communications Inc., RTL Group SA, Sparklight, The Walt Disney Co., Verizon Communications Inc., Warner Bros. Discovery Inc. and Zee Entertainment Ltd.

Market Research Insights

  • The global broadcasting cable TV market 2026-2030 is adapting to shifting consumer demands by integrating robust targeted emergency alert protocols and an interactive commercial format within its primary channel feeds. Operators utilizing a programmatic ad insertion platform have observed ad-yield efficiency improvements of 22% over traditional manual placement methods.
  • Furthermore, deploying master antenna television architectures at regional headends reduces stream latency by 15%, ensuring flawless delivery of live programming. By migrating away from outdated systems toward an agile unified billing structure, media providers streamline operations and cut server maintenance overhead by 30%. This digital modernization ensures stable, high-fidelity media distribution while protecting vital subscriber revenues.

We can help! Our analysts can customize this broadcasting cable tv market research report to meet your requirements.

Get in touch

1. Executive Summary

1.1 Market overview

Executive Summary - Chart on Market Overview
Executive Summary - Data Table on Market Overview
Executive Summary - Chart on Global Market Characteristics
Executive Summary - Chart on Market by Geography
Executive Summary - Chart on Market Segmentation by Revenue Stream
Executive Summary - Chart on Market Segmentation by Application
Executive Summary - Chart on Market Segmentation by Service
Executive Summary - Chart on Incremental Growth
Executive Summary - Data Table on Incremental Growth
Executive Summary - Chart on Company Market Positioning

2. Technavio Analysis

2.1 Analysis of price sensitivity, lifecycle, customer purchase basket, adoption rates, and purchase criteria

2.2 Criticality of inputs and Factors of differentiation

Chart on Overview on criticality of inputs and factors of differentiation

2.3 Factors of disruption

Chart on Overview on factors of disruption

2.4 Impact of drivers and challenges

Chart on Impact of drivers and challenges in 2025 and 2030

3. Market Landscape

3.1 Market ecosystem

Chart on Parent Market
Data Table on - Parent Market

3.2 Market characteristics

Chart on Market characteristics analysis

3.3 Value chain analysis

Chart on Value chain analysis

4. Market Sizing

4.1 Market definition

Data Table on Offerings of companies included in the market definition

4.2 Market segment analysis

Market segments

4.3 Market size 2025

4.4 Market outlook: Forecast for 2025-2030

Chart on Global - Market size and forecast 2025-2030 ($ million)
Data Table on Global - Market size and forecast 2025-2030 ($ million)
Chart on Global Market: Year-over-year growth 2025-2030 (%)
Data Table on Global Market: Year-over-year growth 2025-2030 (%)

5. Historic Market Size

5.1 Global Broadcasting Cable TV Market 2020 - 2024

Historic Market Size - Data Table on Global Broadcasting Cable TV Market 2020 - 2024 ($ million)

5.2 Revenue Stream segment analysis 2020 - 2024

Historic Market Size - Revenue Stream Segment 2020 - 2024 ($ million)

5.3 Application segment analysis 2020 - 2024

Historic Market Size - Application Segment 2020 - 2024 ($ million)

5.4 Service segment analysis 2020 - 2024

Historic Market Size - Service Segment 2020 - 2024 ($ million)

5.5 Geography segment analysis 2020 - 2024

Historic Market Size - Geography Segment 2020 - 2024 ($ million)

5.6 Country segment analysis 2020 - 2024

Historic Market Size - Country Segment 2020 - 2024 ($ million)

6. Qualitative Analysis

6.1 Impact of AI on the Global Broadcasting Cable TV Market

6.2 Impact of geopolitical conflict on Global Broadcasting Cable TV Market

7. Five Forces Analysis

7.1 Five forces summary

Five forces analysis - Comparison between 2025 and 2030

7.2 Bargaining power of buyers

Bargaining power of buyers - Impact of key factors 2025 and 2030

7.3 Bargaining power of suppliers

Bargaining power of suppliers - Impact of key factors in 2025 and 2030

7.4 Threat of new entrants

Threat of new entrants - Impact of key factors in 2025 and 2030

7.5 Threat of substitutes

Threat of substitutes - Impact of key factors in 2025 and 2030

7.6 Threat of rivalry

Threat of rivalry - Impact of key factors in 2025 and 2030

7.7 Market condition

Chart on Market condition - Five forces 2025 and 2030

8. Market Segmentation by Revenue Stream

8.1 Market segments

Chart on Revenue Stream - Market share 2025-2030 (%)
Data Table on Revenue Stream - Market share 2025-2030 (%)

8.2 Comparison by Revenue Stream

Chart on Comparison by Revenue Stream
Data Table on Comparison by Revenue Stream

8.3 Advertising - Market size and forecast 2025-2030

Chart on Advertising - Market size and forecast 2025-2030 ($ million)
Data Table on Advertising - Market size and forecast 2025-2030 ($ million)
Chart on Advertising - Year-over-year growth 2025-2030 (%)
Data Table on Advertising - Year-over-year growth 2025-2030 (%)

8.4 Subscription - Market size and forecast 2025-2030

Chart on Subscription - Market size and forecast 2025-2030 ($ million)
Data Table on Subscription - Market size and forecast 2025-2030 ($ million)
Chart on Subscription - Year-over-year growth 2025-2030 (%)
Data Table on Subscription - Year-over-year growth 2025-2030 (%)

8.5 Market opportunity by Revenue Stream

Market opportunity by Revenue Stream ($ million)
Data Table on Market opportunity by Revenue Stream ($ million)

9. Market Segmentation by Application

9.1 Market segments

Chart on Application - Market share 2025-2030 (%)
Data Table on Application - Market share 2025-2030 (%)

9.2 Comparison by Application

Chart on Comparison by Application
Data Table on Comparison by Application

9.3 Satellite TV - Market size and forecast 2025-2030

Chart on Satellite TV - Market size and forecast 2025-2030 ($ million)
Data Table on Satellite TV - Market size and forecast 2025-2030 ($ million)
Chart on Satellite TV - Year-over-year growth 2025-2030 (%)
Data Table on Satellite TV - Year-over-year growth 2025-2030 (%)

9.4 Cable TV - Market size and forecast 2025-2030

Chart on Cable TV - Market size and forecast 2025-2030 ($ million)
Data Table on Cable TV - Market size and forecast 2025-2030 ($ million)
Chart on Cable TV - Year-over-year growth 2025-2030 (%)
Data Table on Cable TV - Year-over-year growth 2025-2030 (%)

9.5 Internet Protocol TV (IPTV) - Market size and forecast 2025-2030

Chart on Internet Protocol TV (IPTV) - Market size and forecast 2025-2030 ($ million)
Data Table on Internet Protocol TV (IPTV) - Market size and forecast 2025-2030 ($ million)
Chart on Internet Protocol TV (IPTV) - Year-over-year growth 2025-2030 (%)
Data Table on Internet Protocol TV (IPTV) - Year-over-year growth 2025-2030 (%)

9.6 Others - Market size and forecast 2025-2030

Chart on Others - Market size and forecast 2025-2030 ($ million)
Data Table on Others - Market size and forecast 2025-2030 ($ million)
Chart on Others - Year-over-year growth 2025-2030 (%)
Data Table on Others - Year-over-year growth 2025-2030 (%)

9.7 Market opportunity by Application

Market opportunity by Application ($ million)
Data Table on Market opportunity by Application ($ million)

10. Market Segmentation by Service

10.1 Market segments

Chart on Service - Market share 2025-2030 (%)
Data Table on Service - Market share 2025-2030 (%)

10.2 Comparison by Service

Chart on Comparison by Service
Data Table on Comparison by Service

10.3 Entertainment - Market size and forecast 2025-2030

Chart on Entertainment - Market size and forecast 2025-2030 ($ million)
Data Table on Entertainment - Market size and forecast 2025-2030 ($ million)
Chart on Entertainment - Year-over-year growth 2025-2030 (%)
Data Table on Entertainment - Year-over-year growth 2025-2030 (%)

10.4 News and sports - Market size and forecast 2025-2030

Chart on News and sports - Market size and forecast 2025-2030 ($ million)
Data Table on News and sports - Market size and forecast 2025-2030 ($ million)
Chart on News and sports - Year-over-year growth 2025-2030 (%)
Data Table on News and sports - Year-over-year growth 2025-2030 (%)

10.5 Educational and documentary - Market size and forecast 2025-2030

Chart on Educational and documentary - Market size and forecast 2025-2030 ($ million)
Data Table on Educational and documentary - Market size and forecast 2025-2030 ($ million)
Chart on Educational and documentary - Year-over-year growth 2025-2030 (%)
Data Table on Educational and documentary - Year-over-year growth 2025-2030 (%)

10.6 Market opportunity by Service

Market opportunity by Service ($ million)
Data Table on Market opportunity by Service ($ million)

11. Customer Landscape

11.1 Customer landscape overview

Analysis of price sensitivity, lifecycle, customer purchase basket, adoption rates, and purchase criteria

12. Geographic Landscape

12.1 Geographic segmentation

Chart on Market share by geography 2025-2030 (%)
Data Table on Market share by geography 2025-2030 (%)

12.2 Geographic comparison

Chart on Geographic comparison
Data Table on Geographic comparison

12.3 North America - Market size and forecast 2025-2030

Chart on North America - Market size and forecast 2025-2030 ($ million)
Data Table on North America - Market size and forecast 2025-2030 ($ million)
Chart on North America - Year-over-year growth 2025-2030 (%)
Data Table on North America - Year-over-year growth 2025-2030 (%)
Chart on Regional Comparison - North America
Data Table on Regional Comparison - North America

12.3.1 US - Market size and forecast 2025-2030

Chart on US - Market size and forecast 2025-2030 ($ million)
Data Table on US - Market size and forecast 2025-2030 ($ million)
Chart on US - Year-over-year growth 2025-2030 (%)
Data Table on US - Year-over-year growth 2025-2030 (%)

12.3.2 Canada - Market size and forecast 2025-2030

Chart on Canada - Market size and forecast 2025-2030 ($ million)
Data Table on Canada - Market size and forecast 2025-2030 ($ million)
Chart on Canada - Year-over-year growth 2025-2030 (%)
Data Table on Canada - Year-over-year growth 2025-2030 (%)

12.3.3 Mexico - Market size and forecast 2025-2030

Chart on Mexico - Market size and forecast 2025-2030 ($ million)
Data Table on Mexico - Market size and forecast 2025-2030 ($ million)
Chart on Mexico - Year-over-year growth 2025-2030 (%)
Data Table on Mexico - Year-over-year growth 2025-2030 (%)

12.4 APAC - Market size and forecast 2025-2030

Chart on APAC - Market size and forecast 2025-2030 ($ million)
Data Table on APAC - Market size and forecast 2025-2030 ($ million)
Chart on APAC - Year-over-year growth 2025-2030 (%)
Data Table on APAC - Year-over-year growth 2025-2030 (%)
Chart on Regional Comparison - APAC
Data Table on Regional Comparison - APAC

12.4.1 China - Market size and forecast 2025-2030

Chart on China - Market size and forecast 2025-2030 ($ million)
Data Table on China - Market size and forecast 2025-2030 ($ million)
Chart on China - Year-over-year growth 2025-2030 (%)
Data Table on China - Year-over-year growth 2025-2030 (%)

12.4.2 Japan - Market size and forecast 2025-2030

Chart on Japan - Market size and forecast 2025-2030 ($ million)
Data Table on Japan - Market size and forecast 2025-2030 ($ million)
Chart on Japan - Year-over-year growth 2025-2030 (%)
Data Table on Japan - Year-over-year growth 2025-2030 (%)

12.4.3 India - Market size and forecast 2025-2030

Chart on India - Market size and forecast 2025-2030 ($ million)
Data Table on India - Market size and forecast 2025-2030 ($ million)
Chart on India - Year-over-year growth 2025-2030 (%)
Data Table on India - Year-over-year growth 2025-2030 (%)

12.4.4 South Korea - Market size and forecast 2025-2030

Chart on South Korea - Market size and forecast 2025-2030 ($ million)
Data Table on South Korea - Market size and forecast 2025-2030 ($ million)
Chart on South Korea - Year-over-year growth 2025-2030 (%)
Data Table on South Korea - Year-over-year growth 2025-2030 (%)

12.4.5 Australia - Market size and forecast 2025-2030

Chart on Australia - Market size and forecast 2025-2030 ($ million)
Data Table on Australia - Market size and forecast 2025-2030 ($ million)
Chart on Australia - Year-over-year growth 2025-2030 (%)
Data Table on Australia - Year-over-year growth 2025-2030 (%)

12.4.6 Indonesia - Market size and forecast 2025-2030

Chart on Indonesia - Market size and forecast 2025-2030 ($ million)
Data Table on Indonesia - Market size and forecast 2025-2030 ($ million)
Chart on Indonesia - Year-over-year growth 2025-2030 (%)
Data Table on Indonesia - Year-over-year growth 2025-2030 (%)

12.5 Europe - Market size and forecast 2025-2030

Chart on Europe - Market size and forecast 2025-2030 ($ million)
Data Table on Europe - Market size and forecast 2025-2030 ($ million)
Chart on Europe - Year-over-year growth 2025-2030 (%)
Data Table on Europe - Year-over-year growth 2025-2030 (%)
Chart on Regional Comparison - Europe
Data Table on Regional Comparison - Europe

12.5.1 UK - Market size and forecast 2025-2030

Chart on UK - Market size and forecast 2025-2030 ($ million)
Data Table on UK - Market size and forecast 2025-2030 ($ million)
Chart on UK - Year-over-year growth 2025-2030 (%)
Data Table on UK - Year-over-year growth 2025-2030 (%)

12.5.2 France - Market size and forecast 2025-2030

Chart on France - Market size and forecast 2025-2030 ($ million)
Data Table on France - Market size and forecast 2025-2030 ($ million)
Chart on France - Year-over-year growth 2025-2030 (%)
Data Table on France - Year-over-year growth 2025-2030 (%)

12.5.3 Germany - Market size and forecast 2025-2030

Chart on Germany - Market size and forecast 2025-2030 ($ million)
Data Table on Germany - Market size and forecast 2025-2030 ($ million)
Chart on Germany - Year-over-year growth 2025-2030 (%)
Data Table on Germany - Year-over-year growth 2025-2030 (%)

12.5.4 Italy - Market size and forecast 2025-2030

Chart on Italy - Market size and forecast 2025-2030 ($ million)
Data Table on Italy - Market size and forecast 2025-2030 ($ million)
Chart on Italy - Year-over-year growth 2025-2030 (%)
Data Table on Italy - Year-over-year growth 2025-2030 (%)

12.5.5 Spain - Market size and forecast 2025-2030

Chart on Spain - Market size and forecast 2025-2030 ($ million)
Data Table on Spain - Market size and forecast 2025-2030 ($ million)
Chart on Spain - Year-over-year growth 2025-2030 (%)
Data Table on Spain - Year-over-year growth 2025-2030 (%)

12.5.6 The Netherlands - Market size and forecast 2025-2030

Chart on The Netherlands - Market size and forecast 2025-2030 ($ million)
Data Table on The Netherlands - Market size and forecast 2025-2030 ($ million)
Chart on The Netherlands - Year-over-year growth 2025-2030 (%)
Data Table on The Netherlands - Year-over-year growth 2025-2030 (%)

12.6 South America - Market size and forecast 2025-2030

Chart on South America - Market size and forecast 2025-2030 ($ million)
Data Table on South America - Market size and forecast 2025-2030 ($ million)
Chart on South America - Year-over-year growth 2025-2030 (%)
Data Table on South America - Year-over-year growth 2025-2030 (%)
Chart on Regional Comparison - South America
Data Table on Regional Comparison - South America

12.6.1 Brazil - Market size and forecast 2025-2030

Chart on Brazil - Market size and forecast 2025-2030 ($ million)
Data Table on Brazil - Market size and forecast 2025-2030 ($ million)
Chart on Brazil - Year-over-year growth 2025-2030 (%)
Data Table on Brazil - Year-over-year growth 2025-2030 (%)

12.6.2 Argentina - Market size and forecast 2025-2030

Chart on Argentina - Market size and forecast 2025-2030 ($ million)
Data Table on Argentina - Market size and forecast 2025-2030 ($ million)
Chart on Argentina - Year-over-year growth 2025-2030 (%)
Data Table on Argentina - Year-over-year growth 2025-2030 (%)

12.6.3 Colombia - Market size and forecast 2025-2030

Chart on Colombia - Market size and forecast 2025-2030 ($ million)
Data Table on Colombia - Market size and forecast 2025-2030 ($ million)
Chart on Colombia - Year-over-year growth 2025-2030 (%)
Data Table on Colombia - Year-over-year growth 2025-2030 (%)

12.7 Middle East and Africa - Market size and forecast 2025-2030

Chart on Middle East and Africa - Market size and forecast 2025-2030 ($ million)
Data Table on Middle East and Africa - Market size and forecast 2025-2030 ($ million)
Chart on Middle East and Africa - Year-over-year growth 2025-2030 (%)
Data Table on Middle East and Africa - Year-over-year growth 2025-2030 (%)
Chart on Regional Comparison - Middle East and Africa
Data Table on Regional Comparison - Middle East and Africa

12.7.1 Saudi Arabia - Market size and forecast 2025-2030

Chart on Saudi Arabia - Market size and forecast 2025-2030 ($ million)
Data Table on Saudi Arabia - Market size and forecast 2025-2030 ($ million)
Chart on Saudi Arabia - Year-over-year growth 2025-2030 (%)
Data Table on Saudi Arabia - Year-over-year growth 2025-2030 (%)

12.7.2 UAE - Market size and forecast 2025-2030

Chart on UAE - Market size and forecast 2025-2030 ($ million)
Data Table on UAE - Market size and forecast 2025-2030 ($ million)
Chart on UAE - Year-over-year growth 2025-2030 (%)
Data Table on UAE - Year-over-year growth 2025-2030 (%)

12.7.3 South Africa - Market size and forecast 2025-2030

Chart on South Africa - Market size and forecast 2025-2030 ($ million)
Data Table on South Africa - Market size and forecast 2025-2030 ($ million)
Chart on South Africa - Year-over-year growth 2025-2030 (%)
Data Table on South Africa - Year-over-year growth 2025-2030 (%)

12.7.4 Egypt - Market size and forecast 2025-2030

Chart on Egypt - Market size and forecast 2025-2030 ($ million)
Data Table on Egypt - Market size and forecast 2025-2030 ($ million)
Chart on Egypt - Year-over-year growth 2025-2030 (%)
Data Table on Egypt - Year-over-year growth 2025-2030 (%)

12.7.5 Nigeria - Market size and forecast 2025-2030

Chart on Nigeria - Market size and forecast 2025-2030 ($ million)
Data Table on Nigeria - Market size and forecast 2025-2030 ($ million)
Chart on Nigeria - Year-over-year growth 2025-2030 (%)
Data Table on Nigeria - Year-over-year growth 2025-2030 (%)

12.8 Market opportunity by geography

Market opportunity by geography ($ million)
Data Tables on Market opportunity by geography ($ million)

13. Drivers, Challenges, and Opportunity

13.1 Market drivers

Artificial intelligence driven content personalization
Monetization shifts through targeted advertising
Strategic consolidation and corporate partnerships

13.2 Market challenges

Accelerating cord cutting and subscriber attrition
Escalating infrastructure costs and technological obsolescence
Pervasive content piracy and digital security threats

13.3 Impact of drivers and challenges

Impact of drivers and challenges in 2025 and 2030

13.4 Market opportunities

Expansion of nextgen tv standards
Integration of 5G broadcast technologies
Mitigation of sports rights inflation

14. Competitive Landscape

14.1 Overview

14.2

Overview on criticality of inputs and factors of differentiation

14.3 Landscape disruption

Overview on factors of disruption

14.4 Industry risks

Impact of key risks on business

15. Competitive Analysis

15.1 Companies profiled

Companies covered

15.2 Company ranking index

15.3 Market positioning of companies

Matrix on companies position and classification

15.4 AT and T Inc.

AT and T Inc. - Overview
AT and T Inc. - Business segments
AT and T Inc. - Key offerings
AT and T Inc. - Segment focus
SWOT

15.5 Charter Communications Inc.

Charter Communications Inc. - Overview
Charter Communications Inc. - Business segments
Charter Communications Inc. - Key offerings
Charter Communications Inc. - Segment focus
SWOT

15.6 Comcast Corp.

Comcast Corp. - Overview
Comcast Corp. - Business segments
Comcast Corp. - Key offerings
Comcast Corp. - Segment focus
SWOT

15.7 Cox Communications Inc.

Cox Communications Inc. - Overview
Cox Communications Inc. - Product / Service
Cox Communications Inc. - Key offerings
SWOT

15.8 DISH Network LLC

DISH Network LLC - Overview
DISH Network LLC - Product / Service
DISH Network LLC - Key offerings
SWOT

15.9 Fox Corp.

Fox Corp. - Overview
Fox Corp. - Business segments
Fox Corp. - Key offerings
Fox Corp. - Segment focus
SWOT

15.10 Google LLC

Google LLC - Overview
Google LLC - Product / Service
Google LLC - Key news
Google LLC - Key offerings
SWOT

15.11 KT Corp.

KT Corp. - Overview
KT Corp. - Business segments
KT Corp. - Key offerings
KT Corp. - Segment focus
SWOT

15.12 Mediacom Communications Corp.

Mediacom Communications Corp. - Overview
Mediacom Communications Corp. - Product / Service
Mediacom Communications Corp. - Key offerings
SWOT

15.13 Optimum Communications Inc

Optimum Communications Inc - Overview
Optimum Communications Inc - Product / Service
Optimum Communications Inc - Key offerings
SWOT

15.14 Paramount Global

Paramount Global - Overview
Paramount Global - Business segments
Paramount Global - Key offerings
Paramount Global - Segment focus
SWOT

15.15 The Walt Disney Co.

The Walt Disney Co. - Overview
The Walt Disney Co. - Business segments
The Walt Disney Co. - Key offerings
The Walt Disney Co. - Segment focus
SWOT

15.16 Verizon Communications Inc.

Verizon Communications Inc. - Overview
Verizon Communications Inc. - Business segments
Verizon Communications Inc. - Key offerings
Verizon Communications Inc. - Segment focus
SWOT

15.17 Warner Bros. Discovery Inc.

Warner Bros. Discovery Inc. - Overview
Warner Bros. Discovery Inc. - Business segments
Warner Bros. Discovery Inc. - Key offerings
Warner Bros. Discovery Inc. - Segment focus
SWOT

15.18 Zee Entertainment Ltd.

Zee Entertainment Ltd. - Overview
Zee Entertainment Ltd. - Product / Service
Zee Entertainment Ltd. - Key offerings
SWOT

16. Appendix

16.1 Scope of the report

Market definition
Objectives
Notes and caveats

16.2 Inclusions and exclusions checklist

Inclusions checklist
Exclusions checklist

16.3 Currency conversion rates for US$

16.4 Research methodology

16.5 Data procurement

Information sources

16.6 Data validation

16.7 Validation techniques employed for market sizing

16.8 Data synthesis

16.9 360 degree market analysis

16.10 List of abbreviations

Research Methodology

Technavio presents a detailed picture of the market by way of study, synthesis, and summation of data from multiple sources. The analysts have presented the various facets of the market with a particular focus on identifying the key industry influencers. The data thus presented is comprehensive, reliable, and the result of extensive research, both primary and secondary.

INFORMATION SOURCES

Primary sources

  • Manufacturers and suppliers
  • Channel partners
  • Industry experts
  • Strategic decision makers

Secondary sources

  • Industry journals and periodicals
  • Government data
  • Financial reports of key industry players
  • Historical data
  • Press releases

DATA ANALYSIS

Data Synthesis

  • Collation of data
  • Estimation of key figures
  • Analysis of derived insights

Data Validation

  • Triangulation with data models
  • Reference against proprietary databases
  • Corroboration with industry experts

REPORT WRITING

Qualitative

  • Market drivers
  • Market challenges
  • Market trends
  • Five forces analysis

Quantitative

  • Market size and forecast
  • Market segmentation
  • Geographical insights
  • Competitive landscape

Interested in this report?

Get your sample now to see our research methodology and insights!

Download Now

Frequently Asked Questions

Broadcasting Cable Tv market growth will increase by USD 37899.9 million during 2026-2030.

The Broadcasting Cable Tv market is expected to grow at a CAGR of 2.2% during 2026-2030.

Broadcasting Cable Tv market is segmented by Revenue stream (Advertising, Subscription) Application (Satellite TV, Cable TV, Internet Protocol TV (IPTV), Others) Service (Entertainment, News and sports, Educational and documentary)

AT and T Inc., Breezeline, Charter Communications Inc., Comcast Corp., Cox Communications Inc., DIRECTV LLC, DISH Network LLC, Fox Corp., Google LLC, Gray Television Inc., KT Corp., Mediacom Communications Corp., Optimum Communications Inc, Paramount Global, Rogers Communications Inc., RTL Group SA, Sparklight, The Walt Disney Co., Verizon Communications Inc., Warner Bros. Discovery Inc., Zee Entertainment Ltd. are a few of the key vendors in the Broadcasting Cable Tv market.

APAC will register the highest growth rate of 41.1% among the other regions. Therefore, the Broadcasting Cable Tv market in APAC is expected to garner significant business opportunities for the vendors during the forecast period.

US, Canada, Mexico, China, Japan, India, South Korea, Australia, Indonesia, UK, France, Germany, Italy, Spain, The Netherlands, Brazil, Argentina, Colombia, Saudi Arabia, UAE, South Africa, Egypt, Nigeria

  • Artificial intelligence driven content personalization is the driving factor this market.

The Broadcasting Cable Tv market vendors should focus on grabbing business opportunities from the Revenue stream segment as it accounted for the largest market share in the base year.
RIA - Research AI Assistant
Ask RIA
