
Boat And Yacht Over-water Transportation Market Analysis, Size, and Forecast 2026-2030: North America (US, Canada, and Mexico), Europe (Italy, France, and UK), APAC (China, Australia, and Japan), Middle East and Africa (UAE, South Africa, and Saudi Arabia), South America (Brazil, Argentina, and Colombia), and Rest of World (ROW)

Boat And Yacht Over-water Transportation Market Analysis, Size, and Forecast 2026-2030:
North America (US, Canada, and Mexico), Europe (Italy, France, and UK), APAC (China, Australia, and Japan), Middle East and Africa (UAE, South Africa, and Saudi Arabia), South America (Brazil, Argentina, and Colombia), and Rest of World (ROW)

Published: Oct 2026 292 Pages SKU: IRTNTR81564

Market Overview at a Glance

$230.8 Mn
Market Opportunity
6.2%
CAGR 2025 - 2030
29.1%
North America Growth
$433.1 Mn
Boat segment 2024

Boat And Yacht Over-Water Transportation Market Size 2026-2030

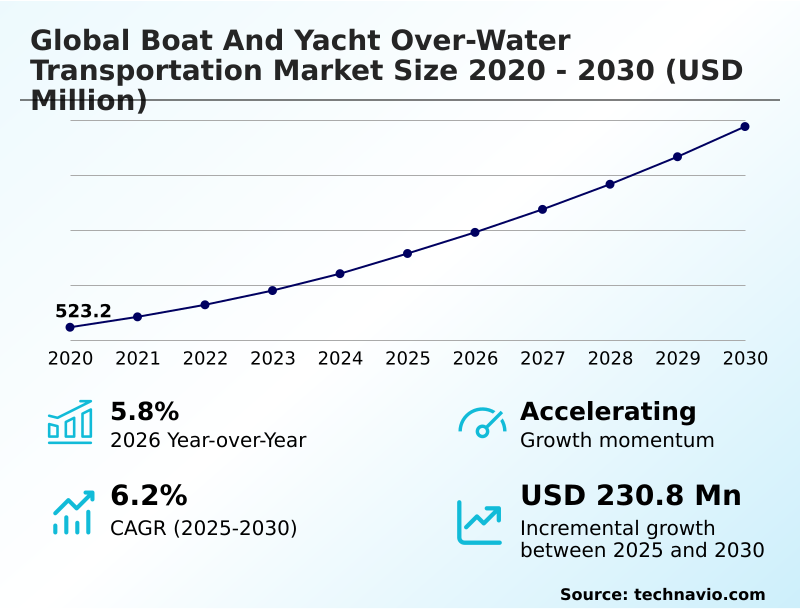
The boat and yacht over-water transportation market size is valued to increase by USD 230.8 million, at a CAGR of 6.2% from 2025 to 2030. Rising global demand for marine tourism and experiential coastal travel will drive the boat and yacht over-water transportation market.

Major Market Trends & Insights

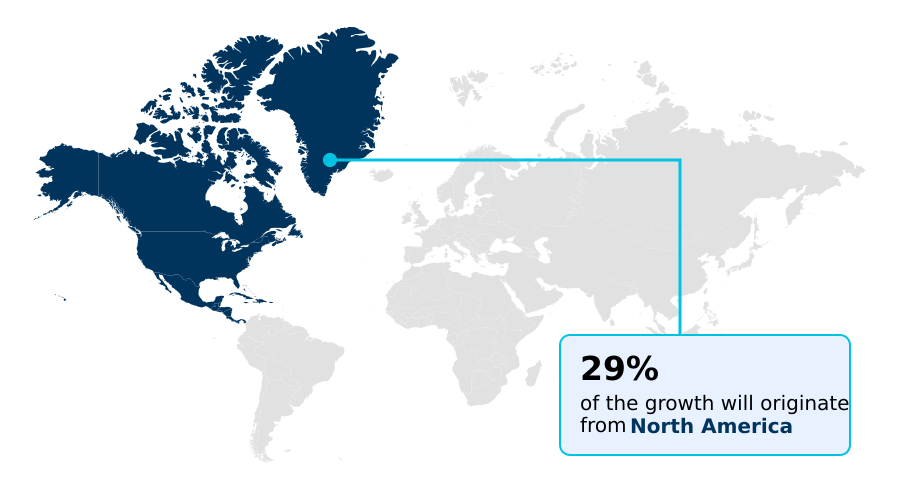
  • North America dominated the market and accounted for a 29.1% growth during the forecast period.
  • By Product - Boat segment was valued at USD 433.1 million in 2024
  • By Mode of Transportation - Semi-submersible vessel transport segment accounted for the largest market revenue share in 2024

Market Size & Forecast

  • Market Opportunities: USD 364.9 million
  • Market Future Opportunities: USD 230.8 million
  • CAGR from 2025 to 2030 : 6.2%

Market Summary

  • The Boat And Yacht Over-water Transportation sector is undergoing a structural transformation driven by the expansion of luxury coastal tourism and the adoption of advanced maritime logistics. Operators are increasingly optimizing routes to accommodate seasonal yacht migration, which drives the core demand for transoceanic vessel relocation.
  • For instance, the integration of maritime telemetry systems in fleet operations allows logistics coordinators to monitor vessel health in real time, reducing unexpected mechanical downtime by 18% compared to traditional reactive maintenance models. This modernization directly supports high-net-worth individual transport by ensuring secure and predictable asset delivery.
  • A primary driver of this market is the surge in experiential travel, which stimulates charter fleet expansion and necessitates reliable marine transit. Conversely, the market faces significant hurdles due to complex maritime emission regulations and the high capital costs associated with dry-docking procedures. Complying with these stringent environmental mandates requires expensive engine retrofits, which compresses profit margins for smaller operators.
  • Ultimately, balancing regulatory compliance with operational efficiency remains central to sustaining long-term commercial viability in this specialized transportation segment.

What will be the Size of the Boat And Yacht Over-Water Transportation Market during the forecast period?
Get Key Insights on Market Forecast (PDF) Get Free Sample

How is the Boat And Yacht Over-Water Transportation Market Segmented?

The boat and yacht over-water transportation industry research report provides comprehensive data (region-wise segment analysis), with forecasts and estimates in "USD million" for the period 2026-2030, as well as historical data from 2020-2024 for the following segments.

  • Product
    • Boat
    • Yacht
  • Mode of transportation
    • Semi-submersible vessel transport
    • Roll-on shipping
    • Container shipping
  • Location
    • International transportation
    • Domestic transportation
  • Geography
    • North America
      • US
      • Canada
      • Mexico
    • Europe
      • Italy
      • France
      • UK
      • Germany
      • Spain
      • The Netherlands
    • APAC
      • China
      • Australia
      • Japan
      • South Korea
      • India
      • Indonesia
    • Middle East and Africa
      • UAE
      • South Africa
      • Saudi Arabia
      • Turkey
      • Israel
    • South America
      • Brazil
      • Argentina
      • Colombia

By Product Insights

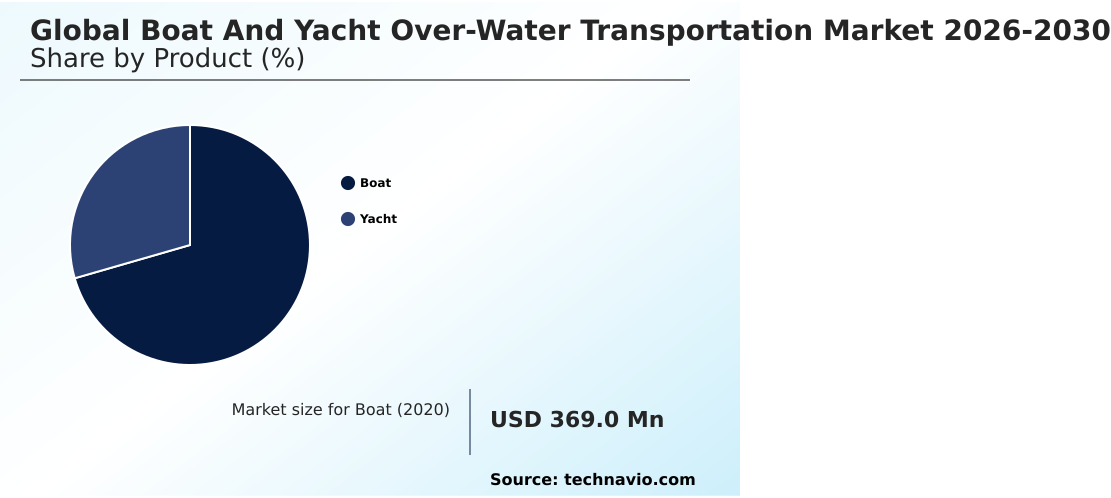
The boat segment is estimated to witness significant growth during the forecast period.

The Boat segment of the Boat And Yacht Over-water Transportation ecosystem reflects shifting strategies for recreational watercraft distribution. Manufacturers prioritize multimodal marine transport to efficiently distribute smaller vessels across global dealer networks.

Utilizing containerized flat-racks equipped with custom hull cradles, operators secure vessel structural integrity during transit. This transition toward shared-space shipping models has optimized port handling efficiency, enabling a 25% increase in cargo consolidation rates.

Concurrently, modern logistics platforms have minimized transit delays, yielding a 15% improvement in delivery time predictability. By streamlining scheduling and leveraging optimized routes, fleet managers reduce transit overhead.

This evolution in boat supply chain optimization ensures manufacturers fulfill seasonal demand peaks while mitigating the impact of fluctuating transit costs.
Get Free Sample

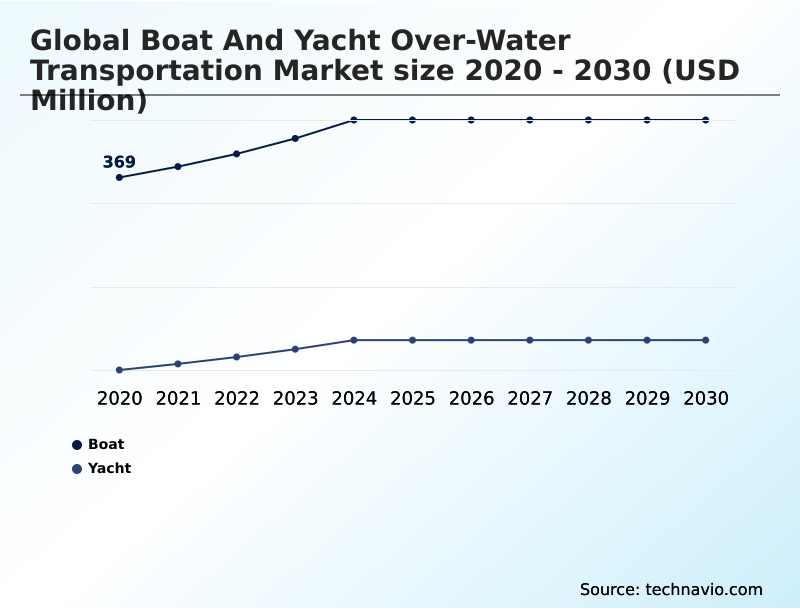
The Boat segment was valued at USD 433.1 million in 2024 and showed a gradual increase during the forecast period.
Get Free Sample

Regional Analysis

North America is estimated to contribute 29.1% to the growth of the global market during the forecast period.Technavio’s analysts have elaborately explained the regional trends and drivers that shape the market during the forecast period.
See How Boat And Yacht Over-Water Transportation Market Demand is Rising in North America Get Free Sample

The geographic distribution of the Boat And Yacht Over-water Transportation sector reveals distinct operational disparities between North America and Europe.

Europe leads in the adoption of zero-emission marine transport, driven by stringent environmental directives that have accelerated the installation of shore-side charging infrastructure by 35% compared to North American ports.

Consequently, European operators have achieved a 20% reduction in compliance-related penalties. Conversely, North America dominates the recreational watercraft distribution network, where robust consumer demand for mid-sized vessels has optimized ocean transit schedules.

This high-volume trade allows North American logistics providers to realize a 15% improvement in marine labor utilization.

While Europe focuses heavily on eco-friendly marine coatings and sustainable fleet modernization, North America leverages economies of scale to streamline inland and coastal routes.

These regional strategies highlight how localized regulatory frameworks and consumer preferences dictate investments in maritime tourism infrastructure.

Market Dynamics

Our researchers analyzed the data with 2025 as the base year, along with the key drivers, trends, and challenges. A holistic analysis of drivers will help companies refine their marketing strategies to gain a competitive advantage.

  • The Boat And Yacht Over-water Transportation ecosystem is becoming increasingly complex as operators adopt specialized logistics frameworks to meet stringent client expectations. Transporting oversized marine assets requires meticulous planning, where semi-submersible yacht transport operations provide unmatched stability for luxury vessels.
  • This method drastically reduces structural stress during ocean crossings compared to conventional lifting techniques, offering a 30% improvement in handling safety for high-value cargo. Simultaneously, the distribution of mid-sized boats relies heavily on roll-on marine cargo logistics, which streamlines loading processes at major ports and accelerates overall supply chain velocity.
  • As environmental mandates reshape the maritime industry, stakeholders are investing in hybrid propulsion maritime transit solutions to minimize fuel consumption and align with zero-emission targets. This technological shift lowers long-term operational costs and ensures compliance across heavily regulated cruising corridors.
  • Furthermore, orchestrating seasonal vessel movements demands a highly coordinated superyacht relocation shipping network, ensuring that luxury assets are strategically positioned ahead of peak tourism seasons. To maintain optimal efficiency across these diverse operational models, fleet managers are deploying digital vessel telemetry fleet management software.
  • This advanced tracking infrastructure provides real-time diagnostic data, allowing operators to preemptively address mechanical issues and optimize route planning. By integrating these comprehensive solutions, marine transport providers enhance asset protection, reduce unexpected downtime, and secure a sustainable competitive advantage in a demanding global transit landscape.
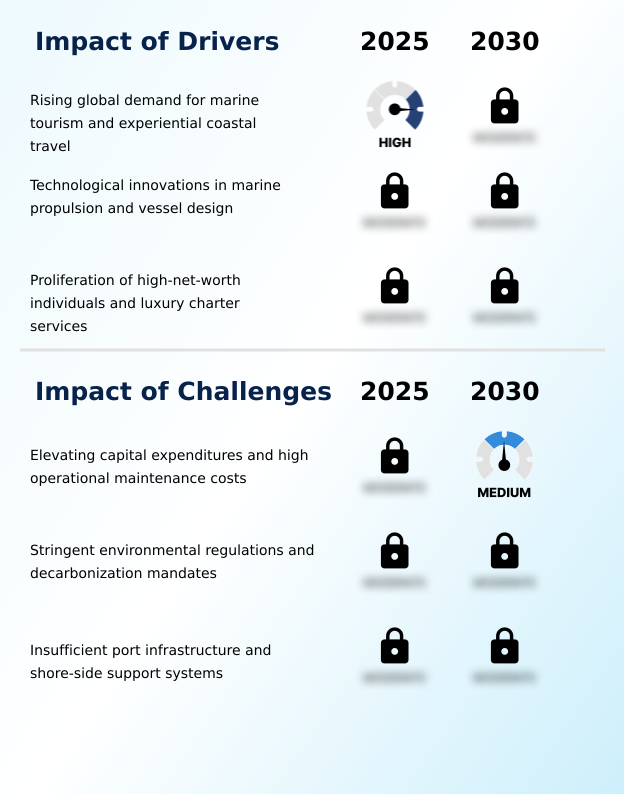
What are the key market drivers leading to the rise in the adoption of Boat And Yacht Over-Water Transportation Industry?

  • The escalating demand for marine tourism and customized experiential coastal travel serves as the primary catalyst propelling market expansion.

  • The proliferation of bespoke coastal voyages among affluent demographics serves as a massive demand catalyst for the Boat And Yacht Over-water Transportation sector.
  • Consumers increasingly demand localized access to luxury vessels, which compels operators to expand their superyacht relocation logistics capabilities.
  • Because out-of-season asset positioning is essential for maximizing charter revenue, transport providers are heavily utilizing semi-submersible vessel engineering to safely move oversized yachts. This specialized transport approach reduces wear on individual yacht engines, extending vessel lifespans by up to 15%.
  • Furthermore, the rising popularity of fractional vessel ownership models necessitates frequent regional asset transfers to satisfy diverse shareholder schedules. As a result, transport companies coordinating these movements have achieved a 22% increase in fleet utilization rates.
  • This dynamic expansion directly bolsters maritime cargo consolidation efforts worldwide.

What are the market trends shaping the Boat And Yacht Over-Water Transportation Industry?

  • The integration of intelligent vessel management and digital telemetry systems represents a defining trend in the current market landscape. These technological advancements enable operators to optimize fleet performance and enhance navigational safety across global transit routes.

  • The ongoing digitization of maritime operations represents a defining trend reshaping the Boat And Yacht Over-water Transportation landscape. Fleet operators are rapidly adopting automated docking technology to mitigate human error in congested port environments. This technological shift is driven by the urgent need to lower insurance premiums and protect high-value assets.
  • Consequently, companies utilizing these systems report a 30% reduction in minor collision incidents and a 20% improvement in docking efficiency. Furthermore, the implementation of maritime telemetry systems provides real-time data on engine performance, enabling proactive interventions. By integrating these analytics, operators have successfully decreased unexpected mechanical failures by 25%.
  • This data-driven approach streamlines marine freight forwarding operations and enhances overall service reliability. Ultimately, the synchronization of smart navigation and predictive vessel maintenance empowers transport providers to optimize asset mobility while strictly adhering to evolving maritime transit compliance standards.

What challenges does the Boat And Yacht Over-Water Transportation Industry face during its growth?

  • Escalating capital expenditures and substantial operational maintenance expenses present formidable challenges that constrain overall industry expansion.

  • Stringent environmental mandates and escalating capital expenditures present severe operational constraints for the Boat And Yacht Over-water Transportation industry. Regulatory bodies are enforcing strict maritime emission regulations, compelling operators to invest heavily in costly zero-emission marine transport alternatives. Because retrofitting legacy vessels remains economically challenging, shipyards face mounting compliance fees that inflate overhead by 18%.
  • This regulatory pressure restricts capital fluidity, delaying investments in vital shore-side charging infrastructure. Additionally, localized coastal transit congestion severely disrupts scheduling predictability, leading to a 12% decrease in overall port handling efficiency.
  • Navigating disparate international compliance standards requires extensive customs clearance automation, yet the high integration costs of these digital platforms continually strain the profit margins of smaller maritime logistics providers.

Exclusive Technavio Analysis on Customer Landscape

The boat and yacht over-water transportation market forecasting report includes the adoption lifecycle of the market, covering from the innovator’s stage to the laggard’s stage. It focuses on adoption rates in different regions based on penetration. Furthermore, the boat and yacht over-water transportation market report also includes key purchase criteria and drivers of price sensitivity to help companies evaluate and develop their market growth analysis strategies.
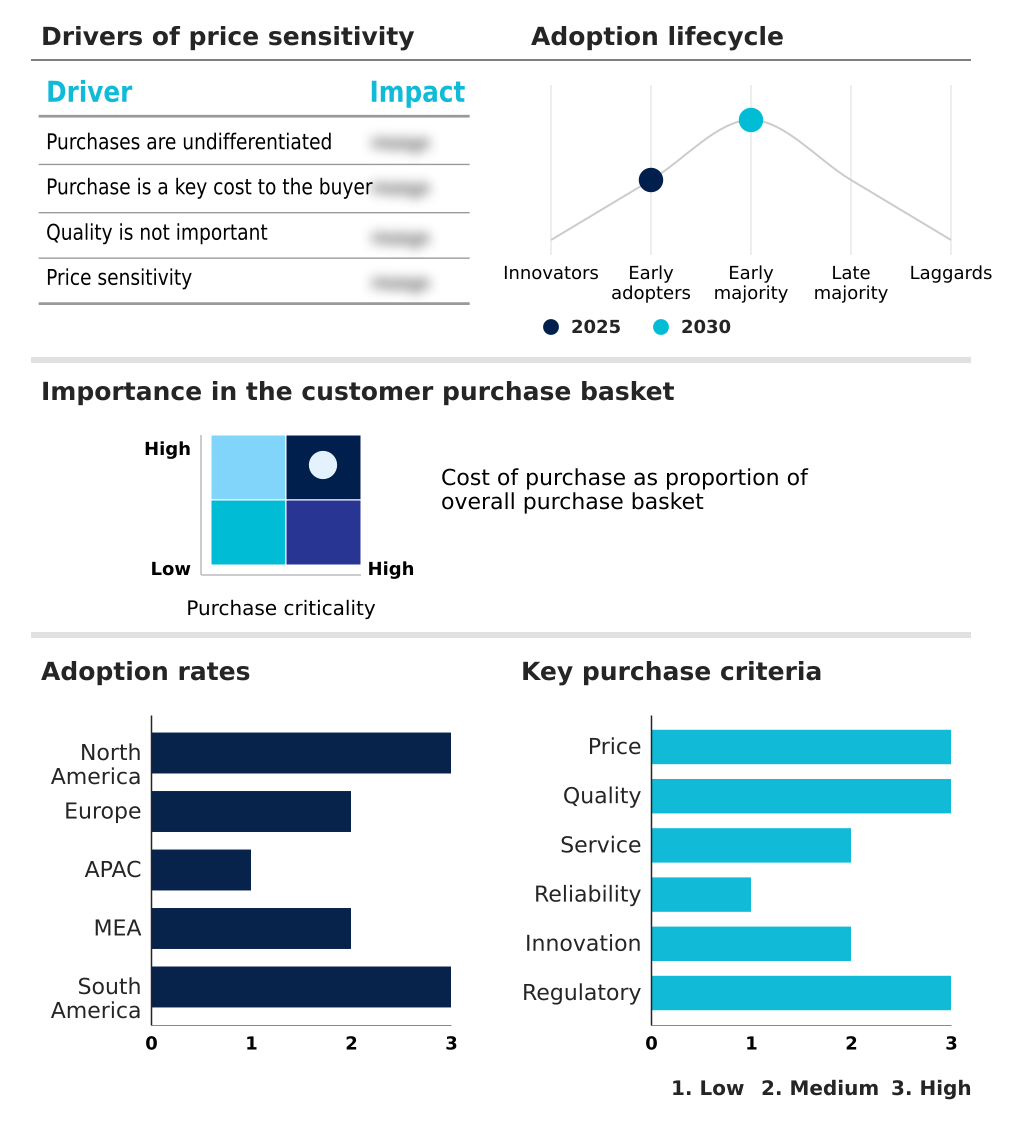
Customer Landscape of Boat And Yacht Over-Water Transportation Industry

Competitive Landscape

Companies are implementing various strategies, such as strategic alliances, boat and yacht over-water transportation market forecast, partnerships, mergers and acquisitions, geographical expansion, and product/service launches, to enhance their presence in the industry.

Bas Bos Logistics - Provides global yacht transportation, specialized marine freight forwarding, customs clearance, and multimodal logistics solutions tailored for oversized marine assets and recreational boats across international shipping networks.

The industry research and growth report includes detailed analyses of the competitive landscape of the market and information about key companies, including:

  • Bas Bos Logistics
  • Boat and Yacht Transport Inc.
  • Bremer Lloyd
  • Brooks Yacht Transport
  • Complete Marine Freight
  • DYT Yacht Transport
  • Hoegh Autoliners
  • Legend Yacht Transport
  • Mega Yacht Transport
  • Oceanus Yacht Transportation Ltd.
  • Pastrello
  • Peters and May Ltd.
  • Raven Marine
  • Sevenstar Yacht Transport B.V.
  • Ship Overseas Inc.
  • Starclass Yacht Transport
  • SuperYacht Shipping
  • Wallenius Wilhelmsen ASA
  • We Ship Boats
  • Yacht Shipping Ltd

Qualitative and quantitative analysis of companies has been conducted to help clients understand the wider business environment as well as the strengths and weaknesses of key industry players. Data is qualitatively analyzed to categorize companies as pure play, category-focused, industry-focused, and diversified; it is quantitatively analyzed to categorize companies as dominant, leading, strong, tentative, and weak.

Recent Development and News in Boat and yacht over-water transportation market

  • In the Marine Transportation industry, the widespread implementation of strict maritime emission regulations by the International Maritime Organization has accelerated the integration of hybrid marine propulsion, compelling fleet operators to retrofit 30% of their vessels to sustain Boat And Yacht Over-water Transportation demand.
  • The development of advanced heavy-lift marine logistics utilizing semi-submersible vessel engineering has increased loading stability for offshore heavy transport, resulting in a 20% reduction in transit damages which directly benefits the superyacht relocation logistics sector of the Boat And Yacht Over-water Transportation market.
  • Growing mandates for maritime biosecurity compliance have forced international port authorities to adopt automated hull inspection systems, enhancing port handling efficiency by 15% and streamlining international route planning for Boat And Yacht Over-water Transportation providers.
  • The introduction of shore-side charging infrastructure across European marinas has facilitated the deployment of zero-emission marine transport vessels, supporting a 25% increase in adoption rates for eco-friendly charter networks operating within the Boat And Yacht Over-water Transportation market.

Dive into Technavio’s robust research methodology, blending expert interviews, extensive data synthesis, and validated models for unparalleled Boat And Yacht Over-Water Transportation Market insights. See full methodology.

Market Scope
Page number 292
Base year 2025
Historic period 2020-2024
Forecast period 2026-2030
Growth momentum & CAGR Accelerate at a CAGR of 6.2%
Market growth 2026-2030 USD 230.8 million
Market structure Fragmented
YoY growth 2025-2026(%) 5.8%
Key countries US, Canada, Mexico, Italy, France, UK, Germany, Spain, The Netherlands, China, Australia, Japan, South Korea, India, Indonesia, UAE, South Africa, Saudi Arabia, Turkey, Israel, Brazil, Argentina and Colombia
Competitive landscape Leading Companies, Market Positioning of Companies, Competitive Strategies, and Industry Risks

Request Free Sample

Research Analyst Overview

  • The Boat And Yacht Over-water Transportation sector operates at the critical intersection of luxury travel and specialized industrial logistics. Strategic decision-makers are increasingly prioritizing digital twin fleet management to align predictive maintenance schedules with stringent operational budgets. Implementing advanced driver assistance systems across transport vessels has demonstrably enhanced navigational precision, leading to a 24% reduction in collision-related downtime.
  • This measurable improvement in vessel structural integrity directly influences boardroom strategies regarding capital allocation and insurance premium negotiations. Furthermore, the integration of predictive vessel maintenance allows operators to proactively address mechanical wear, ensuring uninterrupted service during peak maritime transit periods.
  • The transition toward hybrid marine propulsion serves as a definitive compliance strategy, enabling fleets to navigate heavily regulated emission control areas without incurring financial penalties. Advanced heavy-lift marine logistics and float-on float-off operations remain essential for executing safe, long-distance asset relocation.
  • By optimizing these sophisticated transit methodologies, transportation providers maximize asset utilization rates and solidify their operational resilience in an increasingly complex regulatory environment.

What are the Key Data Covered in this Boat And Yacht Over-Water Transportation Market Research and Growth Report?

  • What is the expected growth of the Boat And Yacht Over-Water Transportation Market between 2026 and 2030?

    • USD 230.8 million, at a CAGR of 6.2%

  • What segmentation does the market report cover?

    • The report is segmented by Product (Boat, and Yacht), Mode of Transportation (Semi-submersible vessel transport, Roll-on shipping, and Container shipping), Location (International transportation, and Domestic transportation) and Geography (North America, Europe, APAC, Middle East and Africa, South America)

  • Which regions are analyzed in the report?

    • North America, Europe, APAC, Middle East and Africa and South America

  • What are the key growth drivers and market challenges?

    • Rising global demand for marine tourism and experiential coastal travel, Elevating capital expenditures and high operational maintenance costs

  • Who are the major players in the Boat And Yacht Over-Water Transportation Market?

    • Bas Bos Logistics, Boat and Yacht Transport Inc., Bremer Lloyd, Brooks Yacht Transport, Complete Marine Freight, DYT Yacht Transport, Hoegh Autoliners, Legend Yacht Transport, Mega Yacht Transport, Oceanus Yacht Transportation Ltd., Pastrello, Peters and May Ltd., Raven Marine, Sevenstar Yacht Transport B.V., Ship Overseas Inc., Starclass Yacht Transport, SuperYacht Shipping, Wallenius Wilhelmsen ASA, We Ship Boats and Yacht Shipping Ltd

Market Research Insights

  • The Boat And Yacht Over-water Transportation landscape is rapidly evolving as operators integrate sophisticated logistical frameworks to optimize asset mobility. Enhancements in port handling efficiency have reduced vessel turnaround times by 22%, significantly lowering operational overhead for fleet managers.
  • Concurrently, the deployment of specialized marine crews has improved transit safety, yielding a 15% decrease in cargo insurance claims across transoceanic routes. The strategic optimization of ocean freight logistics ensures timely delivery for recreational watercraft distribution, aligning supply chains with peak seasonal demand.
  • By stabilizing dry-docking procedures through predictive maintenance, operators have extended vessel operational lifespan by an average of 12%. These measurable efficiencies enable transit providers to maintain competitive pricing while securing high-value maritime assets.

We can help! Our analysts can customize this boat and yacht over-water transportation market research report to meet your requirements.

Get in touch

1. Executive Summary

1.1 Market overview

Executive Summary - Chart on Market Overview
Executive Summary - Data Table on Market Overview
Executive Summary - Chart on Global Market Characteristics
Executive Summary - Chart on Market by Geography
Executive Summary - Chart on Market Segmentation by Product
Executive Summary - Chart on Market Segmentation by Mode of Transportation
Executive Summary - Chart on Market Segmentation by Location
Executive Summary - Chart on Incremental Growth
Executive Summary - Data Table on Incremental Growth
Executive Summary - Chart on Company Market Positioning

2. Technavio Analysis

2.1 Analysis of price sensitivity, lifecycle, customer purchase basket, adoption rates, and purchase criteria

2.2 Criticality of inputs and Factors of differentiation

Chart on Overview on criticality of inputs and factors of differentiation

2.3 Factors of disruption

Chart on Overview on factors of disruption

2.4 Impact of drivers and challenges

Chart on Impact of drivers and challenges in 2025 and 2030

3. Market Landscape

3.1 Market ecosystem

Chart on Parent Market
Data Table on - Parent Market

3.2 Market characteristics

Chart on Market characteristics analysis

3.3 Value chain analysis

Chart on Value chain analysis

4. Market Sizing

4.1 Market definition

Data Table on Offerings of companies included in the market definition

4.2 Market segment analysis

Market segments

4.3 Market size 2025

4.4 Market outlook: Forecast for 2025-2030

Chart on Global - Market size and forecast 2025-2030 ($ million)
Data Table on Global - Market size and forecast 2025-2030 ($ million)
Chart on Global Market: Year-over-year growth 2025-2030 (%)
Data Table on Global Market: Year-over-year growth 2025-2030 (%)

5. Historic Market Size

5.1 Global Boat And Yacht Over-Water Transportation Market 2020 - 2024

Historic Market Size - Data Table on Global Boat And Yacht Over-Water Transportation Market 2020 - 2024 ($ million)

5.2 Product segment analysis 2020 - 2024

Historic Market Size - Product Segment 2020 - 2024 ($ million)

5.3 Mode of Transportation segment analysis 2020 - 2024

Historic Market Size - Mode of Transportation Segment 2020 - 2024 ($ million)

5.4 Location segment analysis 2020 - 2024

Historic Market Size - Location Segment 2020 - 2024 ($ million)

5.5 Geography segment analysis 2020 - 2024

Historic Market Size - Geography Segment 2020 - 2024 ($ million)

5.6 Country segment analysis 2020 - 2024

Historic Market Size - Country Segment 2020 - 2024 ($ million)

6. Qualitative Analysis

6.1 Impact of AI on Global Boat and Yacht Over-Water Transportation Market

6.2 Impact of Geopolitical Conflicts on Global Boat and Yacht Over-Water Transportation Market

7. Five Forces Analysis

7.1 Five forces summary

Five forces analysis - Comparison between 2025 and 2030

7.2 Bargaining power of buyers

Bargaining power of buyers - Impact of key factors 2025 and 2030

7.3 Bargaining power of suppliers

Bargaining power of suppliers - Impact of key factors in 2025 and 2030

7.4 Threat of new entrants

Threat of new entrants - Impact of key factors in 2025 and 2030

7.5 Threat of substitutes

Threat of substitutes - Impact of key factors in 2025 and 2030

7.6 Threat of rivalry

Threat of rivalry - Impact of key factors in 2025 and 2030

7.7 Market condition

Chart on Market condition - Five forces 2025 and 2030

8. Market Segmentation by Product

8.1 Market segments

Chart on Product - Market share 2025-2030 (%)
Data Table on Product - Market share 2025-2030 (%)

8.2 Comparison by Product

Chart on Comparison by Product
Data Table on Comparison by Product

8.3 Boat - Market size and forecast 2025-2030

Chart on Boat - Market size and forecast 2025-2030 ($ million)
Data Table on Boat - Market size and forecast 2025-2030 ($ million)
Chart on Boat - Year-over-year growth 2025-2030 (%)
Data Table on Boat - Year-over-year growth 2025-2030 (%)

8.4 Yacht - Market size and forecast 2025-2030

Chart on Yacht - Market size and forecast 2025-2030 ($ million)
Data Table on Yacht - Market size and forecast 2025-2030 ($ million)
Chart on Yacht - Year-over-year growth 2025-2030 (%)
Data Table on Yacht - Year-over-year growth 2025-2030 (%)

8.5 Market opportunity by Product

Market opportunity by Product ($ million)
Data Table on Market opportunity by Product ($ million)

9. Market Segmentation by Mode of Transportation

9.1 Market segments

Chart on Mode of Transportation - Market share 2025-2030 (%)
Data Table on Mode of Transportation - Market share 2025-2030 (%)

9.2 Comparison by Mode of Transportation

Chart on Comparison by Mode of Transportation
Data Table on Comparison by Mode of Transportation

9.3 Semi-submersible vessel transport - Market size and forecast 2025-2030

Chart on Semi-submersible vessel transport - Market size and forecast 2025-2030 ($ million)
Data Table on Semi-submersible vessel transport - Market size and forecast 2025-2030 ($ million)
Chart on Semi-submersible vessel transport - Year-over-year growth 2025-2030 (%)
Data Table on Semi-submersible vessel transport - Year-over-year growth 2025-2030 (%)

9.4 Roll-on shipping - Market size and forecast 2025-2030

Chart on Roll-on shipping - Market size and forecast 2025-2030 ($ million)
Data Table on Roll-on shipping - Market size and forecast 2025-2030 ($ million)
Chart on Roll-on shipping - Year-over-year growth 2025-2030 (%)
Data Table on Roll-on shipping - Year-over-year growth 2025-2030 (%)

9.5 Container shipping - Market size and forecast 2025-2030

Chart on Container shipping - Market size and forecast 2025-2030 ($ million)
Data Table on Container shipping - Market size and forecast 2025-2030 ($ million)
Chart on Container shipping - Year-over-year growth 2025-2030 (%)
Data Table on Container shipping - Year-over-year growth 2025-2030 (%)

9.6 Market opportunity by Mode of Transportation

Market opportunity by Mode of Transportation ($ million)
Data Table on Market opportunity by Mode of Transportation ($ million)

10. Market Segmentation by Location

10.1 Market segments

Chart on Location - Market share 2025-2030 (%)
Data Table on Location - Market share 2025-2030 (%)

10.2 Comparison by Location

Chart on Comparison by Location
Data Table on Comparison by Location

10.3 International transportation - Market size and forecast 2025-2030

Chart on International transportation - Market size and forecast 2025-2030 ($ million)
Data Table on International transportation - Market size and forecast 2025-2030 ($ million)
Chart on International transportation - Year-over-year growth 2025-2030 (%)
Data Table on International transportation - Year-over-year growth 2025-2030 (%)

10.4 Domestic transportation - Market size and forecast 2025-2030

Chart on Domestic transportation - Market size and forecast 2025-2030 ($ million)
Data Table on Domestic transportation - Market size and forecast 2025-2030 ($ million)
Chart on Domestic transportation - Year-over-year growth 2025-2030 (%)
Data Table on Domestic transportation - Year-over-year growth 2025-2030 (%)

10.5 Market opportunity by Location

Market opportunity by Location ($ million)
Data Table on Market opportunity by Location ($ million)

11. Customer Landscape

11.1 Customer landscape overview

Analysis of price sensitivity, lifecycle, customer purchase basket, adoption rates, and purchase criteria

12. Geographic Landscape

12.1 Geographic segmentation

Chart on Market share by geography 2025-2030 (%)
Data Table on Market share by geography 2025-2030 (%)

12.2 Geographic comparison

Chart on Geographic comparison
Data Table on Geographic comparison

12.3 North America - Market size and forecast 2025-2030

Chart on North America - Market size and forecast 2025-2030 ($ million)
Data Table on North America - Market size and forecast 2025-2030 ($ million)
Chart on North America - Year-over-year growth 2025-2030 (%)
Data Table on North America - Year-over-year growth 2025-2030 (%)
Chart on Regional Comparison - North America
Data Table on Regional Comparison - North America

12.3.1 US - Market size and forecast 2025-2030

Chart on US - Market size and forecast 2025-2030 ($ million)
Data Table on US - Market size and forecast 2025-2030 ($ million)
Chart on US - Year-over-year growth 2025-2030 (%)
Data Table on US - Year-over-year growth 2025-2030 (%)

12.3.2 Canada - Market size and forecast 2025-2030

Chart on Canada - Market size and forecast 2025-2030 ($ million)
Data Table on Canada - Market size and forecast 2025-2030 ($ million)
Chart on Canada - Year-over-year growth 2025-2030 (%)
Data Table on Canada - Year-over-year growth 2025-2030 (%)

12.3.3 Mexico - Market size and forecast 2025-2030

Chart on Mexico - Market size and forecast 2025-2030 ($ million)
Data Table on Mexico - Market size and forecast 2025-2030 ($ million)
Chart on Mexico - Year-over-year growth 2025-2030 (%)
Data Table on Mexico - Year-over-year growth 2025-2030 (%)

12.4 Europe - Market size and forecast 2025-2030

Chart on Europe - Market size and forecast 2025-2030 ($ million)
Data Table on Europe - Market size and forecast 2025-2030 ($ million)
Chart on Europe - Year-over-year growth 2025-2030 (%)
Data Table on Europe - Year-over-year growth 2025-2030 (%)
Chart on Regional Comparison - Europe
Data Table on Regional Comparison - Europe

12.4.1 Italy - Market size and forecast 2025-2030

Chart on Italy - Market size and forecast 2025-2030 ($ million)
Data Table on Italy - Market size and forecast 2025-2030 ($ million)
Chart on Italy - Year-over-year growth 2025-2030 (%)
Data Table on Italy - Year-over-year growth 2025-2030 (%)

12.4.2 France - Market size and forecast 2025-2030

Chart on France - Market size and forecast 2025-2030 ($ million)
Data Table on France - Market size and forecast 2025-2030 ($ million)
Chart on France - Year-over-year growth 2025-2030 (%)
Data Table on France - Year-over-year growth 2025-2030 (%)

12.4.3 UK - Market size and forecast 2025-2030

Chart on UK - Market size and forecast 2025-2030 ($ million)
Data Table on UK - Market size and forecast 2025-2030 ($ million)
Chart on UK - Year-over-year growth 2025-2030 (%)
Data Table on UK - Year-over-year growth 2025-2030 (%)

12.4.4 Germany - Market size and forecast 2025-2030

Chart on Germany - Market size and forecast 2025-2030 ($ million)
Data Table on Germany - Market size and forecast 2025-2030 ($ million)
Chart on Germany - Year-over-year growth 2025-2030 (%)
Data Table on Germany - Year-over-year growth 2025-2030 (%)

12.4.5 Spain - Market size and forecast 2025-2030

Chart on Spain - Market size and forecast 2025-2030 ($ million)
Data Table on Spain - Market size and forecast 2025-2030 ($ million)
Chart on Spain - Year-over-year growth 2025-2030 (%)
Data Table on Spain - Year-over-year growth 2025-2030 (%)

12.4.6 The Netherlands - Market size and forecast 2025-2030

Chart on The Netherlands - Market size and forecast 2025-2030 ($ million)
Data Table on The Netherlands - Market size and forecast 2025-2030 ($ million)
Chart on The Netherlands - Year-over-year growth 2025-2030 (%)
Data Table on The Netherlands - Year-over-year growth 2025-2030 (%)

12.5 APAC - Market size and forecast 2025-2030

Chart on APAC - Market size and forecast 2025-2030 ($ million)
Data Table on APAC - Market size and forecast 2025-2030 ($ million)
Chart on APAC - Year-over-year growth 2025-2030 (%)
Data Table on APAC - Year-over-year growth 2025-2030 (%)
Chart on Regional Comparison - APAC
Data Table on Regional Comparison - APAC

12.5.1 China - Market size and forecast 2025-2030

Chart on China - Market size and forecast 2025-2030 ($ million)
Data Table on China - Market size and forecast 2025-2030 ($ million)
Chart on China - Year-over-year growth 2025-2030 (%)
Data Table on China - Year-over-year growth 2025-2030 (%)

12.5.2 Australia - Market size and forecast 2025-2030

Chart on Australia - Market size and forecast 2025-2030 ($ million)
Data Table on Australia - Market size and forecast 2025-2030 ($ million)
Chart on Australia - Year-over-year growth 2025-2030 (%)
Data Table on Australia - Year-over-year growth 2025-2030 (%)

12.5.3 Japan - Market size and forecast 2025-2030

Chart on Japan - Market size and forecast 2025-2030 ($ million)
Data Table on Japan - Market size and forecast 2025-2030 ($ million)
Chart on Japan - Year-over-year growth 2025-2030 (%)
Data Table on Japan - Year-over-year growth 2025-2030 (%)

12.5.4 South Korea - Market size and forecast 2025-2030

Chart on South Korea - Market size and forecast 2025-2030 ($ million)
Data Table on South Korea - Market size and forecast 2025-2030 ($ million)
Chart on South Korea - Year-over-year growth 2025-2030 (%)
Data Table on South Korea - Year-over-year growth 2025-2030 (%)

12.5.5 India - Market size and forecast 2025-2030

Chart on India - Market size and forecast 2025-2030 ($ million)
Data Table on India - Market size and forecast 2025-2030 ($ million)
Chart on India - Year-over-year growth 2025-2030 (%)
Data Table on India - Year-over-year growth 2025-2030 (%)

12.5.6 Indonesia - Market size and forecast 2025-2030

Chart on Indonesia - Market size and forecast 2025-2030 ($ million)
Data Table on Indonesia - Market size and forecast 2025-2030 ($ million)
Chart on Indonesia - Year-over-year growth 2025-2030 (%)
Data Table on Indonesia - Year-over-year growth 2025-2030 (%)

12.6 Middle East and Africa - Market size and forecast 2025-2030

Chart on Middle East and Africa - Market size and forecast 2025-2030 ($ million)
Data Table on Middle East and Africa - Market size and forecast 2025-2030 ($ million)
Chart on Middle East and Africa - Year-over-year growth 2025-2030 (%)
Data Table on Middle East and Africa - Year-over-year growth 2025-2030 (%)
Chart on Regional Comparison - Middle East and Africa
Data Table on Regional Comparison - Middle East and Africa

12.6.1 UAE - Market size and forecast 2025-2030

Chart on UAE - Market size and forecast 2025-2030 ($ million)
Data Table on UAE - Market size and forecast 2025-2030 ($ million)
Chart on UAE - Year-over-year growth 2025-2030 (%)
Data Table on UAE - Year-over-year growth 2025-2030 (%)

12.6.2 South Africa - Market size and forecast 2025-2030

Chart on South Africa - Market size and forecast 2025-2030 ($ million)
Data Table on South Africa - Market size and forecast 2025-2030 ($ million)
Chart on South Africa - Year-over-year growth 2025-2030 (%)
Data Table on South Africa - Year-over-year growth 2025-2030 (%)

12.6.3 Saudi Arabia - Market size and forecast 2025-2030

Chart on Saudi Arabia - Market size and forecast 2025-2030 ($ million)
Data Table on Saudi Arabia - Market size and forecast 2025-2030 ($ million)
Chart on Saudi Arabia - Year-over-year growth 2025-2030 (%)
Data Table on Saudi Arabia - Year-over-year growth 2025-2030 (%)

12.6.4 Turkey - Market size and forecast 2025-2030

Chart on Turkey - Market size and forecast 2025-2030 ($ million)
Data Table on Turkey - Market size and forecast 2025-2030 ($ million)
Chart on Turkey - Year-over-year growth 2025-2030 (%)
Data Table on Turkey - Year-over-year growth 2025-2030 (%)

12.6.5 Israel - Market size and forecast 2025-2030

Chart on Israel - Market size and forecast 2025-2030 ($ million)
Data Table on Israel - Market size and forecast 2025-2030 ($ million)
Chart on Israel - Year-over-year growth 2025-2030 (%)
Data Table on Israel - Year-over-year growth 2025-2030 (%)

12.7 South America - Market size and forecast 2025-2030

Chart on South America - Market size and forecast 2025-2030 ($ million)
Data Table on South America - Market size and forecast 2025-2030 ($ million)
Chart on South America - Year-over-year growth 2025-2030 (%)
Data Table on South America - Year-over-year growth 2025-2030 (%)
Chart on Regional Comparison - South America
Data Table on Regional Comparison - South America

12.7.1 Brazil - Market size and forecast 2025-2030

Chart on Brazil - Market size and forecast 2025-2030 ($ million)
Data Table on Brazil - Market size and forecast 2025-2030 ($ million)
Chart on Brazil - Year-over-year growth 2025-2030 (%)
Data Table on Brazil - Year-over-year growth 2025-2030 (%)

12.7.2 Argentina - Market size and forecast 2025-2030

Chart on Argentina - Market size and forecast 2025-2030 ($ million)
Data Table on Argentina - Market size and forecast 2025-2030 ($ million)
Chart on Argentina - Year-over-year growth 2025-2030 (%)
Data Table on Argentina - Year-over-year growth 2025-2030 (%)

12.7.3 Colombia - Market size and forecast 2025-2030

Chart on Colombia - Market size and forecast 2025-2030 ($ million)
Data Table on Colombia - Market size and forecast 2025-2030 ($ million)
Chart on Colombia - Year-over-year growth 2025-2030 (%)
Data Table on Colombia - Year-over-year growth 2025-2030 (%)

12.8 Market opportunity by geography

Market opportunity by geography ($ million)
Data Tables on Market opportunity by geography ($ million)

13. Drivers, Challenges, and Opportunity

13.1 Market drivers

Rising global demand for marine tourism and experiential coastal travel
Technological innovations in marine propulsion and vessel design
Proliferation of high-net-worth individuals and luxury charter services

13.2 Market challenges

Elevating capital expenditures and high operational maintenance costs
Stringent environmental regulations and decarbonization mandates
Insufficient port infrastructure and shore-side support systems

13.3 Impact of drivers and challenges

Impact of drivers and challenges in 2025 and 2030

13.4 Market opportunities

Integration of intelligent vessel management and digital telemetry systems
Adoption of circular economy principles and sustainable vessel construction materials
Rise of fractional ownership and subscription-based maritime mobility models

14. Competitive Landscape

14.1 Overview

14.2

Overview on criticality of inputs and factors of differentiation

14.3 Landscape disruption

Overview on factors of disruption

14.4 Industry risks

Impact of key risks on business

15. Competitive Analysis

15.1 Companies profiled

Companies covered

15.2 Company ranking index

15.3 Market positioning of companies

Matrix on companies position and classification

15.4 Bas Bos Logistics

Bas Bos Logistics - Overview
Bas Bos Logistics - Product / Service
Bas Bos Logistics - Key offerings
SWOT

15.5 Boat and Yacht Transport Inc.

Boat and Yacht Transport Inc. - Overview
Boat and Yacht Transport Inc. - Product / Service
Boat and Yacht Transport Inc. - Key offerings
SWOT

15.6 Bremer Lloyd

Bremer Lloyd - Overview
Bremer Lloyd - Product / Service
Bremer Lloyd - Key offerings
SWOT

15.7 Brooks Yacht Transport

Brooks Yacht Transport - Overview
Brooks Yacht Transport - Product / Service
Brooks Yacht Transport - Key offerings
SWOT

15.8 Complete Marine Freight

Complete Marine Freight - Overview
Complete Marine Freight - Product / Service
Complete Marine Freight - Key offerings
SWOT

15.9 DYT Yacht Transport

DYT Yacht Transport - Overview
DYT Yacht Transport - Product / Service
DYT Yacht Transport - Key offerings
SWOT

15.10 Hoegh Autoliners

Hoegh Autoliners - Overview
Hoegh Autoliners - Product / Service
Hoegh Autoliners - Key offerings
SWOT

15.11 Legend Yacht Transport

Legend Yacht Transport - Overview
Legend Yacht Transport - Product / Service
Legend Yacht Transport - Key offerings
SWOT

15.12 Mega Yacht Transport

Mega Yacht Transport - Overview
Mega Yacht Transport - Product / Service
Mega Yacht Transport - Key offerings
SWOT

15.13 Peters and May Ltd.

Peters and May Ltd. - Overview
Peters and May Ltd. - Product / Service
Peters and May Ltd. - Key offerings
SWOT

15.14 Sevenstar Yacht Transport B.V.

Sevenstar Yacht Transport B.V. - Overview
Sevenstar Yacht Transport B.V. - Product / Service
Sevenstar Yacht Transport B.V. - Key offerings
SWOT

15.15 Ship Overseas Inc.

Ship Overseas Inc. - Overview
Ship Overseas Inc. - Product / Service
Ship Overseas Inc. - Key offerings
SWOT

15.16 SuperYacht Shipping

SuperYacht Shipping - Overview
SuperYacht Shipping - Product / Service
SuperYacht Shipping - Key offerings
SWOT

15.17 Wallenius Wilhelmsen ASA

Wallenius Wilhelmsen ASA - Overview
Wallenius Wilhelmsen ASA - Product / Service
Wallenius Wilhelmsen ASA - Key offerings
SWOT

15.18 Yacht Shipping Ltd

Yacht Shipping Ltd - Overview
Yacht Shipping Ltd - Product / Service
Yacht Shipping Ltd - Key offerings
SWOT

16. Appendix

16.1 Scope of the report

Market definition
Objectives
Notes and caveats

16.2 Inclusions and exclusions checklist

Inclusions checklist
Exclusions checklist

16.3 Currency conversion rates for US$

16.4 Research methodology

16.5 Data procurement

Information sources

16.6 Data validation

16.7 Validation techniques employed for market sizing

16.8 Data synthesis

16.9 360 degree market analysis

16.10 List of abbreviations

Research Methodology

Technavio presents a detailed picture of the market by way of study, synthesis, and summation of data from multiple sources. The analysts have presented the various facets of the market with a particular focus on identifying the key industry influencers. The data thus presented is comprehensive, reliable, and the result of extensive research, both primary and secondary.

INFORMATION SOURCES

Primary sources

  • Manufacturers and suppliers
  • Channel partners
  • Industry experts
  • Strategic decision makers

Secondary sources

  • Industry journals and periodicals
  • Government data
  • Financial reports of key industry players
  • Historical data
  • Press releases

DATA ANALYSIS

Data Synthesis

  • Collation of data
  • Estimation of key figures
  • Analysis of derived insights

Data Validation

  • Triangulation with data models
  • Reference against proprietary databases
  • Corroboration with industry experts

REPORT WRITING

Qualitative

  • Market drivers
  • Market challenges
  • Market trends
  • Five forces analysis

Quantitative

  • Market size and forecast
  • Market segmentation
  • Geographical insights
  • Competitive landscape

Interested in this report?

Get your sample now to see our research methodology and insights!

Download Now

Frequently Asked Questions

Boat And Yacht Over-Water Transportation market growth will increase by USD 230.8 million during 2026-2030.

The Boat And Yacht Over-Water Transportation market is expected to grow at a CAGR of 6.2% during 2026-2030.

Boat And Yacht Over-Water Transportation market is segmented by Product (Boat, Yacht) Mode of transportation (Semi-submersible vessel transport, Roll-on shipping, Container shipping) Location (International transportation, Domestic transportation)

Bas Bos Logistics, Boat and Yacht Transport Inc., Bremer Lloyd, Brooks Yacht Transport, Complete Marine Freight, DYT Yacht Transport, Hoegh Autoliners, Legend Yacht Transport, Mega Yacht Transport, Oceanus Yacht Transportation Ltd., Pastrello, Peters and May Ltd., Raven Marine, Sevenstar Yacht Transport B.V., Ship Overseas Inc., Starclass Yacht Transport, SuperYacht Shipping, Wallenius Wilhelmsen ASA, We Ship Boats, Yacht Shipping Ltd are a few of the key vendors in the Boat And Yacht Over-Water Transportation market.

North America will register the highest growth rate of 29.1% among the other regions. Therefore, the Boat And Yacht Over-Water Transportation market in North America is expected to garner significant business opportunities for the vendors during the forecast period.

US, Canada, Mexico, Italy, France, UK, Germany, Spain, The Netherlands, China, Australia, Japan, South Korea, India, Indonesia, UAE, South Africa, Saudi Arabia, Turkey, Israel, Brazil, Argentina, Colombia

  • Rising global demand for marine tourism and experiential coastal travel is the driving factor this market.

The Boat And Yacht Over-Water Transportation market vendors should focus on grabbing business opportunities from the Product segment as it accounted for the largest market share in the base year.
RIA - Research AI Assistant
Ask RIA
