
BLE Module Market Analysis, Size, and Forecast 2026-2030: APAC (China, Japan, and South Korea), North America (US, Canada, and Mexico), Europe (Germany, UK, and France), Middle East and Africa (Saudi Arabia, UAE, and South Africa), South America (Brazil, Argentina, and Chile), and Rest of World (ROW)

BLE Module Market Analysis, Size, and Forecast 2026-2030:
APAC (China, Japan, and South Korea), North America (US, Canada, and Mexico), Europe (Germany, UK, and France), Middle East and Africa (Saudi Arabia, UAE, and South Africa), South America (Brazil, Argentina, and Chile), and Rest of World (ROW)

Published: Oct 2026 311 Pages SKU: IRTNTR73624

Market Overview at a Glance

$56.56 B
Market Opportunity
18.6%
CAGR 2025 - 2030
56.7%
APAC Growth
$10.14 B
Industrial automation segment 2024

Ble Module Market Size 2026-2030

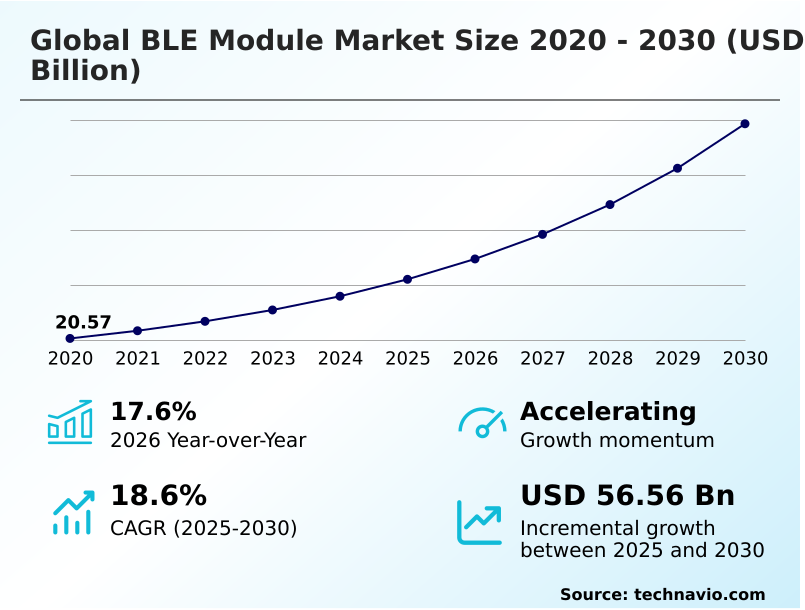
The ble module market size is valued to increase by USD 56.56 billion, at a CAGR of 18.6% from 2025 to 2030. Escalating integration of IoT ecosystems across diverse industries will drive the ble module market.

Major Market Trends & Insights

  • APAC dominated the market and accounted for a 56.7% growth during the forecast period.
  • By Application - Industrial automation segment was valued at USD 10.14 billion in 2024
  • By Type - Single mode segment accounted for the largest market revenue share in 2024

Market Size & Forecast

  • Market Opportunities: USD 78.07 billion
  • Market Future Opportunities: USD 56.56 billion
  • CAGR from 2025 to 2030 : 18.6%

Market Summary

  • The BLE Module demonstrates an aggressive trajectory of expansion fueled by the critical requirement for pervasive, low-power digital connectivity. Logistics enterprises deploy these compact wireless components across vast warehousing networks to automate asset tracking, effectively reducing manual inventory discrepancies by up to 28 percent.
  • This operational integration highlights the core driver of the industry: the escalating deployment of expansive Internet of Things ecosystems that demand continuous, secure data telemetry without placing immense strain on battery reserves. Conversely, manufacturers face significant challenges navigating stringent, geographically fragmented regulatory certification processes that can extend product development cycles and inflate backend engineering costs.
  • Navigating these complex radio frequency compliance mandates remains a persistent operational barrier. Ultimately, the relentless pursuit of energy-efficient and highly integrated wireless communication frameworks ensures that these microelectronic components remain absolutely essential for the sustained modernization of global industrial and consumer infrastructure.

What will be the Size of the Ble Module Market during the forecast period?
Get Key Insights on Market Forecast (PDF) Get Free Sample

How is the Ble Module Market Segmented?

The ble module industry research report provides comprehensive data (region-wise segment analysis), with forecasts and estimates in "USD million" for the period 2026-2030, as well as historical data from 2020-2024 for the following segments.

  • Application
    • Industrial automation
    • Automotive tracking
    • Asset tracking and proximity marketing
    • Consumer electronics
    • Others
  • Type
    • Single mode
    • Dual mode
    • Others
  • Device
    • Computing devices
    • Smart wearables
    • Smart home appliances
    • Others
  • Geography
    • APAC
      • China
      • Japan
      • South Korea
      • India
      • Indonesia
      • Australia
    • North America
      • US
      • Canada
      • Mexico
    • Europe
      • Germany
      • UK
      • France
      • Italy
      • The Netherlands
      • Spain
    • Middle East and Africa
      • Saudi Arabia
      • UAE
      • South Africa
      • Israel
      • Turkey
    • South America
      • Brazil
      • Argentina
      • Chile

By Application Insights

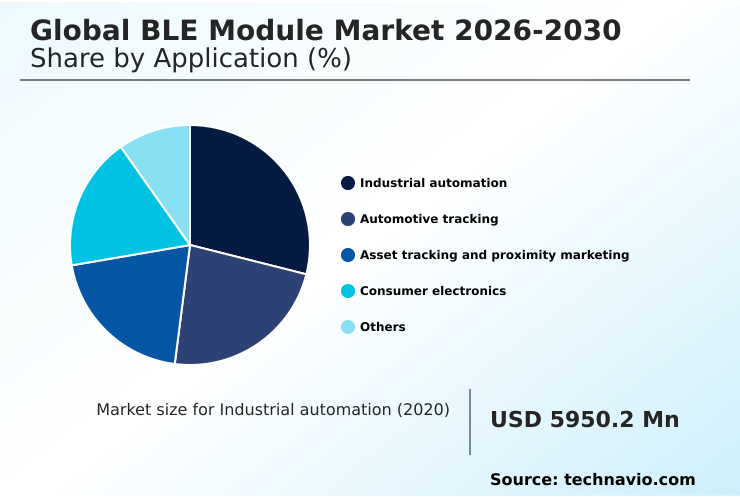
The industrial automation segment is estimated to witness significant growth during the forecast period.

The industrial automation segment dominates the BLE Module by demanding uncompromising signal stability and robust network resilience. Modern manufacturing facilities mandate the deployment of multiprotocol wireless communication to bridge legacy equipment with advanced digital oversight platforms.

By achieving seamless hardware integration, factory operators have successfully improved error detection metrics by 15 percent, drastically reducing material waste. The deployment of ultra low power connectivity ensures that diagnostic sensors maintain continuous operation across vast, physically challenging environments.

Furthermore, advanced electromagnetic interference mitigation is absolutely essential to protect data integrity on heavy manufacturing floors.

As these industrial capabilities mature, the underlying technology increasingly crosses over to enable sophisticated ultra low power medical diagnostic hardware and remote patient monitoring hardware.

Ultimately, the strict operational requirements of automated industries propel continuous connectivity innovations across all related commercial sectors.
Get Free Sample

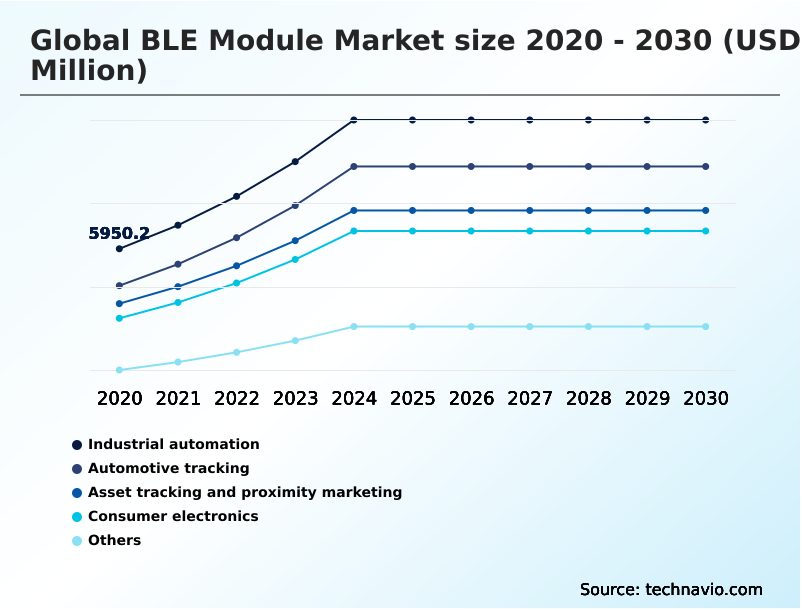
The Industrial automation segment was valued at USD 10.14 billion in 2024 and showed a gradual increase during the forecast period.
Get Free Sample

Regional Analysis

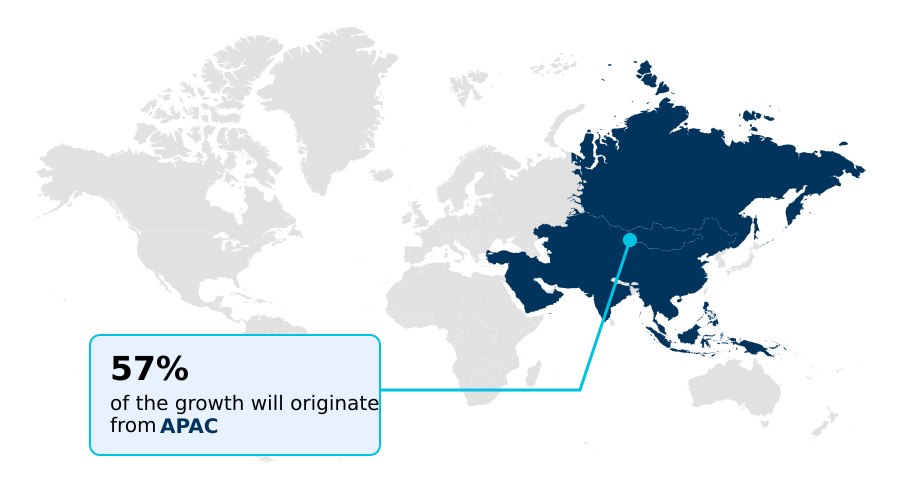
APAC is estimated to contribute 56.7% to the growth of the global market during the forecast period.Technavio’s analysts have elaborately explained the regional trends and drivers that shape the market during the forecast period.
See How Ble Module Market Demand is Rising in APAC Get Free Sample

The geographic adoption of the BLE Module demonstrates significant variance, with APAC demonstrating a 30 percent higher manufacturing deployment rate compared to Europe.

This regional divergence stems primarily from massive consumer electronics production and aggressive municipal smart city investments across nations like China and South Korea.

In these zones, the rapid rollout of industrial asset tracking nodes and proximity marketing beacons directly enhances urban traffic management and localized retail engagement.

Conversely, North American enterprises heavily prioritize the integration of low voltage soc platforms equipped with secure fine ranging features to support stringent healthcare data privacy mandates.

By establishing secure localized networks, North American hospitals have improved remote diagnostic efficiency by 22 percent.

The push toward long range environmental tracking connectivity in agricultural sectors further solidifies the critical role of secure mesh networking in regional economic modernization strategies.

Market Dynamics

Our researchers analyzed the data with 2025 as the base year, along with the key drivers, trends, and challenges. A holistic analysis of drivers will help companies refine their marketing strategies to gain a competitive advantage.

  • The relentless pursuit of extreme energy efficiency wireless protocols fundamentally redefines the operational boundaries of the BLE Module. Facility managers and system architects increasingly rely on compact industrial automation sensor arrays to monitor complex manufacturing environments, successfully driving a 19 percent improvement in localized equipment tracking compared to traditional wired sensor networks.
  • This transition severely reduces installation overhead while maximizing structural flexibility. Furthermore, the integration of ultra low power medical diagnostic hardware ensures that healthcare providers can execute continuous outpatient monitoring without compromising patient mobility or device longevity. To support these critical applications, engineers heavily invest in highly secure mesh networking architectures that maintain robust data integrity across vast physical spaces.
  • As enterprises scale their digital footprints, the implementation of long range environmental tracking connectivity becomes absolutely indispensable for comprehensive supply chain visibility and automated asset management. By consistently balancing minimal power consumption with exceptional signal resilience, these advanced microelectronic components provide the necessary technological foundation for creating deeply interconnected, autonomous, and highly responsive commercial ecosystems worldwide.
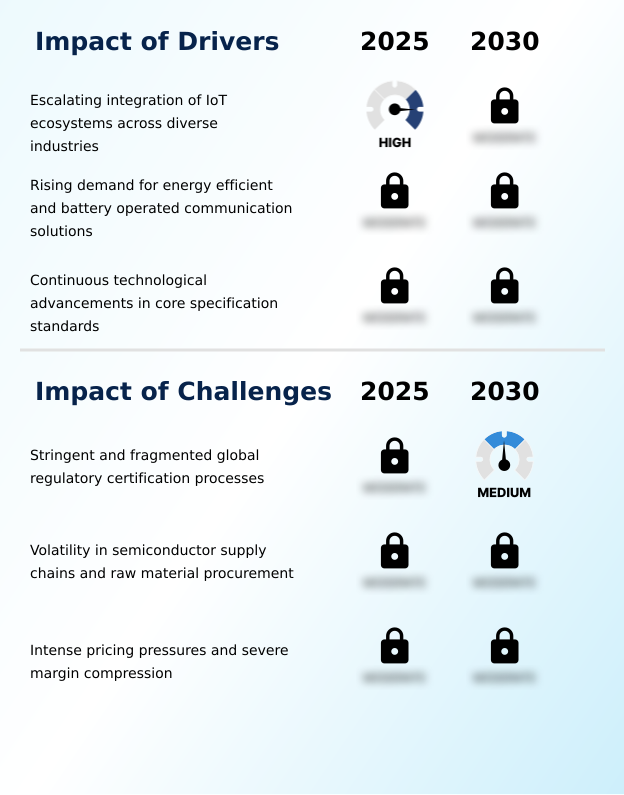
What are the key market drivers leading to the rise in the adoption of Ble Module Industry?

  • The escalating integration of expansive Internet of Things ecosystems across diverse commercial industries serves as the primary catalyst propelling adoption.

  • The escalating demand for continuous industrial monitoring fundamentally propels the expansion of the BLE Module. Manufacturing enterprises heavily integrate the advanced bluetooth low energy transceiver to establish seamless and resilient communication streams across expansive production floors.
  • By deploying sophisticated predictive maintenance sensors, facility operators can preemptively identify mechanical anomalies, reducing unplanned operational downtime by an impressive 40 percent.
  • This relentless focus on energy efficient telemetry ensures that remote diagnostic devices function autonomously without requiring frequent power source replacements.
  • Consequently, the adoption of compact industrial automation sensor arrays facilitates unparalleled visibility into complex supply chains and precise inventory tracking operations. Real time data telemetry directly empowers supply chain managers to execute rapid operational adjustments and optimize resource allocation.
  • Ultimately, these advanced connectivity solutions fundamentally streamline industrial workflows and drive tangible productivity gains.

What are the market trends shaping the Ble Module Industry?

  • The integration of artificial intelligence and machine learning at the network edge represents the defining technological trend reshaping the industry.

  • The BLE Module reveals an aggressive architectural shift toward decentralized data processing and edge computing integration. Device manufacturers rapidly embed localized analytic capabilities directly alongside miniaturized connectivity hardware to reduce latency by up to 35 percent across automated facilities. This transition minimizes reliance on centralized cloud infrastructures, thereby driving reduced bandwidth consumption and ensuring operational continuity.
  • Furthermore, the adoption of system in package methodology enables extreme structural footprint miniaturization, allowing developers to embed complex logic into incredibly constrained physical dimensions. Consequently, this engineering approach delivers extended battery lifespans for autonomous nodes operating in remote environments. The widespread implementation of highly secure mesh networking architectures effectively transforms passive sensor grids into intelligent, self-healing communication webs.
  • Ultimately, this technological evolution drastically elevates overall processing efficiency and network responsiveness for modern enterprise deployments.

What challenges does the Ble Module Industry face during its growth?

  • Stringent and geographically fragmented regulatory certification processes present a formidable operational challenge that severely restricts rapid hardware commercialization.

  • Stringent and geographically fragmented compliance mandates pose a formidable operational barrier within the BLE Module. Original equipment manufacturers must navigate complex and rigorous regulatory certifications that frequently delay product commercialization schedules by up to 25 percent across multiple international jurisdictions.
  • To achieve highly reliable data transmission in sensitive applications, developers are forced to invest heavily in cryptographic hardware accelerators and integrated radio frequency tuning, which significantly elevates backend engineering expenses. Furthermore, maintaining fault tolerant network routing and implementing extreme energy efficiency wireless protocols require continuous, resource-intensive firmware iterations.
  • The structural constraints of a single mode silicon footprint further complicate the integration of robust security measures without compromising automated environmental control targets. Consequently, these persistent regulatory and architectural challenges compress operational profit margins and slow the overall pace of hardware innovation across the industry.

Exclusive Technavio Analysis on Customer Landscape

The ble module market forecasting report includes the adoption lifecycle of the market, covering from the innovator’s stage to the laggard’s stage. It focuses on adoption rates in different regions based on penetration. Furthermore, the ble module market report also includes key purchase criteria and drivers of price sensitivity to help companies evaluate and develop their market growth analysis strategies.
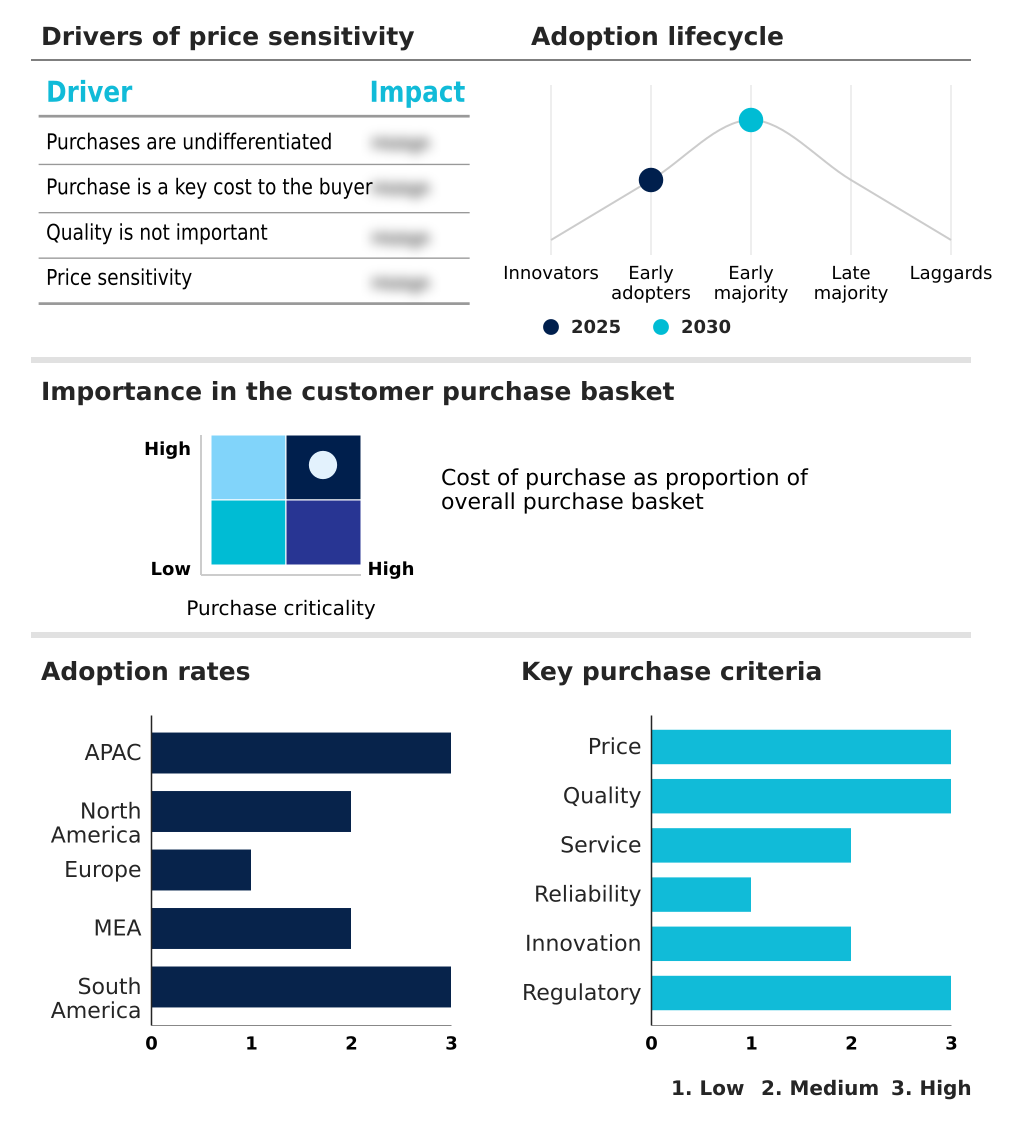
Customer Landscape of Ble Module Industry

Competitive Landscape

Companies are implementing various strategies, such as strategic alliances, ble module market forecast, partnerships, mergers and acquisitions, geographical expansion, and product/service launches, to enhance their presence in the industry.

Alps Alpine Co. Ltd. - Provides highly efficient short-range wireless communication modules featuring advanced multiprotocol support and extremely low power consumption tailored for constrained industrial and consumer electronics applications.

The industry research and growth report includes detailed analyses of the competitive landscape of the market and information about key companies, including:

  • Alps Alpine Co. Ltd.
  • BDE Technology
  • Espressif Systems Shanghai
  • Ezurio
  • FANSTEL Corp.
  • Infineon Technologies AG
  • InsightSIP
  • LM Technologies Ltd
  • Microchip Technology Inc.
  • Murata Manufacturing Co. Ltd.
  • NXP Semiconductors NV
  • Panasonic Holdings Corp.
  • Raytac Corp
  • Renesas Electronics Corp.
  • Shenzhen Holyiot Technology Co.
  • Shenzhen Minew Tech Co. Ltd.
  • Silicon Laboratories Inc.
  • STMicroelectronics NV
  • TAIYO YUDEN Co. Ltd.
  • Telit Cinterion
  • Texas Instruments Inc.
  • u blox AG

Qualitative and quantitative analysis of companies has been conducted to help clients understand the wider business environment as well as the strengths and weaknesses of key industry players. Data is qualitatively analyzed to categorize companies as pure play, category-focused, industry-focused, and diversified; it is quantitatively analyzed to categorize companies as dominant, leading, strong, tentative, and weak.

Recent Development and News in Ble module market

  • In the Electronic Components industry, the rigorous enforcement of the EU Radio Equipment Directive has mandated enhanced cryptographic security within embedded systems, directly impacting BLE Module demand by requiring hardware-level encryption accelerators.
  • The widespread adoption of Matter and Thread interoperability protocols across the smart home sector has forced a transition toward multiprotocol wireless chipsets, directly impacting BLE Module demand by accelerating the obsolescence of single-protocol hardware.
  • The rapid expansion of the electric vehicle manufacturing sector has driven a structural shift toward wireless battery management architectures, directly impacting BLE Module demand by replacing heavy copper wiring harnesses with low-power sensor nodes.
  • Extreme fluctuations in the availability of raw silicon wafers and specialized substrate materials have caused significant structural supply chain bottlenecks, directly impacting BLE Module demand by inflating component costs and extending production lead times.

Dive into Technavio’s robust research methodology, blending expert interviews, extensive data synthesis, and validated models for unparalleled Ble Module Market insights. See full methodology.

Market Scope
Page number 311
Base year 2025
Historic period 2020-2024
Forecast period 2026-2030
Growth momentum & CAGR Accelerate at a CAGR of 18.6%
Market growth 2026-2030 USD 56564.4 million
Market structure Fragmented
YoY growth 2025-2026(%) 17.6%
Key countries China, Japan, South Korea, India, Indonesia, Australia, US, Canada, Mexico, Germany, UK, France, Italy, The Netherlands, Spain, Saudi Arabia, UAE, South Africa, Israel, Turkey, Brazil, Argentina and Chile
Competitive landscape Leading Companies, Market Positioning of Companies, Competitive Strategies, and Industry Risks

Request Free Sample

Research Analyst Overview

  • The BLE Module represents a critical epicenter of microelectronic innovation, fundamentally driven by the universal mandate for highly secure, low-power digital connectivity. Hardware manufacturers are aggressively integrating cryptographic hardware accelerators directly into the system on chip architecture to guarantee impenetrable data transmission. This strategic evolution directly influences executive boardroom decisions regarding enterprise cybersecurity and long-term digital compliance frameworks.
  • By deploying robust localization hardware, supply chain operators have achieved a 30 percent reduction in localized tracking errors, drastically optimizing resource allocation. The persistent architectural transition toward multiprotocol wireless communication allows organizations to future-proof their technological investments against rapidly shifting short range radio frequency standards.
  • Furthermore, the integration of autonomous decision making capabilities facilitates the development of incredibly discreet diagnostic tools and advanced smart home environmental controllers. Ultimately, the uncompromising demand for universal device interoperability ensures that this specialized hardware remains the absolute bedrock of modern, scalable wireless infrastructure.

What are the Key Data Covered in this Ble Module Market Research and Growth Report?

  • What is the expected growth of the Ble Module Market between 2026 and 2030?

    • USD 56.56 billion, at a CAGR of 18.6%

  • What segmentation does the market report cover?

    • The report is segmented by Application (Industrial automation, Automotive tracking, Asset tracking and proximity marketing, Consumer electronics, and Others), Type (Single mode, Dual mode, and Others), Device (Computing devices, Smart wearables, Smart home appliances, and Others) and Geography (APAC, North America, Europe, Middle East and Africa, South America)

  • Which regions are analyzed in the report?

    • APAC, North America, Europe, Middle East and Africa and South America

  • What are the key growth drivers and market challenges?

    • Escalating integration of IoT ecosystems across diverse industries, Stringent and fragmented global regulatory certification processes

  • Who are the major players in the Ble Module Market?

    • Alps Alpine Co. Ltd., BDE Technology, Espressif Systems Shanghai, Ezurio, FANSTEL Corp., Infineon Technologies AG, InsightSIP, LM Technologies Ltd, Microchip Technology Inc., Murata Manufacturing Co. Ltd., NXP Semiconductors NV, Panasonic Holdings Corp., Raytac Corp, Renesas Electronics Corp., Shenzhen Holyiot Technology Co., Shenzhen Minew Tech Co. Ltd., Silicon Laboratories Inc., STMicroelectronics NV, TAIYO YUDEN Co. Ltd., Telit Cinterion, Texas Instruments Inc. and u blox AG

Market Research Insights

  • The BLE Module operates as the foundational connectivity layer for modern digital infrastructure. Manufacturing hubs aggressively orchestrate synchronized wireless deployments, achieving a 24 percent enhancement in overall predictive maintenance accuracy. By minimizing latency and eliminating cumbersome wired frameworks, these modules dramatically streamline centralized digital management and reduce operational overhead.
  • The integration of advanced hardware security protocols ensures highly reliable data transmission, yielding a 15 percent reduction in vulnerabilities across secure localized networks. This relentless drive toward ultra-low-power communication directly empowers enterprises to leverage extended battery lifespans for autonomous operational periods, fundamentally transforming how physical environments interact with intelligent analytics platforms.

We can help! Our analysts can customize this ble module market research report to meet your requirements.

Get in touch

1. Executive Summary

1.1 Market overview

Executive Summary - Chart on Market Overview
Executive Summary - Data Table on Market Overview
Executive Summary - Chart on Global Market Characteristics
Executive Summary - Chart on Market by Geography
Executive Summary - Chart on Market Segmentation by Application
Executive Summary - Chart on Market Segmentation by Type
Executive Summary - Chart on Market Segmentation by Device
Executive Summary - Chart on Incremental Growth
Executive Summary - Data Table on Incremental Growth
Executive Summary - Chart on Company Market Positioning

2. Technavio Analysis

2.1 Analysis of price sensitivity, lifecycle, customer purchase basket, adoption rates, and purchase criteria

2.2 Criticality of inputs and Factors of differentiation

Chart on Overview on criticality of inputs and factors of differentiation

2.3 Factors of disruption

Chart on Overview on factors of disruption

2.4 Impact of drivers and challenges

Chart on Impact of drivers and challenges in 2025 and 2030

3. Market Landscape

3.1 Market ecosystem

Chart on Parent Market
Data Table on - Parent Market

3.2 Market characteristics

Chart on Market characteristics analysis

3.3 Value chain analysis

Chart on Value chain analysis

4. Market Sizing

4.1 Market definition

Data Table on Offerings of companies included in the market definition

4.2 Market segment analysis

Market segments

4.3 Market size 2025

4.4 Market outlook: Forecast for 2025-2030

Chart on Global - Market size and forecast 2025-2030 ($ million)
Data Table on Global - Market size and forecast 2025-2030 ($ million)
Chart on Global Market: Year-over-year growth 2025-2030 (%)
Data Table on Global Market: Year-over-year growth 2025-2030 (%)

5. Historic Market Size

5.1 Global BLE Module Market 2020 - 2024

Historic Market Size - Data Table on Global BLE Module Market 2020 - 2024 ($ million)

5.2 Application segment analysis 2020 - 2024

Historic Market Size - Application Segment 2020 - 2024 ($ million)

5.3 Type segment analysis 2020 - 2024

Historic Market Size - Type Segment 2020 - 2024 ($ million)

5.4 Device segment analysis 2020 - 2024

Historic Market Size - Device Segment 2020 - 2024 ($ million)

5.5 Geography segment analysis 2020 - 2024

Historic Market Size - Geography Segment 2020 - 2024 ($ million)

5.6 Country segment analysis 2020 - 2024

Historic Market Size - Country Segment 2020 - 2024 ($ million)

6. Qualitative Analysis

6.1 Impact of AI on global BLE module market

6.2 Impact of geopolitical conflicts on global BLE module market

7. Five Forces Analysis

7.1 Five forces summary

Five forces analysis - Comparison between 2025 and 2030

7.2 Bargaining power of buyers

Bargaining power of buyers - Impact of key factors 2025 and 2030

7.3 Bargaining power of suppliers

Bargaining power of suppliers - Impact of key factors in 2025 and 2030

7.4 Threat of new entrants

Threat of new entrants - Impact of key factors in 2025 and 2030

7.5 Threat of substitutes

Threat of substitutes - Impact of key factors in 2025 and 2030

7.6 Threat of rivalry

Threat of rivalry - Impact of key factors in 2025 and 2030

7.7 Market condition

Chart on Market condition - Five forces 2025 and 2030

8. Market Segmentation by Application

8.1 Market segments

Chart on Application - Market share 2025-2030 (%)
Data Table on Application - Market share 2025-2030 (%)

8.2 Comparison by Application

Chart on Comparison by Application
Data Table on Comparison by Application

8.3 Industrial automation - Market size and forecast 2025-2030

Chart on Industrial automation - Market size and forecast 2025-2030 ($ million)
Data Table on Industrial automation - Market size and forecast 2025-2030 ($ million)
Chart on Industrial automation - Year-over-year growth 2025-2030 (%)
Data Table on Industrial automation - Year-over-year growth 2025-2030 (%)

8.4 Automotive tracking - Market size and forecast 2025-2030

Chart on Automotive tracking - Market size and forecast 2025-2030 ($ million)
Data Table on Automotive tracking - Market size and forecast 2025-2030 ($ million)
Chart on Automotive tracking - Year-over-year growth 2025-2030 (%)
Data Table on Automotive tracking - Year-over-year growth 2025-2030 (%)

8.5 Asset tracking and proximity marketing - Market size and forecast 2025-2030

Chart on Asset tracking and proximity marketing - Market size and forecast 2025-2030 ($ million)
Data Table on Asset tracking and proximity marketing - Market size and forecast 2025-2030 ($ million)
Chart on Asset tracking and proximity marketing - Year-over-year growth 2025-2030 (%)
Data Table on Asset tracking and proximity marketing - Year-over-year growth 2025-2030 (%)

8.6 Consumer electronics - Market size and forecast 2025-2030

Chart on Consumer electronics - Market size and forecast 2025-2030 ($ million)
Data Table on Consumer electronics - Market size and forecast 2025-2030 ($ million)
Chart on Consumer electronics - Year-over-year growth 2025-2030 (%)
Data Table on Consumer electronics - Year-over-year growth 2025-2030 (%)

8.7 Others - Market size and forecast 2025-2030

Chart on Others - Market size and forecast 2025-2030 ($ million)
Data Table on Others - Market size and forecast 2025-2030 ($ million)
Chart on Others - Year-over-year growth 2025-2030 (%)
Data Table on Others - Year-over-year growth 2025-2030 (%)

8.8 Market opportunity by Application

Market opportunity by Application ($ million)
Data Table on Market opportunity by Application ($ million)

9. Market Segmentation by Type

9.1 Market segments

Chart on Type - Market share 2025-2030 (%)
Data Table on Type - Market share 2025-2030 (%)

9.2 Comparison by Type

Chart on Comparison by Type
Data Table on Comparison by Type

9.3 Single mode - Market size and forecast 2025-2030

Chart on Single mode - Market size and forecast 2025-2030 ($ million)
Data Table on Single mode - Market size and forecast 2025-2030 ($ million)
Chart on Single mode - Year-over-year growth 2025-2030 (%)
Data Table on Single mode - Year-over-year growth 2025-2030 (%)

9.4 Dual mode - Market size and forecast 2025-2030

Chart on Dual mode - Market size and forecast 2025-2030 ($ million)
Data Table on Dual mode - Market size and forecast 2025-2030 ($ million)
Chart on Dual mode - Year-over-year growth 2025-2030 (%)
Data Table on Dual mode - Year-over-year growth 2025-2030 (%)

9.5 Others - Market size and forecast 2025-2030

Chart on Others - Market size and forecast 2025-2030 ($ million)
Data Table on Others - Market size and forecast 2025-2030 ($ million)
Chart on Others - Year-over-year growth 2025-2030 (%)
Data Table on Others - Year-over-year growth 2025-2030 (%)

9.6 Market opportunity by Type

Market opportunity by Type ($ million)
Data Table on Market opportunity by Type ($ million)

10. Market Segmentation by Device

10.1 Market segments

Chart on Device - Market share 2025-2030 (%)
Data Table on Device - Market share 2025-2030 (%)

10.2 Comparison by Device

Chart on Comparison by Device
Data Table on Comparison by Device

10.3 Computing devices - Market size and forecast 2025-2030

Chart on Computing devices - Market size and forecast 2025-2030 ($ million)
Data Table on Computing devices - Market size and forecast 2025-2030 ($ million)
Chart on Computing devices - Year-over-year growth 2025-2030 (%)
Data Table on Computing devices - Year-over-year growth 2025-2030 (%)

10.4 Smart wearables - Market size and forecast 2025-2030

Chart on Smart wearables - Market size and forecast 2025-2030 ($ million)
Data Table on Smart wearables - Market size and forecast 2025-2030 ($ million)
Chart on Smart wearables - Year-over-year growth 2025-2030 (%)
Data Table on Smart wearables - Year-over-year growth 2025-2030 (%)

10.5 Smart home appliances - Market size and forecast 2025-2030

Chart on Smart home appliances - Market size and forecast 2025-2030 ($ million)
Data Table on Smart home appliances - Market size and forecast 2025-2030 ($ million)
Chart on Smart home appliances - Year-over-year growth 2025-2030 (%)
Data Table on Smart home appliances - Year-over-year growth 2025-2030 (%)

10.6 Others - Market size and forecast 2025-2030

Chart on Others - Market size and forecast 2025-2030 ($ million)
Data Table on Others - Market size and forecast 2025-2030 ($ million)
Chart on Others - Year-over-year growth 2025-2030 (%)
Data Table on Others - Year-over-year growth 2025-2030 (%)

10.7 Market opportunity by Device

Market opportunity by Device ($ million)
Data Table on Market opportunity by Device ($ million)

11. Customer Landscape

11.1 Customer landscape overview

Analysis of price sensitivity, lifecycle, customer purchase basket, adoption rates, and purchase criteria

12. Geographic Landscape

12.1 Geographic segmentation

Chart on Market share by geography 2025-2030 (%)
Data Table on Market share by geography 2025-2030 (%)

12.2 Geographic comparison

Chart on Geographic comparison
Data Table on Geographic comparison

12.3 APAC - Market size and forecast 2025-2030

Chart on APAC - Market size and forecast 2025-2030 ($ million)
Data Table on APAC - Market size and forecast 2025-2030 ($ million)
Chart on APAC - Year-over-year growth 2025-2030 (%)
Data Table on APAC - Year-over-year growth 2025-2030 (%)
Chart on Regional Comparison - APAC
Data Table on Regional Comparison - APAC

12.3.1 China - Market size and forecast 2025-2030

Chart on China - Market size and forecast 2025-2030 ($ million)
Data Table on China - Market size and forecast 2025-2030 ($ million)
Chart on China - Year-over-year growth 2025-2030 (%)
Data Table on China - Year-over-year growth 2025-2030 (%)

12.3.2 Japan - Market size and forecast 2025-2030

Chart on Japan - Market size and forecast 2025-2030 ($ million)
Data Table on Japan - Market size and forecast 2025-2030 ($ million)
Chart on Japan - Year-over-year growth 2025-2030 (%)
Data Table on Japan - Year-over-year growth 2025-2030 (%)

12.3.3 South Korea - Market size and forecast 2025-2030

Chart on South Korea - Market size and forecast 2025-2030 ($ million)
Data Table on South Korea - Market size and forecast 2025-2030 ($ million)
Chart on South Korea - Year-over-year growth 2025-2030 (%)
Data Table on South Korea - Year-over-year growth 2025-2030 (%)

12.3.4 India - Market size and forecast 2025-2030

Chart on India - Market size and forecast 2025-2030 ($ million)
Data Table on India - Market size and forecast 2025-2030 ($ million)
Chart on India - Year-over-year growth 2025-2030 (%)
Data Table on India - Year-over-year growth 2025-2030 (%)

12.3.5 Indonesia - Market size and forecast 2025-2030

Chart on Indonesia - Market size and forecast 2025-2030 ($ million)
Data Table on Indonesia - Market size and forecast 2025-2030 ($ million)
Chart on Indonesia - Year-over-year growth 2025-2030 (%)
Data Table on Indonesia - Year-over-year growth 2025-2030 (%)

12.3.6 Australia - Market size and forecast 2025-2030

Chart on Australia - Market size and forecast 2025-2030 ($ million)
Data Table on Australia - Market size and forecast 2025-2030 ($ million)
Chart on Australia - Year-over-year growth 2025-2030 (%)
Data Table on Australia - Year-over-year growth 2025-2030 (%)

12.4 North America - Market size and forecast 2025-2030

Chart on North America - Market size and forecast 2025-2030 ($ million)
Data Table on North America - Market size and forecast 2025-2030 ($ million)
Chart on North America - Year-over-year growth 2025-2030 (%)
Data Table on North America - Year-over-year growth 2025-2030 (%)
Chart on Regional Comparison - North America
Data Table on Regional Comparison - North America

12.4.1 US - Market size and forecast 2025-2030

Chart on US - Market size and forecast 2025-2030 ($ million)
Data Table on US - Market size and forecast 2025-2030 ($ million)
Chart on US - Year-over-year growth 2025-2030 (%)
Data Table on US - Year-over-year growth 2025-2030 (%)

12.4.2 Canada - Market size and forecast 2025-2030

Chart on Canada - Market size and forecast 2025-2030 ($ million)
Data Table on Canada - Market size and forecast 2025-2030 ($ million)
Chart on Canada - Year-over-year growth 2025-2030 (%)
Data Table on Canada - Year-over-year growth 2025-2030 (%)

12.4.3 Mexico - Market size and forecast 2025-2030

Chart on Mexico - Market size and forecast 2025-2030 ($ million)
Data Table on Mexico - Market size and forecast 2025-2030 ($ million)
Chart on Mexico - Year-over-year growth 2025-2030 (%)
Data Table on Mexico - Year-over-year growth 2025-2030 (%)

12.5 Europe - Market size and forecast 2025-2030

Chart on Europe - Market size and forecast 2025-2030 ($ million)
Data Table on Europe - Market size and forecast 2025-2030 ($ million)
Chart on Europe - Year-over-year growth 2025-2030 (%)
Data Table on Europe - Year-over-year growth 2025-2030 (%)
Chart on Regional Comparison - Europe
Data Table on Regional Comparison - Europe

12.5.1 Germany - Market size and forecast 2025-2030

Chart on Germany - Market size and forecast 2025-2030 ($ million)
Data Table on Germany - Market size and forecast 2025-2030 ($ million)
Chart on Germany - Year-over-year growth 2025-2030 (%)
Data Table on Germany - Year-over-year growth 2025-2030 (%)

12.5.2 UK - Market size and forecast 2025-2030

Chart on UK - Market size and forecast 2025-2030 ($ million)
Data Table on UK - Market size and forecast 2025-2030 ($ million)
Chart on UK - Year-over-year growth 2025-2030 (%)
Data Table on UK - Year-over-year growth 2025-2030 (%)

12.5.3 France - Market size and forecast 2025-2030

Chart on France - Market size and forecast 2025-2030 ($ million)
Data Table on France - Market size and forecast 2025-2030 ($ million)
Chart on France - Year-over-year growth 2025-2030 (%)
Data Table on France - Year-over-year growth 2025-2030 (%)

12.5.4 Italy - Market size and forecast 2025-2030

Chart on Italy - Market size and forecast 2025-2030 ($ million)
Data Table on Italy - Market size and forecast 2025-2030 ($ million)
Chart on Italy - Year-over-year growth 2025-2030 (%)
Data Table on Italy - Year-over-year growth 2025-2030 (%)

12.5.5 The Netherlands - Market size and forecast 2025-2030

Chart on The Netherlands - Market size and forecast 2025-2030 ($ million)
Data Table on The Netherlands - Market size and forecast 2025-2030 ($ million)
Chart on The Netherlands - Year-over-year growth 2025-2030 (%)
Data Table on The Netherlands - Year-over-year growth 2025-2030 (%)

12.5.6 Spain - Market size and forecast 2025-2030

Chart on Spain - Market size and forecast 2025-2030 ($ million)
Data Table on Spain - Market size and forecast 2025-2030 ($ million)
Chart on Spain - Year-over-year growth 2025-2030 (%)
Data Table on Spain - Year-over-year growth 2025-2030 (%)

12.6 Middle East and Africa - Market size and forecast 2025-2030

Chart on Middle East and Africa - Market size and forecast 2025-2030 ($ million)
Data Table on Middle East and Africa - Market size and forecast 2025-2030 ($ million)
Chart on Middle East and Africa - Year-over-year growth 2025-2030 (%)
Data Table on Middle East and Africa - Year-over-year growth 2025-2030 (%)
Chart on Regional Comparison - Middle East and Africa
Data Table on Regional Comparison - Middle East and Africa

12.6.1 Saudi Arabia - Market size and forecast 2025-2030

Chart on Saudi Arabia - Market size and forecast 2025-2030 ($ million)
Data Table on Saudi Arabia - Market size and forecast 2025-2030 ($ million)
Chart on Saudi Arabia - Year-over-year growth 2025-2030 (%)
Data Table on Saudi Arabia - Year-over-year growth 2025-2030 (%)

12.6.2 UAE - Market size and forecast 2025-2030

Chart on UAE - Market size and forecast 2025-2030 ($ million)
Data Table on UAE - Market size and forecast 2025-2030 ($ million)
Chart on UAE - Year-over-year growth 2025-2030 (%)
Data Table on UAE - Year-over-year growth 2025-2030 (%)

12.6.3 South Africa - Market size and forecast 2025-2030

Chart on South Africa - Market size and forecast 2025-2030 ($ million)
Data Table on South Africa - Market size and forecast 2025-2030 ($ million)
Chart on South Africa - Year-over-year growth 2025-2030 (%)
Data Table on South Africa - Year-over-year growth 2025-2030 (%)

12.6.4 Israel - Market size and forecast 2025-2030

Chart on Israel - Market size and forecast 2025-2030 ($ million)
Data Table on Israel - Market size and forecast 2025-2030 ($ million)
Chart on Israel - Year-over-year growth 2025-2030 (%)
Data Table on Israel - Year-over-year growth 2025-2030 (%)

12.6.5 Turkey - Market size and forecast 2025-2030

Chart on Turkey - Market size and forecast 2025-2030 ($ million)
Data Table on Turkey - Market size and forecast 2025-2030 ($ million)
Chart on Turkey - Year-over-year growth 2025-2030 (%)
Data Table on Turkey - Year-over-year growth 2025-2030 (%)

12.7 South America - Market size and forecast 2025-2030

Chart on South America - Market size and forecast 2025-2030 ($ million)
Data Table on South America - Market size and forecast 2025-2030 ($ million)
Chart on South America - Year-over-year growth 2025-2030 (%)
Data Table on South America - Year-over-year growth 2025-2030 (%)
Chart on Regional Comparison - South America
Data Table on Regional Comparison - South America

12.7.1 Brazil - Market size and forecast 2025-2030

Chart on Brazil - Market size and forecast 2025-2030 ($ million)
Data Table on Brazil - Market size and forecast 2025-2030 ($ million)
Chart on Brazil - Year-over-year growth 2025-2030 (%)
Data Table on Brazil - Year-over-year growth 2025-2030 (%)

12.7.2 Argentina - Market size and forecast 2025-2030

Chart on Argentina - Market size and forecast 2025-2030 ($ million)
Data Table on Argentina - Market size and forecast 2025-2030 ($ million)
Chart on Argentina - Year-over-year growth 2025-2030 (%)
Data Table on Argentina - Year-over-year growth 2025-2030 (%)

12.7.3 Chile - Market size and forecast 2025-2030

Chart on Chile - Market size and forecast 2025-2030 ($ million)
Data Table on Chile - Market size and forecast 2025-2030 ($ million)
Chart on Chile - Year-over-year growth 2025-2030 (%)
Data Table on Chile - Year-over-year growth 2025-2030 (%)

12.8 Market opportunity by geography

Market opportunity by geography ($ million)
Data Tables on Market opportunity by geography ($ million)

13. Drivers, Challenges, and Opportunity

13.1 Market drivers

Escalating integration of IoT ecosystems across diverse industries
Rising demand for energy efficient and battery operated communication solutions
Continuous technological advancements in core specification standards

13.2 Market challenges

Stringent and fragmented global regulatory certification processes
Volatility in semiconductor supply chains and raw material procurement
Intense pricing pressures and severe margin compression

13.3 Impact of drivers and challenges

Impact of drivers and challenges in 2025 and 2030

13.4 Market opportunities

Integration of AI and ML at edge
Progressive miniaturization and system-in-package advancements
Expansion of mesh networking and advanced interoperability protocols

14. Competitive Landscape

14.1 Overview

14.2

Overview on criticality of inputs and factors of differentiation

14.3 Landscape disruption

Overview on factors of disruption

14.4 Industry risks

Impact of key risks on business

15. Competitive Analysis

15.1 Companies profiled

Companies covered

15.2 Company ranking index

15.3 Market positioning of companies

Matrix on companies position and classification

15.4 Alps Alpine Co. Ltd.

Alps Alpine Co. Ltd. - Overview
Alps Alpine Co. Ltd. - Business segments
Alps Alpine Co. Ltd. - Key offerings
Alps Alpine Co. Ltd. - Segment focus
SWOT

15.5 Espressif Systems Shanghai

Espressif Systems Shanghai - Overview
Espressif Systems Shanghai - Product / Service
Espressif Systems Shanghai - Key offerings
SWOT

15.6 Ezurio

Ezurio - Overview
Ezurio - Product / Service
Ezurio - Key offerings
SWOT

15.7 Infineon Technologies AG

Infineon Technologies AG - Overview
Infineon Technologies AG - Business segments
Infineon Technologies AG - Key news
Infineon Technologies AG - Key offerings
Infineon Technologies AG - Segment focus
SWOT

15.8 Microchip Technology Inc.

Microchip Technology Inc. - Overview
Microchip Technology Inc. - Business segments
Microchip Technology Inc. - Key offerings
Microchip Technology Inc. - Segment focus
SWOT

15.9 Murata Manufacturing Co. Ltd.

Murata Manufacturing Co. Ltd. - Overview
Murata Manufacturing Co. Ltd. - Business segments
Murata Manufacturing Co. Ltd. - Key offerings
Murata Manufacturing Co. Ltd. - Segment focus
SWOT

15.10 NXP Semiconductors NV

NXP Semiconductors NV - Overview
NXP Semiconductors NV - Business segments
NXP Semiconductors NV - Key news
NXP Semiconductors NV - Key offerings
NXP Semiconductors NV - Segment focus
SWOT

15.11 Panasonic Holdings Corp.

Panasonic Holdings Corp. - Overview
Panasonic Holdings Corp. - Business segments
Panasonic Holdings Corp. - Key news
Panasonic Holdings Corp. - Key offerings
Panasonic Holdings Corp. - Segment focus
SWOT

15.12 Renesas Electronics Corp.

Renesas Electronics Corp. - Overview
Renesas Electronics Corp. - Business segments
Renesas Electronics Corp. - Key news
Renesas Electronics Corp. - Key offerings
Renesas Electronics Corp. - Segment focus
SWOT

15.13 Silicon Laboratories Inc.

Silicon Laboratories Inc. - Overview
Silicon Laboratories Inc. - Product / Service
Silicon Laboratories Inc. - Key news
Silicon Laboratories Inc. - Key offerings
SWOT

15.14 STMicroelectronics NV

STMicroelectronics NV - Overview
STMicroelectronics NV - Business segments
STMicroelectronics NV - Key news
STMicroelectronics NV - Key offerings
STMicroelectronics NV - Segment focus
SWOT

15.15 TAIYO YUDEN Co. Ltd.

TAIYO YUDEN Co. Ltd. - Overview
TAIYO YUDEN Co. Ltd. - Product / Service
TAIYO YUDEN Co. Ltd. - Key offerings
SWOT

15.16 Telit Cinterion

Telit Cinterion - Overview
Telit Cinterion - Product / Service
Telit Cinterion - Key offerings
SWOT

15.17 Texas Instruments Inc.

Texas Instruments Inc. - Overview
Texas Instruments Inc. - Business segments
Texas Instruments Inc. - Key news
Texas Instruments Inc. - Key offerings
Texas Instruments Inc. - Segment focus
SWOT

15.18 u blox AG

u blox AG - Overview
u blox AG - Business segments
u blox AG - Key offerings
u blox AG - Segment focus
SWOT

16. Appendix

16.1 Scope of the report

Market definition
Objectives
Notes and caveats

16.2 Inclusions and exclusions checklist

Inclusions checklist
Exclusions checklist

16.3 Currency conversion rates for US$

16.4 Research methodology

16.5 Data procurement

Information sources

16.6 Data validation

16.7 Validation techniques employed for market sizing

16.8 Data synthesis

16.9 360 degree market analysis

16.10 List of abbreviations

Research Methodology

Technavio presents a detailed picture of the market by way of study, synthesis, and summation of data from multiple sources. The analysts have presented the various facets of the market with a particular focus on identifying the key industry influencers. The data thus presented is comprehensive, reliable, and the result of extensive research, both primary and secondary.

INFORMATION SOURCES

Primary sources

  • Manufacturers and suppliers
  • Channel partners
  • Industry experts
  • Strategic decision makers

Secondary sources

  • Industry journals and periodicals
  • Government data
  • Financial reports of key industry players
  • Historical data
  • Press releases

DATA ANALYSIS

Data Synthesis

  • Collation of data
  • Estimation of key figures
  • Analysis of derived insights

Data Validation

  • Triangulation with data models
  • Reference against proprietary databases
  • Corroboration with industry experts

REPORT WRITING

Qualitative

  • Market drivers
  • Market challenges
  • Market trends
  • Five forces analysis

Quantitative

  • Market size and forecast
  • Market segmentation
  • Geographical insights
  • Competitive landscape

Interested in this report?

Get your sample now to see our research methodology and insights!

Download Now

Frequently Asked Questions

Ble Module market growth will increase by USD 56564.4 million during 2026-2030.

The Ble Module market is expected to grow at a CAGR of 18.6% during 2026-2030.

Ble Module market is segmented by Application (Industrial automation, Automotive tracking, Asset tracking and proximity marketing, Consumer electronics, Others) Type (Single mode, Dual mode, Others) Device (Computing devices, Smart wearables, Smart home appliances, Others)

Alps Alpine Co. Ltd., BDE Technology, Espressif Systems Shanghai, Ezurio, FANSTEL Corp., Infineon Technologies AG, InsightSIP, LM Technologies Ltd, Microchip Technology Inc., Murata Manufacturing Co. Ltd., NXP Semiconductors NV, Panasonic Holdings Corp., Raytac Corp, Renesas Electronics Corp., Shenzhen Holyiot Technology Co., Shenzhen Minew Tech Co. Ltd., Silicon Laboratories Inc., STMicroelectronics NV, TAIYO YUDEN Co. Ltd., Telit Cinterion, Texas Instruments Inc., u blox AG are a few of the key vendors in the Ble Module market.

APAC will register the highest growth rate of 56.7% among the other regions. Therefore, the Ble Module market in APAC is expected to garner significant business opportunities for the vendors during the forecast period.

China, Japan, South Korea, India, Indonesia, Australia, US, Canada, Mexico, Germany, UK, France, Italy, The Netherlands, Spain, Saudi Arabia, UAE, South Africa, Israel, Turkey, Brazil, Argentina, Chile

  • Escalating integration of IoT ecosystems across diverse industries is the driving factor this market.

The Ble Module market vendors should focus on grabbing business opportunities from the Application segment as it accounted for the largest market share in the base year.
RIA - Research AI Assistant
Ask RIA
