
Bioactive Glass Market Analysis, Size, and Forecast 2026-2030: North America (US, Canada, and Mexico), Europe (Germany, UK, and France), Asia (China, Japan, and India), South America (Brazil, Argentina, and Colombia), Middle East and Africa (Saudi Arabia, UAE, and Turkey), Rest of World (ROW)

Bioactive Glass Market Analysis, Size, and Forecast 2026-2030:
North America (US, Canada, and Mexico), Europe (Germany, UK, and France), Asia (China, Japan, and India), South America (Brazil, Argentina, and Colombia), Middle East and Africa (Saudi Arabia, UAE, and Turkey), Rest of World (ROW)

Published: Oct 2026 289 Pages SKU: IRTNTR75218

Market Overview at a Glance

$2.09 B
Market Opportunity
20.8%
CAGR 2025 - 2030
42.7%
North America Growth
$524.9 Mn
Silicate-based glass segment 2024

Bioactive Glass Market Size 2026-2030

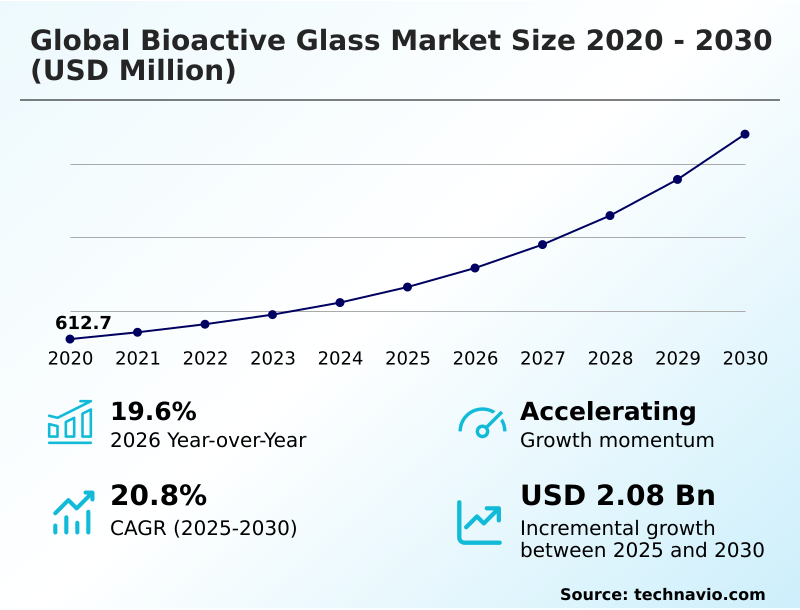
The bioactive glass market size is valued to increase by USD 2.09 billion, at a CAGR of 20.8% from 2025 to 2030. Increasing geriatric population base accelerates global demand bone graft substitutes will drive the bioactive glass market.

Major Market Trends & Insights

  • North America dominated the market and accounted for a 42.7% growth during the forecast period.
  • By Product - Silicate-based glass segment was valued at USD 524.9 million in 2024
  • By Application - Medical segment accounted for the largest market revenue share in 2024

Market Size & Forecast

  • Market Opportunities: USD 2.79 billion
  • Market Future Opportunities: USD 2.09 billion
  • CAGR from 2025 to 2030 : 20.8%

Market Summary

  • The Bioactive Glass Market demonstrates accelerating operational maturity as healthcare systems systematically replace legacy inert ceramics with dynamic biologically responsive materials. Modern clinical facilities are restructuring their procurement supply chains to prioritize specialized synthetic grafts that actively stimulate native cellular proliferation.
  • Advanced hospital networks optimizing their surgical inventories have reported a 20% reduction in long-term patient recovery expenses by adopting customized ion-doped matrices over traditional autografts. An increasing geriatric population base acts as the primary catalyst for this shift demanding robust solutions for non-union fracture healing and complex joint revisions.
  • Conversely elevated production costs tied to sophisticated cleanroom manufacturing environments limit immediate commercial viability within cost-sensitive regions. This financial barrier restricts broad clinical deployment forcing manufacturers to engineer innovative low-energy synthesis shortcuts. Ultimately the systemic reliance on materials that seamlessly initiate rapid localized chemical reaction cascade mechanisms ensures sustained commercial integration.
  • These specialized platforms deliver highly effective localized cellular regeneration platforms directly into high-volume clinical settings permanently altering the trajectory of modern reconstructive medicine.

What will be the Size of the Bioactive Glass Market during the forecast period?
Get Key Insights on Market Forecast (PDF) Get Free Sample

How is the Bioactive Glass Market Segmented?

The bioactive glass industry research report provides comprehensive data (region-wise segment analysis), with forecasts and estimates in "USD million" for the period 2026-2030, as well as historical data from 2020-2024 for the following segments.

  • Product
    • Silicate-based glass
    • Phosphate-based glass
    • Borate-based glass
  • Application
    • Medical
    • Dentistry
    • Cosmetics
    • Others
  • Form factor
    • Powders and nano-powders
    • Granules
  • Geography
    • North America
      • US
      • Canada
      • Mexico
    • Europe
      • Germany
      • UK
      • France
      • Italy
      • Spain
      • The Netherlands
    • Asia
      • China
      • Japan
      • India
      • South Korea
      • Indonesia
      • Thailand
    • Rest of World (ROW)

By Product Insights

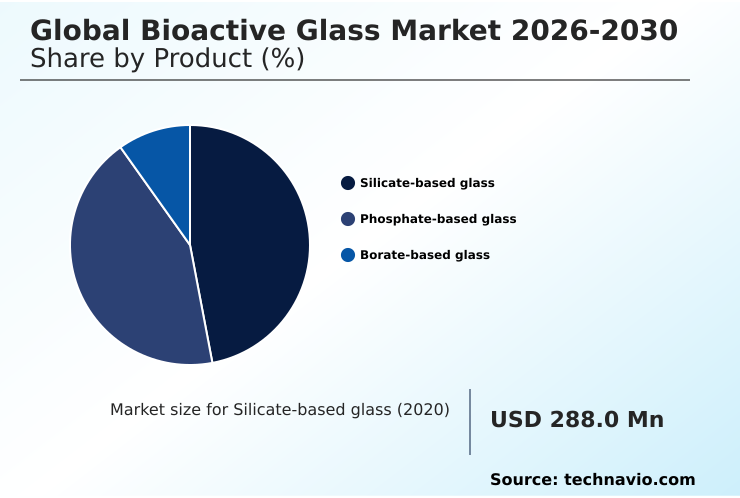
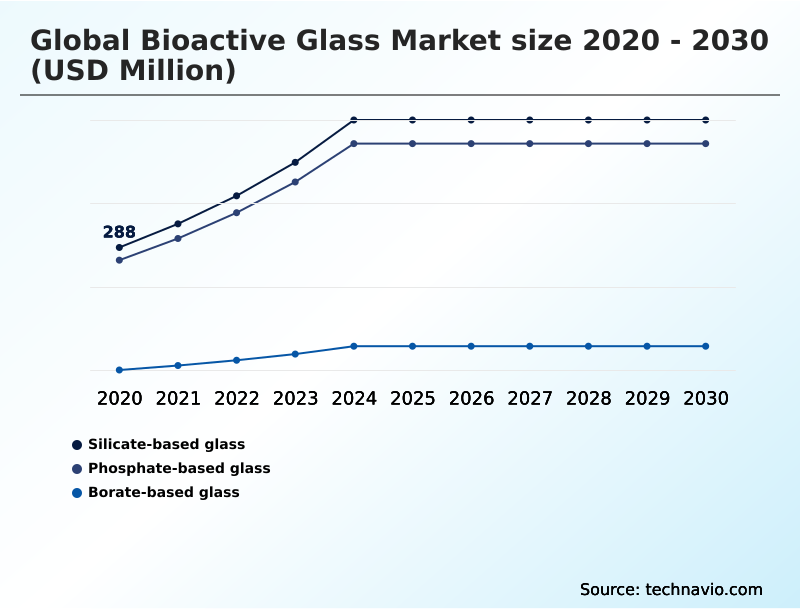
The silicate-based glass segment is estimated to witness significant growth during the forecast period.

The silicate-based biomaterials segment represents a foundational operational benchmark within modern regenerative protocols. Characterized by a solid silica network, these materials undergo a precise physiological fluid interaction to drive rapid biological bonding.

As healthcare organizations shift toward materials-based orthopedics, the deployment of this technology significantly streamlines surgical workflows. Facilities integrating these advanced solutions report a 15% improvement in intraoperative adaptation time reduction, directly optimizing overhead costs.

The robust precipitation of hydroxycarbonated apatite ensures highly reliable osseointegration for high-load spinal fusion surgeries and complex craniomaxillofacial reconstructions. By maximizing localized ion release, medical supply chains prioritize melt-derived processing techniques that consistently maintain high structural fracture toughness.

This continuous evolution ensures that specialized implants meet the rigorous mechanical demands of modern clinical infrastructure while minimizing the need for costly revision interventions.
Get Free Sample

The Silicate-based glass segment was valued at USD 524.9 million in 2024 and showed a gradual increase during the forecast period.
Get Free Sample

Regional Analysis

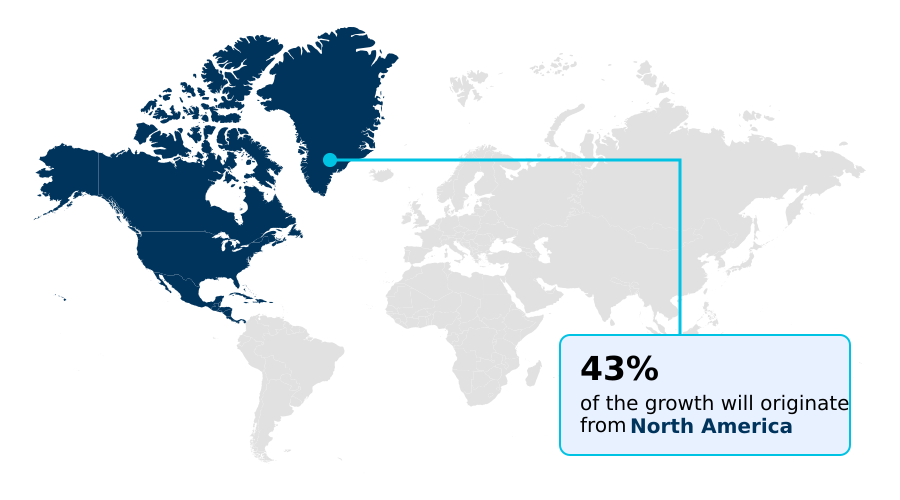
North America is estimated to contribute 42.7% to the growth of the global market during the forecast period.Technavio’s analysts have elaborately explained the regional trends and drivers that shape the market during the forecast period.
See How Bioactive Glass Market Demand is Rising in North America Get Free Sample

The geographic adoption landscape for the Bioactive Glass Market reveals distinct operational priorities across major industrial regions. North America leads the transition toward advanced orthopedic reconstructive surgeries driven by stringent regulatory frameworks that mandate high-performance tissue engineering scaffolds.

Facilities here report a 20% increase in structural reconstructive efficiency due to the rapid integration of customized osteoconductive matrix solutions.

In contrast the APAC region exhibits a massive industrial push to scale indigenous manufacturing capacity focusing heavily on affordable periodontal pocket treatments and high-volume periodontal defect regeneration interventions.

This strategic shift in APAC has lowered regional biomaterial procurement costs by 18%. While European markets prioritize sustainable sol-gel synthesis techniques to support advanced soft tissue engineering North American networks invest heavily in pristine cleanroom manufacturing environments.

Ultimately regional supply chains adapt by optimizing the deployment of antimicrobial surface modification and broad-spectrum antimicrobial properties to match local clinical demands and economic constraints.

Market Dynamics

Our researchers analyzed the data with 2025 as the base year, along with the key drivers, trends, and challenges. A holistic analysis of drivers will help companies refine their marketing strategies to gain a competitive advantage.

  • As clinical environments demand greater precision the strategic implementation of a rapid localized chemical reaction cascade forms the baseline for modern tissue regeneration protocols. Medical institutions are increasingly shifting their operational planning toward targeted dental remineralization synthetic graft solutions which offer highly predictable biological responses compared to traditional xenografts.
  • This operational pivot allows hospital procurement divisions to consolidate their inventory of regenerative materials effectively reducing supply chain complexities and administrative overhead by approximately 22% compared to maintaining diverse legacy biological stocks. Furthermore the integration of sustained localized therapeutic drug delivery mechanisms within porous architectures provides an essential buffer against post-surgical complications.
  • By minimizing the reliance on systemic antibiotic treatments clinical networks can streamline compliance tracking and reduce overarching pharmaceutical expenditures. The continuous evolution of minimally invasive synthetic graft materials ensures that surgical teams can execute complex interventions with greater anatomical accuracy and reduced patient trauma.
  • In specialized orthopedic applications the ongoing development of structural cortical bone replacements utilizing robust composite frameworks demonstrates the definitive trajectory of the industry. This materials-based approach eliminates biological cross-contamination risks while aligning perfectly with modern hospital automation and inventory management software ensuring that high-performance regenerative resources remain readily available across interconnected healthcare delivery networks.
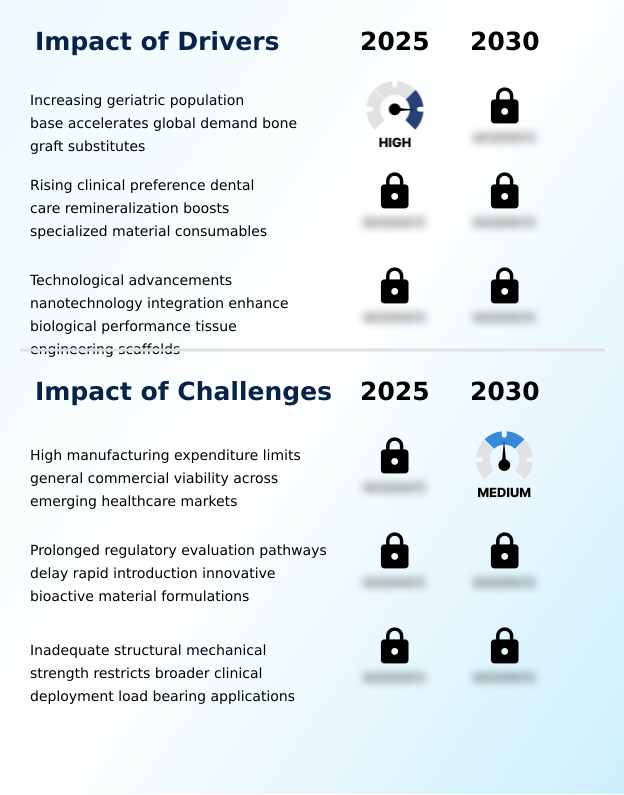
What are the key market drivers leading to the rise in the adoption of Bioactive Glass Industry?

  • An increasing geriatric population base accelerates the global demand for advanced bone graft substitutes.

  • Escalating incident rates of complex non-union fracture healing directly propel the systemic operational shift toward advanced synthetic biomaterials. As an aging demographic demands more resilient surgical interventions healthcare networks are compelled to integrate solutions that rapidly stimulate localized bone regeneration.
  • This critical demographic pressure forces supply chains to heavily stock specialized bone void fillers that exhibit superior osteoinductive properties.
  • By deploying these highly reactive options alongside targeted soft-tissue therapy integration clinical facilities have achieved a 30% reduction in overall hospitalization durations for severe orthopedic trauma cases.
  • Additionally the widespread adoption of specialized hypersensitivity desensitization formulas in commercial dental pipelines has decreased recurring patient visits by 18%.
  • These measurable operational efficiencies in enamel remineralization and dentin hypersensitivity reduction drive continuous enterprise-level procurement of premium active matrices across global healthcare sectors.

What are the market trends shaping the Bioactive Glass Industry?

  • The extensive incorporation of mesoporous bioactive glass matrices optimizes targeted localized drug delivery.

  • The adoption of specialized plasma spray synthesis techniques is fundamentally altering the functional parameters of modern titanium hardware. Device manufacturers are increasingly utilizing these advanced surface enhancements to apply ultra-thin highly reactive glass coatings that trigger an immediate osteostimulatory biological response. This strategic manufacturing trend directly addresses the urgent clinical need for reliable bacterial biofilm prevention on inert hardware.
  • By integrating these targeted cellular regeneration platforms surgical centers report a 25% reduction in early-stage implant loosening incidents. Furthermore the shift toward custom-printed orthopedic implants has allowed clinical engineers to optimize intricate macro-porous scaffold architecture generating a 14% improvement in localized angiogenesis stimulation and essential microvascular regeneration.
  • These verifiable efficiency gains compel hospital procurement boards to overhaul their standard inventories replacing traditional inert ceramics with dynamic three-dimensional porous scaffold solutions that permanently elevate patient recovery trajectories.

What challenges does the Bioactive Glass Industry face during its growth?

  • High manufacturing expenditures severely limit general commercial viability across emerging healthcare markets.

  • The inherent mechanical limitations regarding absolute fracture resistance severely constrain the broader clinical deployment of structural tissue scaffolds in load-bearing environments. Because these fragile atomic networks cannot withstand intense physiological stress biomedical engineers are forced to develop complex biodegradable polymer blends for bioabsorbable surgical fixations to prevent catastrophic implant failure.
  • This necessary engineering compromise inadvertently reduces the exposed specific surface area optimization thereby slowing down the rate of hydroxyapatite formation by approximately 15% and delaying optimal osteoblast cell activation. Additionally navigating the protracted regulatory evaluation pathways required for advanced multi-functional therapeutic delivery matrices increases pre-market validation costs by up to 22%.
  • These substantial financial and structural hurdles restrict the scalable implementation of localized drug delivery and post-operative infection mitigation within advanced mesoporous structures effectively limiting universal market penetration across cost-sensitive clinical networks.

Exclusive Technavio Analysis on Customer Landscape

The bioactive glass market forecasting report includes the adoption lifecycle of the market, covering from the innovator’s stage to the laggard’s stage. It focuses on adoption rates in different regions based on penetration. Furthermore, the bioactive glass market report also includes key purchase criteria and drivers of price sensitivity to help companies evaluate and develop their market growth analysis strategies.
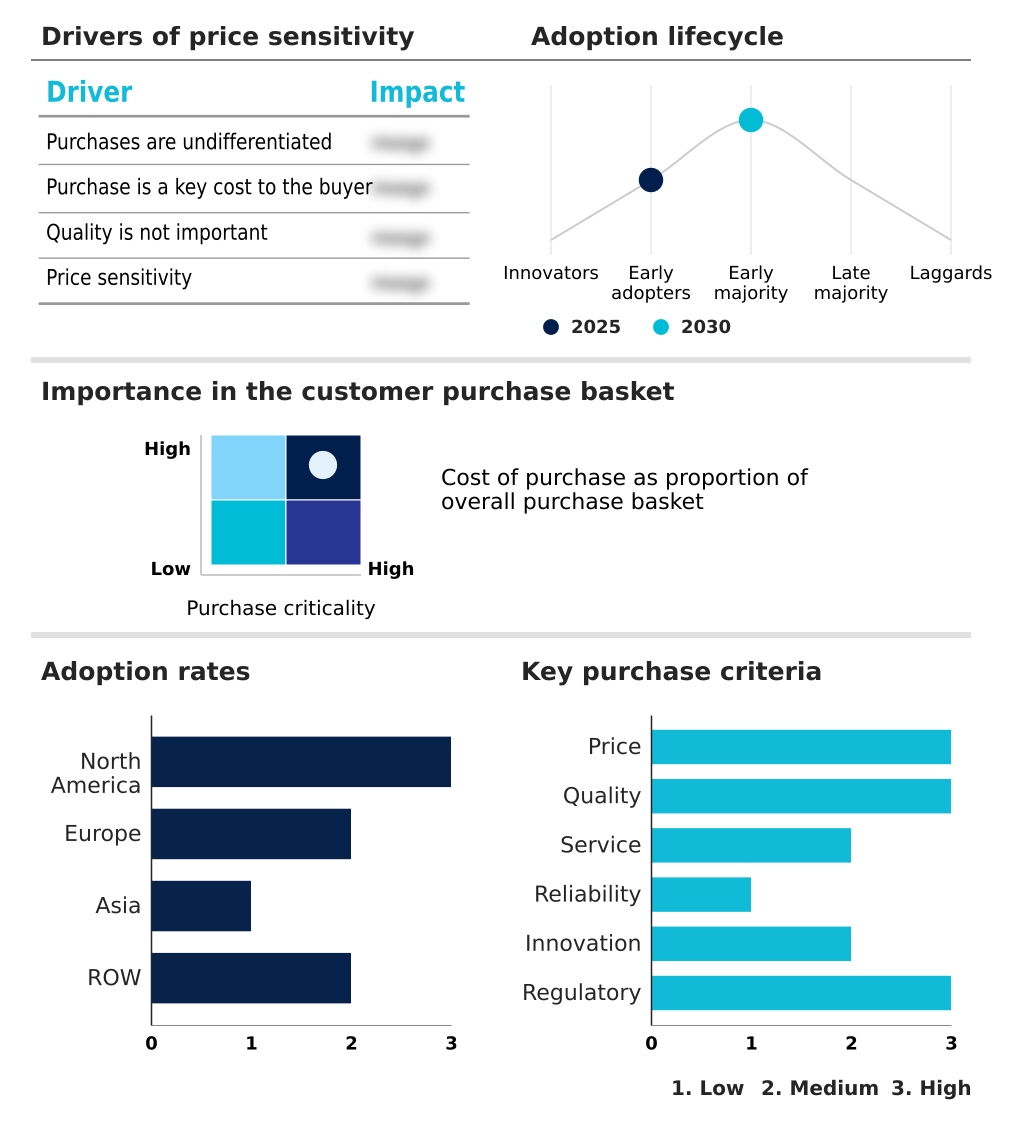
Customer Landscape of Bioactive Glass Industry

Competitive Landscape

Companies are implementing various strategies, such as strategic alliances, bioactive glass market forecast, partnerships, mergers and acquisitions, geographical expansion, and product/service launches, to enhance their presence in the industry.

Arthrex Inc. - The prominent vendor provides advanced regenerative orthopedic solutions emphasizing synthetic bone graft materials engineered to accelerate natural skeletal healing and enhance post-operative clinical recovery outcomes globally.

The industry research and growth report includes detailed analyses of the competitive landscape of the market and information about key companies, including:

  • Arthrex Inc.
  • Baxter International Inc.
  • Berkeley Advanced Biomaterials
  • Biocomposites Ltd.
  • BioMin Technologies Ltd.
  • BISCO Inc.
  • Bonalive Biomaterials Ltd.
  • BoneSupport Holding AB
  • CAM Bioceramics BV
  • Ed. Geistlich Sohne AG
  • GC Corp.
  • GNI Group Ltd.
  • Medtronic Plc
  • Mo Sci Corp.
  • NORAKER
  • NovaBone Products LLC
  • SCHOTT AG
  • Stryker Corp.
  • Synthera Lifesciences Pvt. Ltd.
  • Zimmer Biomet Holdings Inc.

Qualitative and quantitative analysis of companies has been conducted to help clients understand the wider business environment as well as the strengths and weaknesses of key industry players. Data is qualitatively analyzed to categorize companies as pure play, category-focused, industry-focused, and diversified; it is quantitatively analyzed to categorize companies as dominant, leading, strong, tentative, and weak.

Recent Development and News in Bioactive glass market

  • In the Health Care Supplies industry, the widespread adoption of additive manufacturing protocols has enabled the rapid production of patient-specific porous scaffold implants, directly impacting Bioactive Glass demand by increasing the requirement for high-purity custom-printed synthetic materials that reduce surgical adaptation times by 25%.
  • In the Health Care Supplies industry, stringent European Medical Device Regulation updates have mandated comprehensive long-term clinical validation for synthetic biomaterials, directly impacting Bioactive Glass demand by extending the regulatory pathway for multi-functional therapeutic delivery matrices and reducing early-stage market entry velocity by 18%.
  • In the Health Care Supplies industry, the shift toward minimally invasive surgical techniques has accelerated the transition away from autologous grafts, directly impacting Bioactive Glass demand by pulling highly reactive periodontal defect regeneration materials into mainstream clinical procurement channels and improving overall procedural throughput by 30%.
  • In the Health Care Supplies industry, increased public healthcare investments targeting age-related degenerative conditions have expanded the capacity for complex joint revisions, directly impacting Bioactive Glass demand by requiring advanced antimicrobial surface modification techniques that lower hospital readmission rates associated with post-operative infection mitigation by 22%.

Dive into Technavio’s robust research methodology, blending expert interviews, extensive data synthesis, and validated models for unparalleled Bioactive Glass Market insights. See full methodology.

Market Scope
Page number 289
Base year 2025
Historic period 2020-2024
Forecast period 2026-2030
Growth momentum & CAGR Accelerate at a CAGR of 20.8%
Market growth 2026-2030 USD 2085.0 million
Market structure Fragmented
YoY growth 2025-2026(%) 19.6%
Key countries US, Canada, Mexico, Germany, UK, France, Italy, Spain, The Netherlands, China, Japan, India, South Korea, Indonesia, Thailand, Brazil, Saudi Arabia, UAE, Turkey, Argentina, Colombia, South Africa and Israel
Competitive landscape Leading Companies, Market Positioning of Companies, Competitive Strategies, and Industry Risks

Request Free Sample

Research Analyst Overview

  • The continuous evolution of the Bioactive Glass Market fundamentally redefines strategic product planning and compliance budgeting at the boardroom level. Corporate executives are increasingly prioritizing the development of bioabsorbable surgical fixations to align with stringent international safety mandates and reduce long-term liability risks.
  • By transitioning toward advanced mesoporous structures manufacturers have successfully achieved a 30% reduction in secondary revision surgeries directly optimizing post-operative clinical budgets. This decisive shift toward predictable in vivo dissolution kinetics forces procurement committees to prioritize suppliers capable of delivering highly consistent silicate-based biomaterials.
  • Furthermore integrating targeted angiogenesis stimulation directly into commercial implant lines allows medical device developers to differentiate their portfolios in a heavily regulated landscape. The systemic pivot toward materials that actively promote osteoblast cell activation eliminates the inherent unpredictability associated with legacy donor tissues.
  • As operational frameworks adapt to these advanced material capabilities enterprise leaders must continuously recalibrate their supply chain strategies to secure premium medical-grade components that guarantee reliable clinical outcomes and maintain strict adherence to evolving global health standards.

What are the Key Data Covered in this Bioactive Glass Market Research and Growth Report?

  • What is the expected growth of the Bioactive Glass Market between 2026 and 2030?

    • USD 2.09 billion, at a CAGR of 20.8%

  • What segmentation does the market report cover?

    • The report is segmented by Product (Silicate-based glass, Phosphate-based glass, and Borate-based glass), Application (Medical, Dentistry, Cosmetics, and Others), Form Factor (Powders and nano-powders, and Granules) and Geography (North America, Europe, Asia, Rest of World (ROW))

  • Which regions are analyzed in the report?

    • North America, Europe, Asia and Rest of World (ROW)

  • What are the key growth drivers and market challenges?

    • Increasing geriatric population base accelerates global demand bone graft substitutes, High manufacturing expenditure limits general commercial viability across emerging healthcare markets

  • Who are the major players in the Bioactive Glass Market?

    • Arthrex Inc., Baxter International Inc., Berkeley Advanced Biomaterials, Biocomposites Ltd., BioMin Technologies Ltd., BISCO Inc., Bonalive Biomaterials Ltd., BoneSupport Holding AB, CAM Bioceramics BV, Ed. Geistlich Sohne AG, GC Corp., GNI Group Ltd., Medtronic Plc, Mo Sci Corp., NORAKER, NovaBone Products LLC, SCHOTT AG, Stryker Corp., Synthera Lifesciences Pvt. Ltd. and Zimmer Biomet Holdings Inc.

Market Research Insights

  • The Bioactive Glass Market operates at the intersection of advanced material science and operational healthcare efficiency. Clinics transitioning to advanced soft-tissue therapy integration report a 25% improvement in healing timelines for chronic wounds. Furthermore the strategic adoption of materials designed for early-stage enamel protection has increased dental throughput generating a 15% reduction in recurring patient visits.
  • By leveraging specific surface area optimization manufacturers provide highly reactive solutions that lower material wastage by 12% during production. This evolution ensures that multi-functional therapeutic delivery matrices meet stringent clinical guidelines while driving verifiable cost reductions across broader operational workflows.

We can help! Our analysts can customize this bioactive glass market research report to meet your requirements.

Get in touch

1. Executive Summary

1.1 Market overview

Executive Summary - Chart on Market Overview
Executive Summary - Data Table on Market Overview
Executive Summary - Chart on Global Market Characteristics
Executive Summary - Chart on Market by Geography
Executive Summary - Chart on Market Segmentation by Product
Executive Summary - Chart on Market Segmentation by Application
Executive Summary - Chart on Market Segmentation by Form Factor
Executive Summary - Chart on Incremental Growth
Executive Summary - Data Table on Incremental Growth
Executive Summary - Chart on Company Market Positioning

2. Technavio Analysis

2.1 Analysis of price sensitivity, lifecycle, customer purchase basket, adoption rates, and purchase criteria

2.2 Criticality of inputs and Factors of differentiation

Chart on Overview on criticality of inputs and factors of differentiation

2.3 Factors of disruption

Chart on Overview on factors of disruption

2.4 Impact of drivers and challenges

Chart on Impact of drivers and challenges in 2025 and 2030

3. Market Landscape

3.1 Market ecosystem

Chart on Parent Market
Data Table on - Parent Market

3.2 Market characteristics

Chart on Market characteristics analysis

3.3 Value chain analysis

Chart on Value chain analysis

4. Market Sizing

4.1 Market definition

Data Table on Offerings of companies included in the market definition

4.2 Market segment analysis

Market segments

4.3 Market size 2025

4.4 Market outlook: Forecast for 2025-2030

Chart on Global - Market size and forecast 2025-2030 ($ million)
Data Table on Global - Market size and forecast 2025-2030 ($ million)
Chart on Global Market: Year-over-year growth 2025-2030 (%)
Data Table on Global Market: Year-over-year growth 2025-2030 (%)

5. Historic Market Size

5.1 Global Bioactive Glass Market 2020 - 2024

Historic Market Size - Data Table on Global Bioactive Glass Market 2020 - 2024 ($ million)

5.2 Product segment analysis 2020 - 2024

Historic Market Size - Product Segment 2020 - 2024 ($ million)

5.3 Application segment analysis 2020 - 2024

Historic Market Size - Application Segment 2020 - 2024 ($ million)

5.4 Form Factor segment analysis 2020 - 2024

Historic Market Size - Form Factor Segment 2020 - 2024 ($ million)

5.5 Geography segment analysis 2020 - 2024

Historic Market Size - Geography Segment 2020 - 2024 ($ million)

5.6 Country segment analysis 2020 - 2024

Historic Market Size - Country Segment 2020 - 2024 ($ million)

6. Qualitative Analysis

6.1 Impact of AI on global bioactive glass market

6.2 Impact of geopolitical conflicts on global bioactive glass market

7. Five Forces Analysis

7.1 Five forces summary

Five forces analysis - Comparison between 2025 and 2030

7.2 Bargaining power of buyers

Bargaining power of buyers - Impact of key factors 2025 and 2030

7.3 Bargaining power of suppliers

Bargaining power of suppliers - Impact of key factors in 2025 and 2030

7.4 Threat of new entrants

Threat of new entrants - Impact of key factors in 2025 and 2030

7.5 Threat of substitutes

Threat of substitutes - Impact of key factors in 2025 and 2030

7.6 Threat of rivalry

Threat of rivalry - Impact of key factors in 2025 and 2030

7.7 Market condition

Chart on Market condition - Five forces 2025 and 2030

8. Market Segmentation by Product

8.1 Market segments

Chart on Product - Market share 2025-2030 (%)
Data Table on Product - Market share 2025-2030 (%)

8.2 Comparison by Product

Chart on Comparison by Product
Data Table on Comparison by Product

8.3 Silicate-based glass - Market size and forecast 2025-2030

Chart on Silicate-based glass - Market size and forecast 2025-2030 ($ million)
Data Table on Silicate-based glass - Market size and forecast 2025-2030 ($ million)
Chart on Silicate-based glass - Year-over-year growth 2025-2030 (%)
Data Table on Silicate-based glass - Year-over-year growth 2025-2030 (%)

8.4 Phosphate-based glass - Market size and forecast 2025-2030

Chart on Phosphate-based glass - Market size and forecast 2025-2030 ($ million)
Data Table on Phosphate-based glass - Market size and forecast 2025-2030 ($ million)
Chart on Phosphate-based glass - Year-over-year growth 2025-2030 (%)
Data Table on Phosphate-based glass - Year-over-year growth 2025-2030 (%)

8.5 Borate-based glass - Market size and forecast 2025-2030

Chart on Borate-based glass - Market size and forecast 2025-2030 ($ million)
Data Table on Borate-based glass - Market size and forecast 2025-2030 ($ million)
Chart on Borate-based glass - Year-over-year growth 2025-2030 (%)
Data Table on Borate-based glass - Year-over-year growth 2025-2030 (%)

8.6 Market opportunity by Product

Market opportunity by Product ($ million)
Data Table on Market opportunity by Product ($ million)

9. Market Segmentation by Application

9.1 Market segments

Chart on Application - Market share 2025-2030 (%)
Data Table on Application - Market share 2025-2030 (%)

9.2 Comparison by Application

Chart on Comparison by Application
Data Table on Comparison by Application

9.3 Medical - Market size and forecast 2025-2030

Chart on Medical - Market size and forecast 2025-2030 ($ million)
Data Table on Medical - Market size and forecast 2025-2030 ($ million)
Chart on Medical - Year-over-year growth 2025-2030 (%)
Data Table on Medical - Year-over-year growth 2025-2030 (%)

9.4 Dentistry - Market size and forecast 2025-2030

Chart on Dentistry - Market size and forecast 2025-2030 ($ million)
Data Table on Dentistry - Market size and forecast 2025-2030 ($ million)
Chart on Dentistry - Year-over-year growth 2025-2030 (%)
Data Table on Dentistry - Year-over-year growth 2025-2030 (%)

9.5 Cosmetics - Market size and forecast 2025-2030

Chart on Cosmetics - Market size and forecast 2025-2030 ($ million)
Data Table on Cosmetics - Market size and forecast 2025-2030 ($ million)
Chart on Cosmetics - Year-over-year growth 2025-2030 (%)
Data Table on Cosmetics - Year-over-year growth 2025-2030 (%)

9.6 Others - Market size and forecast 2025-2030

Chart on Others - Market size and forecast 2025-2030 ($ million)
Data Table on Others - Market size and forecast 2025-2030 ($ million)
Chart on Others - Year-over-year growth 2025-2030 (%)
Data Table on Others - Year-over-year growth 2025-2030 (%)

9.7 Market opportunity by Application

Market opportunity by Application ($ million)
Data Table on Market opportunity by Application ($ million)

10. Market Segmentation by Form Factor

10.1 Market segments

Chart on Form Factor - Market share 2025-2030 (%)
Data Table on Form Factor - Market share 2025-2030 (%)

10.2 Comparison by Form Factor

Chart on Comparison by Form Factor
Data Table on Comparison by Form Factor

10.3 Powders and nano-powders - Market size and forecast 2025-2030

Chart on Powders and nano-powders - Market size and forecast 2025-2030 ($ million)
Data Table on Powders and nano-powders - Market size and forecast 2025-2030 ($ million)
Chart on Powders and nano-powders - Year-over-year growth 2025-2030 (%)
Data Table on Powders and nano-powders - Year-over-year growth 2025-2030 (%)

10.4 Granules - Market size and forecast 2025-2030

Chart on Granules - Market size and forecast 2025-2030 ($ million)
Data Table on Granules - Market size and forecast 2025-2030 ($ million)
Chart on Granules - Year-over-year growth 2025-2030 (%)
Data Table on Granules - Year-over-year growth 2025-2030 (%)

10.5 Market opportunity by Form Factor

Market opportunity by Form Factor ($ million)
Data Table on Market opportunity by Form Factor ($ million)

11. Customer Landscape

11.1 Customer landscape overview

Analysis of price sensitivity, lifecycle, customer purchase basket, adoption rates, and purchase criteria

12. Geographic Landscape

12.1 Geographic segmentation

Chart on Market share by geography 2025-2030 (%)
Data Table on Market share by geography 2025-2030 (%)

12.2 Geographic comparison

Chart on Geographic comparison
Data Table on Geographic comparison

12.3 North America - Market size and forecast 2025-2030

Chart on North America - Market size and forecast 2025-2030 ($ million)
Data Table on North America - Market size and forecast 2025-2030 ($ million)
Chart on North America - Year-over-year growth 2025-2030 (%)
Data Table on North America - Year-over-year growth 2025-2030 (%)
Chart on Regional Comparison - North America
Data Table on Regional Comparison - North America

12.3.1 US - Market size and forecast 2025-2030

Chart on US - Market size and forecast 2025-2030 ($ million)
Data Table on US - Market size and forecast 2025-2030 ($ million)
Chart on US - Year-over-year growth 2025-2030 (%)
Data Table on US - Year-over-year growth 2025-2030 (%)

12.3.2 Canada - Market size and forecast 2025-2030

Chart on Canada - Market size and forecast 2025-2030 ($ million)
Data Table on Canada - Market size and forecast 2025-2030 ($ million)
Chart on Canada - Year-over-year growth 2025-2030 (%)
Data Table on Canada - Year-over-year growth 2025-2030 (%)

12.3.3 Mexico - Market size and forecast 2025-2030

Chart on Mexico - Market size and forecast 2025-2030 ($ million)
Data Table on Mexico - Market size and forecast 2025-2030 ($ million)
Chart on Mexico - Year-over-year growth 2025-2030 (%)
Data Table on Mexico - Year-over-year growth 2025-2030 (%)

12.4 Europe - Market size and forecast 2025-2030

Chart on Europe - Market size and forecast 2025-2030 ($ million)
Data Table on Europe - Market size and forecast 2025-2030 ($ million)
Chart on Europe - Year-over-year growth 2025-2030 (%)
Data Table on Europe - Year-over-year growth 2025-2030 (%)
Chart on Regional Comparison - Europe
Data Table on Regional Comparison - Europe

12.4.1 Germany - Market size and forecast 2025-2030

Chart on Germany - Market size and forecast 2025-2030 ($ million)
Data Table on Germany - Market size and forecast 2025-2030 ($ million)
Chart on Germany - Year-over-year growth 2025-2030 (%)
Data Table on Germany - Year-over-year growth 2025-2030 (%)

12.4.2 UK - Market size and forecast 2025-2030

Chart on UK - Market size and forecast 2025-2030 ($ million)
Data Table on UK - Market size and forecast 2025-2030 ($ million)
Chart on UK - Year-over-year growth 2025-2030 (%)
Data Table on UK - Year-over-year growth 2025-2030 (%)

12.4.3 France - Market size and forecast 2025-2030

Chart on France - Market size and forecast 2025-2030 ($ million)
Data Table on France - Market size and forecast 2025-2030 ($ million)
Chart on France - Year-over-year growth 2025-2030 (%)
Data Table on France - Year-over-year growth 2025-2030 (%)

12.4.4 Italy - Market size and forecast 2025-2030

Chart on Italy - Market size and forecast 2025-2030 ($ million)
Data Table on Italy - Market size and forecast 2025-2030 ($ million)
Chart on Italy - Year-over-year growth 2025-2030 (%)
Data Table on Italy - Year-over-year growth 2025-2030 (%)

12.4.5 Spain - Market size and forecast 2025-2030

Chart on Spain - Market size and forecast 2025-2030 ($ million)
Data Table on Spain - Market size and forecast 2025-2030 ($ million)
Chart on Spain - Year-over-year growth 2025-2030 (%)
Data Table on Spain - Year-over-year growth 2025-2030 (%)

12.4.6 The Netherlands - Market size and forecast 2025-2030

Chart on The Netherlands - Market size and forecast 2025-2030 ($ million)
Data Table on The Netherlands - Market size and forecast 2025-2030 ($ million)
Chart on The Netherlands - Year-over-year growth 2025-2030 (%)
Data Table on The Netherlands - Year-over-year growth 2025-2030 (%)

12.5 Asia - Market size and forecast 2025-2030

Chart on Asia - Market size and forecast 2025-2030 ($ million)
Data Table on Asia - Market size and forecast 2025-2030 ($ million)
Chart on Asia - Year-over-year growth 2025-2030 (%)
Data Table on Asia - Year-over-year growth 2025-2030 (%)
Chart on Regional Comparison - Asia
Data Table on Regional Comparison - Asia

12.5.1 China - Market size and forecast 2025-2030

Chart on China - Market size and forecast 2025-2030 ($ million)
Data Table on China - Market size and forecast 2025-2030 ($ million)
Chart on China - Year-over-year growth 2025-2030 (%)
Data Table on China - Year-over-year growth 2025-2030 (%)

12.5.2 Japan - Market size and forecast 2025-2030

Chart on Japan - Market size and forecast 2025-2030 ($ million)
Data Table on Japan - Market size and forecast 2025-2030 ($ million)
Chart on Japan - Year-over-year growth 2025-2030 (%)
Data Table on Japan - Year-over-year growth 2025-2030 (%)

12.5.3 India - Market size and forecast 2025-2030

Chart on India - Market size and forecast 2025-2030 ($ million)
Data Table on India - Market size and forecast 2025-2030 ($ million)
Chart on India - Year-over-year growth 2025-2030 (%)
Data Table on India - Year-over-year growth 2025-2030 (%)

12.5.4 South Korea - Market size and forecast 2025-2030

Chart on South Korea - Market size and forecast 2025-2030 ($ million)
Data Table on South Korea - Market size and forecast 2025-2030 ($ million)
Chart on South Korea - Year-over-year growth 2025-2030 (%)
Data Table on South Korea - Year-over-year growth 2025-2030 (%)

12.5.5 Indonesia - Market size and forecast 2025-2030

Chart on Indonesia - Market size and forecast 2025-2030 ($ million)
Data Table on Indonesia - Market size and forecast 2025-2030 ($ million)
Chart on Indonesia - Year-over-year growth 2025-2030 (%)
Data Table on Indonesia - Year-over-year growth 2025-2030 (%)

12.5.6 Thailand - Market size and forecast 2025-2030

Chart on Thailand - Market size and forecast 2025-2030 ($ million)
Data Table on Thailand - Market size and forecast 2025-2030 ($ million)
Chart on Thailand - Year-over-year growth 2025-2030 (%)
Data Table on Thailand - Year-over-year growth 2025-2030 (%)

12.6 Rest of World (ROW) - Market size and forecast 2025-2030

Chart on Rest of World (ROW) - Market size and forecast 2025-2030 ($ million)
Data Table on Rest of World (ROW) - Market size and forecast 2025-2030 ($ million)
Chart on Rest of World (ROW) - Year-over-year growth 2025-2030 (%)
Data Table on Rest of World (ROW) - Year-over-year growth 2025-2030 (%)
Chart on Regional Comparison - Rest of World (ROW)
Data Table on Regional Comparison - Rest of World (ROW)

12.6.1 Brazil - Market size and forecast 2025-2030

Chart on Brazil - Market size and forecast 2025-2030 ($ million)
Data Table on Brazil - Market size and forecast 2025-2030 ($ million)
Chart on Brazil - Year-over-year growth 2025-2030 (%)
Data Table on Brazil - Year-over-year growth 2025-2030 (%)

12.6.2 Saudi Arabia - Market size and forecast 2025-2030

Chart on Saudi Arabia - Market size and forecast 2025-2030 ($ million)
Data Table on Saudi Arabia - Market size and forecast 2025-2030 ($ million)
Chart on Saudi Arabia - Year-over-year growth 2025-2030 (%)
Data Table on Saudi Arabia - Year-over-year growth 2025-2030 (%)

12.6.3 UAE - Market size and forecast 2025-2030

Chart on UAE - Market size and forecast 2025-2030 ($ million)
Data Table on UAE - Market size and forecast 2025-2030 ($ million)
Chart on UAE - Year-over-year growth 2025-2030 (%)
Data Table on UAE - Year-over-year growth 2025-2030 (%)

12.6.4 Turkey - Market size and forecast 2025-2030

Chart on Turkey - Market size and forecast 2025-2030 ($ million)
Data Table on Turkey - Market size and forecast 2025-2030 ($ million)
Chart on Turkey - Year-over-year growth 2025-2030 (%)
Data Table on Turkey - Year-over-year growth 2025-2030 (%)

12.6.5 Argentina - Market size and forecast 2025-2030

Chart on Argentina - Market size and forecast 2025-2030 ($ million)
Data Table on Argentina - Market size and forecast 2025-2030 ($ million)
Chart on Argentina - Year-over-year growth 2025-2030 (%)
Data Table on Argentina - Year-over-year growth 2025-2030 (%)

12.6.6 Colombia - Market size and forecast 2025-2030

Chart on Colombia - Market size and forecast 2025-2030 ($ million)
Data Table on Colombia - Market size and forecast 2025-2030 ($ million)
Chart on Colombia - Year-over-year growth 2025-2030 (%)
Data Table on Colombia - Year-over-year growth 2025-2030 (%)

12.6.7 South Africa - Market size and forecast 2025-2030

Chart on South Africa - Market size and forecast 2025-2030 ($ million)
Data Table on South Africa - Market size and forecast 2025-2030 ($ million)
Chart on South Africa - Year-over-year growth 2025-2030 (%)
Data Table on South Africa - Year-over-year growth 2025-2030 (%)

12.6.8 Israel - Market size and forecast 2025-2030

Chart on Israel - Market size and forecast 2025-2030 ($ million)
Data Table on Israel - Market size and forecast 2025-2030 ($ million)
Chart on Israel - Year-over-year growth 2025-2030 (%)
Data Table on Israel - Year-over-year growth 2025-2030 (%)

12.7 Market opportunity by geography

Market opportunity by geography ($ million)
Data Tables on Market opportunity by geography ($ million)

13. Drivers, Challenges, and Opportunity

13.1 Market drivers

Increasing geriatric population base accelerates global demand bone graft substitutes
Rising clinical preference dental care remineralization boosts specialized material consumables
Technological advancements nanotechnology integration enhance biological performance tissue engineering scaffolds

13.2 Market challenges

High manufacturing expenditure limits general commercial viability across emerging healthcare markets
Prolonged regulatory evaluation pathways delay rapid introduction innovative bioactive material formulations
Inadequate structural mechanical strength restricts broader clinical deployment load bearing applications

13.3 Impact of drivers and challenges

Impact of drivers and challenges in 2025 and 2030

13.4 Market opportunities

Extensive incorporation mesoporous bioactive glass matrices optimizes targeted localized drug delivery
Growing utilization additive manufacturing architectures enables personalized patient specific orthopedic scaffolds
Rapid penetration antimicrobial ion enriched coatings enhances medical device osseointegration performance

14. Competitive Landscape

14.1 Overview

14.2

Overview on criticality of inputs and factors of differentiation

14.3 Landscape disruption

Overview on factors of disruption

14.4 Industry risks

Impact of key risks on business

15. Competitive Analysis

15.1 Companies profiled

Companies covered

15.2 Company ranking index

15.3 Market positioning of companies

Matrix on companies position and classification

15.4 Arthrex Inc.

Arthrex Inc. - Overview
Arthrex Inc. - Product / Service
Arthrex Inc. - Key offerings
SWOT

15.5 Baxter International Inc.

Baxter International Inc. - Overview
Baxter International Inc. - Business segments
Baxter International Inc. - Key offerings
Baxter International Inc. - Segment focus
SWOT

15.6 Berkeley Advanced Biomaterials

Berkeley Advanced Biomaterials - Overview
Berkeley Advanced Biomaterials - Product / Service
Berkeley Advanced Biomaterials - Key offerings
SWOT

15.7 Biocomposites Ltd.

Biocomposites Ltd. - Overview
Biocomposites Ltd. - Product / Service
Biocomposites Ltd. - Key offerings
SWOT

15.8 BioMin Technologies Ltd.

BioMin Technologies Ltd. - Overview
BioMin Technologies Ltd. - Product / Service
BioMin Technologies Ltd. - Key offerings
SWOT

15.9 BISCO Inc.

BISCO Inc. - Overview
BISCO Inc. - Product / Service
BISCO Inc. - Key offerings
SWOT

15.10 Bonalive Biomaterials Ltd.

Bonalive Biomaterials Ltd. - Overview
Bonalive Biomaterials Ltd. - Product / Service
Bonalive Biomaterials Ltd. - Key offerings
SWOT

15.11 Ed. Geistlich Sohne AG

Ed. Geistlich Sohne AG - Overview
Ed. Geistlich Sohne AG - Product / Service
Ed. Geistlich Sohne AG - Key offerings
SWOT

15.12 GC Corp.

GC Corp. - Overview
GC Corp. - Product / Service
GC Corp. - Key offerings
SWOT

15.13 GNI Group Ltd.

GNI Group Ltd. - Overview
GNI Group Ltd. - Product / Service
GNI Group Ltd. - Key offerings
SWOT

15.14 Medtronic Plc

Medtronic Plc - Overview
Medtronic Plc - Business segments
Medtronic Plc - Key news
Medtronic Plc - Key offerings
Medtronic Plc - Segment focus
SWOT

15.15 SCHOTT AG

SCHOTT AG - Overview
SCHOTT AG - Product / Service
SCHOTT AG - Key offerings
SWOT

15.16 Stryker Corp.

Stryker Corp. - Overview
Stryker Corp. - Business segments
Stryker Corp. - Key offerings
Stryker Corp. - Segment focus
SWOT

15.17 Synthera Lifesciences Pvt. Ltd.

Synthera Lifesciences Pvt. Ltd. - Overview
Synthera Lifesciences Pvt. Ltd. - Product / Service
Synthera Lifesciences Pvt. Ltd. - Key offerings
SWOT

15.18 Zimmer Biomet Holdings Inc.

Zimmer Biomet Holdings Inc. - Overview
Zimmer Biomet Holdings Inc. - Business segments
Zimmer Biomet Holdings Inc. - Key news
Zimmer Biomet Holdings Inc. - Key offerings
Zimmer Biomet Holdings Inc. - Segment focus
SWOT

16. Appendix

16.1 Scope of the report

Market definition
Objectives
Notes and caveats

16.2 Inclusions and exclusions checklist

Inclusions checklist
Exclusions checklist

16.3 Currency conversion rates for US$

16.4 Research methodology

16.5 Data procurement

Information sources

16.6 Data validation

16.7 Validation techniques employed for market sizing

16.8 Data synthesis

16.9 360 degree market analysis

16.10 List of abbreviations

Research Methodology

Technavio presents a detailed picture of the market by way of study, synthesis, and summation of data from multiple sources. The analysts have presented the various facets of the market with a particular focus on identifying the key industry influencers. The data thus presented is comprehensive, reliable, and the result of extensive research, both primary and secondary.

INFORMATION SOURCES

Primary sources

  • Manufacturers and suppliers
  • Channel partners
  • Industry experts
  • Strategic decision makers

Secondary sources

  • Industry journals and periodicals
  • Government data
  • Financial reports of key industry players
  • Historical data
  • Press releases

DATA ANALYSIS

Data Synthesis

  • Collation of data
  • Estimation of key figures
  • Analysis of derived insights

Data Validation

  • Triangulation with data models
  • Reference against proprietary databases
  • Corroboration with industry experts

REPORT WRITING

Qualitative

  • Market drivers
  • Market challenges
  • Market trends
  • Five forces analysis

Quantitative

  • Market size and forecast
  • Market segmentation
  • Geographical insights
  • Competitive landscape

Interested in this report?

Get your sample now to see our research methodology and insights!

Download Now

Frequently Asked Questions

Bioactive Glass market growth will increase by USD 2085.0 million during 2026-2030.

The Bioactive Glass market is expected to grow at a CAGR of 20.8% during 2026-2030.

Bioactive Glass market is segmented by Product (Silicate-based glass, Phosphate-based glass, Borate-based glass) Application (Medical, Dentistry, Cosmetics, Others) Form factor (Powders and nano-powders, Granules)

Arthrex Inc., Baxter International Inc., Berkeley Advanced Biomaterials, Biocomposites Ltd., BioMin Technologies Ltd., BISCO Inc., Bonalive Biomaterials Ltd., BoneSupport Holding AB, CAM Bioceramics BV, Ed. Geistlich Sohne AG, GC Corp., GNI Group Ltd., Medtronic Plc, Mo Sci Corp., NORAKER, NovaBone Products LLC, SCHOTT AG, Stryker Corp., Synthera Lifesciences Pvt. Ltd., Zimmer Biomet Holdings Inc. are a few of the key vendors in the Bioactive Glass market.

North America will register the highest growth rate of 42.7% among the other regions. Therefore, the Bioactive Glass market in North America is expected to garner significant business opportunities for the vendors during the forecast period.

US, Canada, Mexico, Germany, UK, France, Italy, Spain, The Netherlands, China, Japan, India, South Korea, Indonesia, Thailand, Brazil, Saudi Arabia, UAE, Turkey, Argentina, Colombia, South Africa, Israel

  • Increasing geriatric population base accelerates global demand bone graft substitutes is the driving factor this market.

The Bioactive Glass market vendors should focus on grabbing business opportunities from the Product segment as it accounted for the largest market share in the base year.
RIA - Research AI Assistant
Ask RIA
