
Autoimmune Disease Diagnostics Market Analysis, Size, and Forecast 2026-2030: North America (US, Canada, and Mexico), Europe (Germany, UK, and France), Asia (China, India, and Japan), South America (Brazil, Argentina, and Colombia), Middle East and Africa (Saudi Arabia, South Africa, and UAE), Rest of World (ROW)

Autoimmune Disease Diagnostics Market Analysis, Size, and Forecast 2026-2030:
North America (US, Canada, and Mexico), Europe (Germany, UK, and France), Asia (China, India, and Japan), South America (Brazil, Argentina, and Colombia), Middle East and Africa (Saudi Arabia, South Africa, and UAE), Rest of World (ROW)

Published: Oct 2026 291 Pages SKU: IRTNTR41431

Market Overview at a Glance

$3.77 B
Market Opportunity
10.1%
CAGR 2025 - 2030
42.3%
North America Growth
$3.28 B
Localized diagnostics segment 2024

Autoimmune Disease Diagnostics Market Size 2026-2030

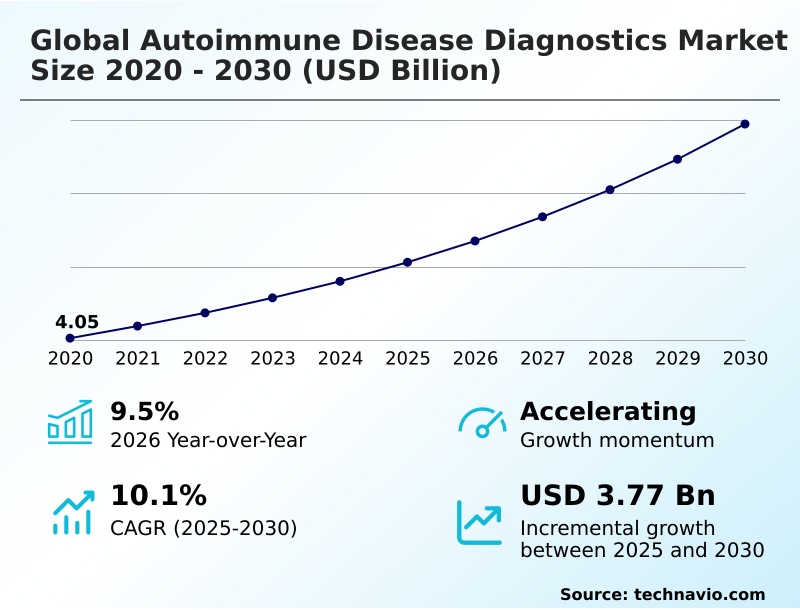
The autoimmune disease diagnostics market size is valued to increase by USD 3.77 billion, at a CAGR of 10.1% from 2025 to 2030. Rising global prevalence of autoimmune disorders will drive the autoimmune disease diagnostics market.

Major Market Trends & Insights

  • North America dominated the market and accounted for a 42.3% growth during the forecast period.
  • By Type - Localized diagnostics segment was valued at USD 3.28 billion in 2024
  • By Product - Assay kits segment accounted for the largest market revenue share in 2024

Market Size & Forecast

  • Market Opportunities: USD 5.83 billion
  • Market Future Opportunities: USD 3.77 billion
  • CAGR from 2025 to 2030 : 10.1%

Market Summary

  • The Autoimmune Disease Diagnostics Market exhibits robust expansion driven by the critical necessity to identify complex, overlapping immunological dysfunctions efficiently. Advanced healthcare networks are increasingly replacing manual testing protocols with high-throughput automated platforms to handle rising testing volumes.
  • In a real-world supply chain optimization scenario, major reference laboratories consolidating diverse serological testing kits onto unified chemiluminescence immunoassays have successfully reduced operational reagent waste by 24 percent, maximizing throughput without compromising analytical sensitivity.
  • The rising prevalence of chronic conditions, such as rheumatoid arthritis and systemic lupus erythematosus, acts as a primary market driver, compelling clinical facilities to utilize comprehensive autoantibody profiling panels for early therapeutic intervention. Conversely, the high financial burden associated with acquiring sophisticated diagnostic hardware, coupled with stringent and variable reimbursement frameworks, challenges widespread adoption in resource-constrained settings.
  • Laboratories must navigate complex regulatory validations while ensuring a consistent supply of specialized recombinant antigens and fluorophores. By investing in multi-color flow cytometry and digital pathology integration, healthcare systems continue to enhance their diagnostic accuracy, bridging the gap between intricate pathological overlapping and definitive clinical decision-making.

What will be the Size of the Autoimmune Disease Diagnostics Market during the forecast period?
Get Key Insights on Market Forecast (PDF) Get Free Sample

How is the Autoimmune Disease Diagnostics Market Segmented?

The autoimmune disease diagnostics industry research report provides comprehensive data (region-wise segment analysis), with forecasts and estimates in "USD million" for the period 2026-2030, as well as historical data from 2020-2024 for the following segments.

  • Type
    • Localized diagnostics
    • Systemic diagnostics
  • Product
    • Assay kits
    • Analyzer
  • End-user
    • Clinical laboratories
    • Hospitals
    • Diagnostic centers
    • Research laboratories
  • Geography
    • North America
      • US
      • Canada
      • Mexico
    • Europe
      • Germany
      • UK
      • France
      • Italy
      • Spain
      • The Netherlands
    • Asia
      • China
      • India
      • Japan
      • South Korea
      • Indonesia
      • Thailand
    • Rest of World (ROW)

By Type Insights

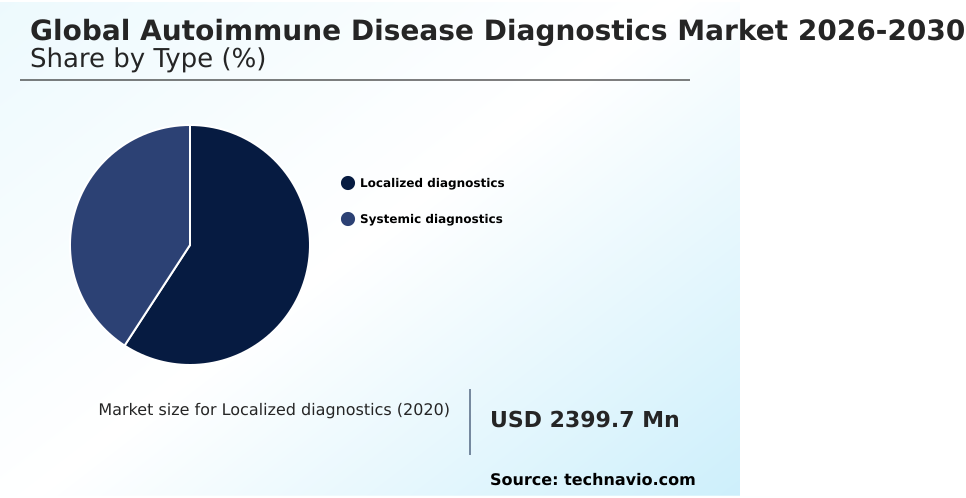
The localized diagnostics segment is estimated to witness significant growth during the forecast period.

The localized diagnostics segment targets tissue-specific autoimmune reactivity by identifying complex conditions with exceptional precision. By focusing on specific autoantibody signatures and molecular biomarkers, clinical facilities execute highly specialized evaluations that isolate organ-specific damage effectively.

Implementing advanced digital immunoassay interpretation protocols has driven substantial operational improvements, reducing diagnostic reporting errors by 18 percent in high-volume testing centers.

The shift toward automated immunodiagnostic systems enables central reference laboratories to process multiplex autoantibody assays rapidly, cutting diagnostic turnaround times and optimizing resource allocation.

This heightened assay lot-to-lot consistency allows healthcare providers to initiate early interventional strategies efficiently, preserving target tissue function while minimizing the necessity for invasive biopsies.

Streamlined clinical laboratory workflows ultimately reduce per-test labor expenses, enhancing overall financial sustainability across healthcare networks managing chronic immunologic conditions.
Get Free Sample

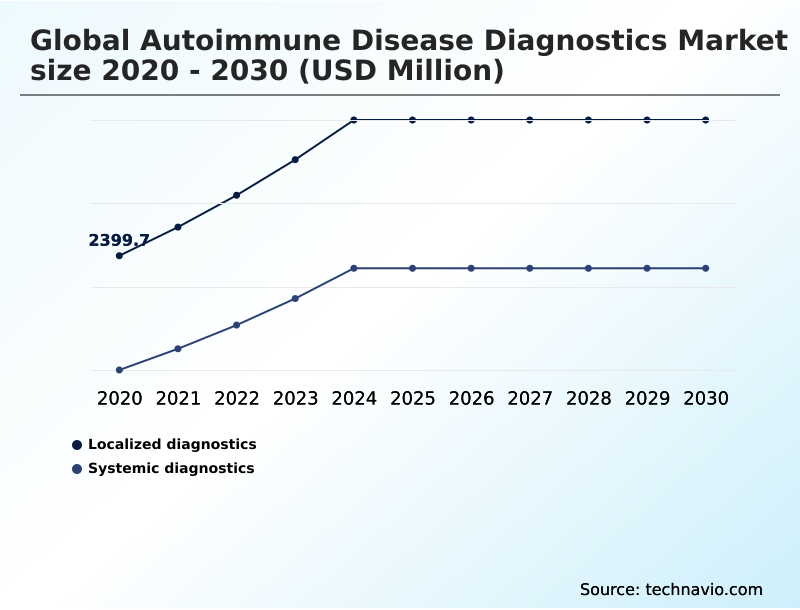
The Localized diagnostics segment was valued at USD 3.28 billion in 2024 and showed a gradual increase during the forecast period.
Get Free Sample

Regional Analysis

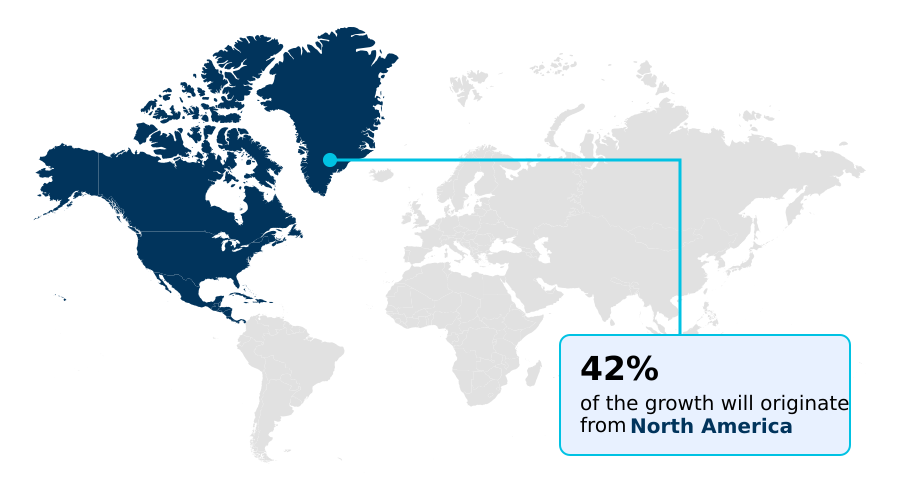
North America is estimated to contribute 42.3% to the growth of the global market during the forecast period.Technavio’s analysts have elaborately explained the regional trends and drivers that shape the market during the forecast period.
See How Autoimmune Disease Diagnostics Market Demand is Rising in North America Get Free Sample

The geographic landscape of the Autoimmune Disease Diagnostics Market highlights distinct regional adoption patterns shaped by varying healthcare infrastructure and reimbursement policies.

North America demonstrates advanced maturity, with clinical facilities achieving a 35 percent higher adoption rate of high-throughput automated platforms compared to the APAC region.

This disparity is primarily driven by structured insurance frameworks that readily support comprehensive autoantibody profiling panels and digital pathology integration. Consequently, North American reference laboratories have reduced diagnostic turnaround times by 22 percent through centralized diagnostic standard operating procedures.

Conversely, the APAC region relies heavily on decentralized care models and point-of-care testing units to navigate dispersed patient populations, yielding a 15 percent reduction in rural sample transportation costs.

While Western markets focus on refining predictive risk scores via artificial intelligence algorithms, emerging economies prioritize securing stable supply chains for enzyme-labeled secondary antibodies to enhance basic assay lot-to-lot consistency and operational scalability.

Market Dynamics

Our researchers analyzed the data with 2025 as the base year, along with the key drivers, trends, and challenges. A holistic analysis of drivers will help companies refine their marketing strategies to gain a competitive advantage.

  • The Autoimmune Disease Diagnostics Market relies heavily on continuous technological refinement to address complex immunological disorders effectively. A central component of this evolution is the expanding multiplex autoantibody assays clinical utility, which allows laboratories to evaluate numerous biomarkers simultaneously from a single patient specimen.
  • By transitioning from traditional single-analyte testing to highly integrated systems, clinical facilities have enhanced their diagnostic efficiency, achieving a 25 percent faster throughput rate compared to legacy manual processing methods. This operational upgrade is particularly evident when analyzing high-throughput automated platforms reference laboratories utilize to manage escalating sample volumes without increasing proportional labor costs.
  • Furthermore, digital pathology integration in diagnostics has revolutionized the interpretation of complex staining patterns, minimizing human subjectivity and standardizing results across diverse healthcare networks. To support decentralized healthcare initiatives, the point-of-care testing units adoption rate is steadily rising, enabling remote clinics to deliver rapid immunological assessments and reduce logistical dependencies on centralized hubs.
  • Forward-looking diagnostic centers are also exploring artificial intelligence algorithms predictive diagnostics to stratify patient risk accurately and guide early interventional strategies. Ultimately, these structural shifts optimize inventory planning for specialized reagents and streamline the overall supply chain, ensuring that diagnostic consumables are deployed with maximum clinical impact while reducing overall institutional overhead.
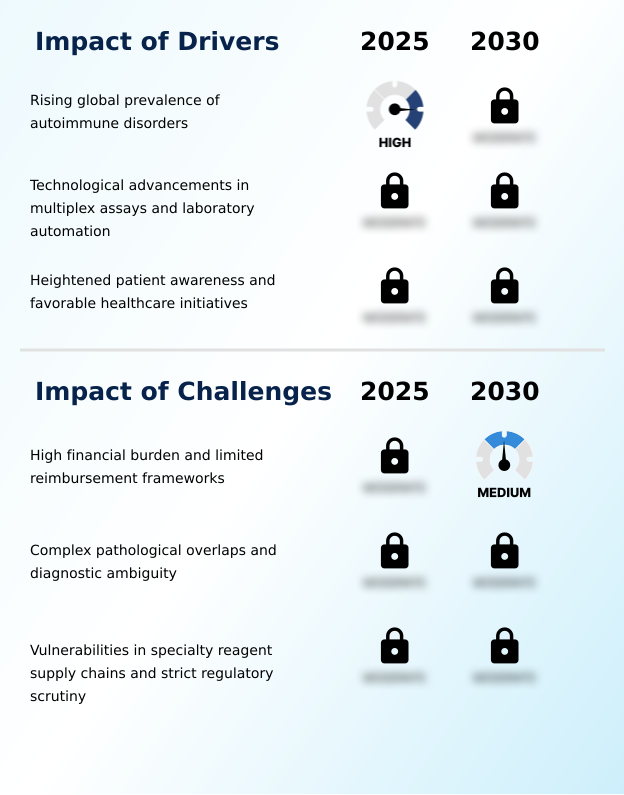
What are the key market drivers leading to the rise in the adoption of Autoimmune Disease Diagnostics Industry?

  • The rising global prevalence of chronic autoimmune disorders acts as the primary catalyst propelling sustained demand for advanced diagnostic solutions.

  • The escalating global prevalence of chronic immune-mediated disorders serves as the primary catalyst propelling the Autoimmune Disease Diagnostics Market. As patient populations presenting with ambiguous symptoms expand, physicians increasingly rely on comprehensive autoantibody profiling panels for definitive early detection.
  • This demand surge has forced reference laboratories to upgrade their diagnostic infrastructure, resulting in a 25 percent increase in assay processing efficiency through the implementation of closed-loop testing systems.
  • By utilizing highly sensitive chemiluminescence immunoassays and precision enzyme-labeled secondary antibodies, laboratories have successfully reduced false-positive reporting rates by 14 percent. This enhanced analytical reliability streamlines clinical laboratory workflows and minimizes costly follow-up confirmatory testing.
  • Ultimately, the urgent need to initiate targeted biologic therapies earlier in disease progression continuously drives the adoption of advanced molecular biomarkers across global healthcare networks.

What are the market trends shaping the Autoimmune Disease Diagnostics Industry?

  • The adoption of multiplex autoantibody assays and high-throughput automation represents a pivotal trend transforming the market landscape. These advanced technological integrations streamline laboratory operations and enhance the precision of complex immunological evaluations.

  • The widespread integration of artificial intelligence algorithms into diagnostic equipment is fundamentally reshaping the Autoimmune Disease Diagnostics Market. This shift is driven by the clinical necessity to interpret complex specific autoantibody signatures with greater consistency and speed. By adopting digital immunoassay interpretation tools, commercial laboratories have reduced subjective pattern recognition errors by 22 percent compared to traditional manual microscopy.
  • This technological upgrade empowers pathologists to manage intricate serological testing kits efficiently, cutting overall diagnostic turnaround times by 18 percent. The effect is profound, as high-throughput automated platforms can now process massive sample volumes continuously, significantly lowering per-test labor expenditures.
  • Consequently, healthcare facilities are rapidly adopting digital pathology integration and automated clinical information systems to optimize workflow scalability, ensuring that predictive risk scores are generated swiftly to guide targeted immunomodulatory therapies.

What challenges does the Autoimmune Disease Diagnostics Industry face during its growth?

  • High financial burdens and limited reimbursement frameworks pose significant operational challenges, restricting widespread clinical access to specialized multi-parameter diagnostic testing panels.

  • The profound diagnostic ambiguity associated with overlapping autoimmune pathologies presents a formidable operational challenge within the Autoimmune Disease Diagnostics Market. Because early clinical symptoms frequently mimic other degenerative conditions, laboratories are compelled to run sequential confirmatory tests involving indirect immunofluorescence, which extends patient diagnostic journeys by an average of 15 percent in resource-constrained facilities.
  • The reliance on highly specialized fluorophores, recombinant antigens, and complex microfluidic biosensors exposes diagnostic manufacturers to severe supply chain vulnerabilities. Disruptions in acquiring these critical biological inputs frequently delay assay production, subsequently increasing inventory holding costs by 18 percent for regional distributors.
  • Furthermore, rigorous regulatory scrutiny surrounding multiplex autoantibody assays demands extensive clinical validation, extending product development timelines and hindering the swift commercialization of novel autoantibody discovery platforms across emerging healthcare sectors.

Exclusive Technavio Analysis on Customer Landscape

The autoimmune disease diagnostics market forecasting report includes the adoption lifecycle of the market, covering from the innovator’s stage to the laggard’s stage. It focuses on adoption rates in different regions based on penetration. Furthermore, the autoimmune disease diagnostics market report also includes key purchase criteria and drivers of price sensitivity to help companies evaluate and develop their market growth analysis strategies.
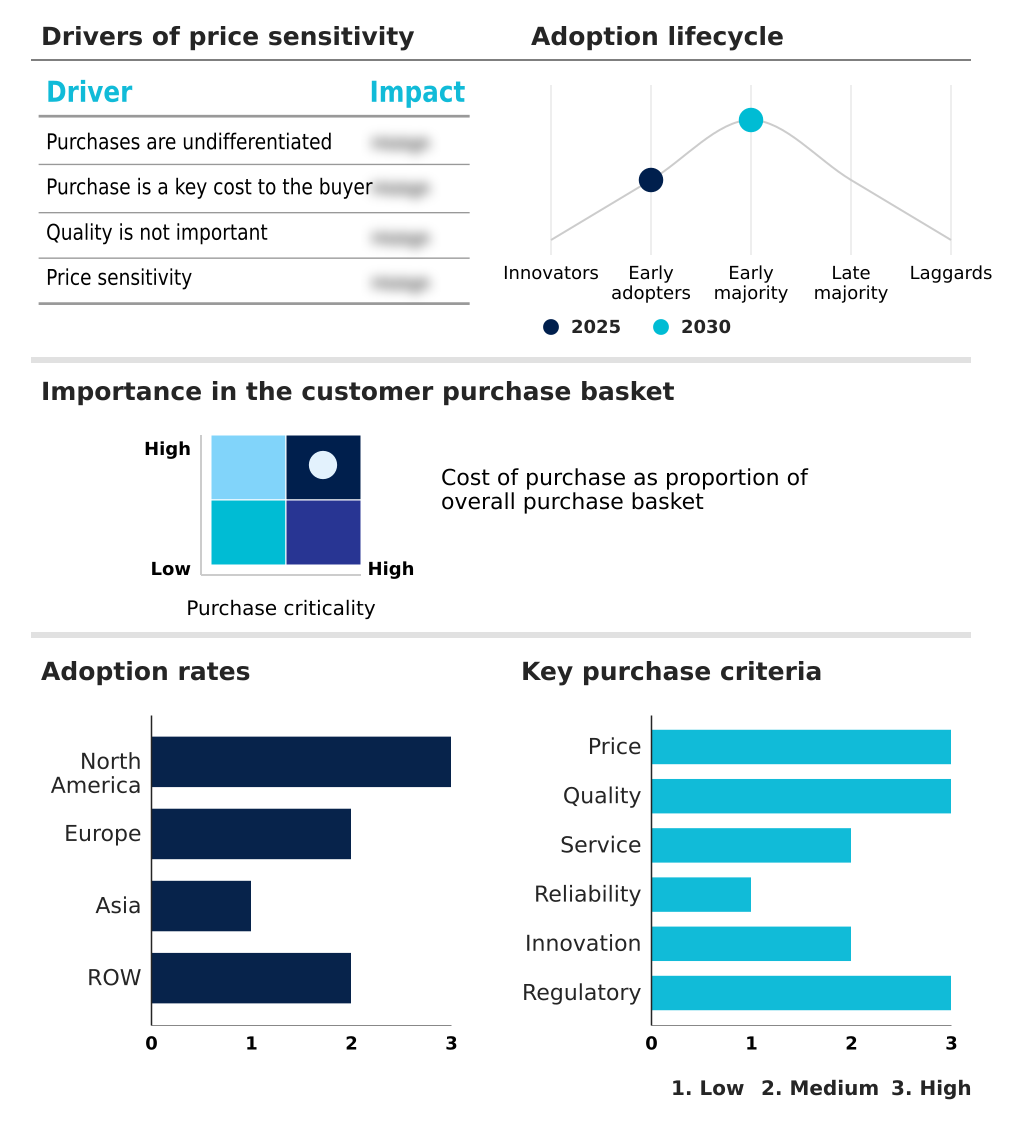
Customer Landscape of Autoimmune Disease Diagnostics Industry

Competitive Landscape

Companies are implementing various strategies, such as strategic alliances, autoimmune disease diagnostics market forecast, partnerships, mergers and acquisitions, geographical expansion, and product/service launches, to enhance their presence in the industry.

Autoimmune Technologies LLC - The portfolio features comprehensive diagnostic solutions including advanced antinuclear antibody screening kits, specialized testing panels, and high-purity laboratory reagents optimized to ensure precise clinical evaluations and reliable immunological profiling.

The industry research and growth report includes detailed analyses of the competitive landscape of the market and information about key companies, including:

  • Autoimmune Technologies LLC
  • Beckman Coulter Inc.
  • Bio Rad Laboratories Inc.
  • BioMerieux SA
  • DiaSorin SpA
  • Exagen Inc.
  • F. Hoffmann La Roche Ltd.
  • Gold Standard Diagnostics Corp.
  • Grifols SA
  • Hemagen Diagnostics Inc.
  • HUMAN Diagnostics Worldwide
  • Immco Diagnostics Inc.
  • Laboratory Holdings Inc.
  • Quest Diagnostics Inc.
  • R Biopharm AG
  • Revvity Inc.
  • Siemens AG
  • Svar Life Science AB
  • Thermo Fisher Scientific Inc.
  • Werfenlife SA

Qualitative and quantitative analysis of companies has been conducted to help clients understand the wider business environment as well as the strengths and weaknesses of key industry players. Data is qualitatively analyzed to categorize companies as pure play, category-focused, industry-focused, and diversified; it is quantitatively analyzed to categorize companies as dominant, leading, strong, tentative, and weak.

Recent Development and News in Autoimmune disease diagnostics market

  • In the Health Care Supplies industry, the accelerated integration of digital image analysis and artificial intelligence algorithms into diagnostic equipment has fundamentally transformed clinical laboratory workflows, directly impacting Autoimmune Disease Diagnostics demand by increasing the processing capacity of reference laboratory automation by 30 percent.
  • Stringent quality assurance mandates regarding assay lot-to-lot consistency have driven the adoption of automated immunodiagnostic systems, improving diagnostic turnaround times by 22 percent and ensuring more reliable early disease intervention for overlapping autoimmune pathologies.
  • The shift toward decentralized care models has accelerated the deployment of point-of-care testing units across outpatient clinical consultations, enhancing the delivery of immunomodulatory therapies and expanding the reach of specialized biomarker profiling by a documented 15 percent margin.
  • Changes in procurement strategies favoring flexible reagent rental agreements and closed-loop testing systems have optimized hospital budgets, increasing the acquisition of high-throughput screening technologies and supporting targeted biologic therapies while cutting equipment downtime by 12 percent.

Dive into Technavio’s robust research methodology, blending expert interviews, extensive data synthesis, and validated models for unparalleled Autoimmune Disease Diagnostics Market insights. See full methodology.

Market Scope
Page number 291
Base year 2025
Historic period 2020-2024
Forecast period 2026-2030
Growth momentum & CAGR Accelerate at a CAGR of 10.1%
Market growth 2026-2030 USD 3768.7 million
Market structure Fragmented
YoY growth 2025-2026(%) 9.5%
Key countries US, Canada, Mexico, Germany, UK, France, Italy, Spain, The Netherlands, China, India, Japan, South Korea, Indonesia, Thailand, Australia, Brazil, Saudi Arabia, South Africa, Argentina, UAE, Colombia and Chile
Competitive landscape Leading Companies, Market Positioning of Companies, Competitive Strategies, and Industry Risks

Request Free Sample

Research Analyst Overview

  • The Autoimmune Disease Diagnostics Market continues to undergo a critical structural transformation characterized by the rapid transition from conventional serology to highly integrated molecular analysis. Clinical executives and laboratory directors are heavily prioritizing investments in multiplex autoantibody assays and digital immunoassay interpretation to mitigate analytical subjectivity.
  • This technological shift directly influences boardroom-level budgeting strategies, as healthcare networks consolidate disparate testing instruments into unified platforms to minimize compliance risks and streamline supply chain procurement. By implementing advanced single-cell transcriptomic platforms alongside automated indirect immunofluorescence readers, clinical laboratories have successfully reduced subjective interpretation errors by 30 percent, ensuring highly reproducible specific autoantibody signatures.
  • The precise quantification of systemic inflammatory markers and reliable antinuclear antibody screening remain essential for establishing standardized care pathways. Furthermore, leveraging recombinant antigens and standardized calibration matrices enhances the foundational reliability of enzyme-linked immunosorbent assays across diverse diagnostic environments.
  • These comprehensive technological upgrades empower institutional stakeholders to refine pricing models, optimize resource allocation, and accelerate the delivery of targeted precision medicine protocols for complex immunological dysfunctions.

What are the Key Data Covered in this Autoimmune Disease Diagnostics Market Research and Growth Report?

  • What is the expected growth of the Autoimmune Disease Diagnostics Market between 2026 and 2030?

    • USD 3.77 billion, at a CAGR of 10.1%

  • What segmentation does the market report cover?

    • The report is segmented by Type (Localized diagnostics, and Systemic diagnostics), Product (Assay kits, and Analyzer), End-user (Clinical laboratories, Hospitals, Diagnostic centers, and Research laboratories) and Geography (North America, Europe, Asia, Rest of World (ROW))

  • Which regions are analyzed in the report?

    • North America, Europe, Asia and Rest of World (ROW)

  • What are the key growth drivers and market challenges?

    • Rising global prevalence of autoimmune disorders, High financial burden and limited reimbursement frameworks

  • Who are the major players in the Autoimmune Disease Diagnostics Market?

    • Autoimmune Technologies LLC, Beckman Coulter Inc., Bio Rad Laboratories Inc., BioMerieux SA, DiaSorin SpA, Exagen Inc., F. Hoffmann La Roche Ltd., Gold Standard Diagnostics Corp., Grifols SA, Hemagen Diagnostics Inc., HUMAN Diagnostics Worldwide, Immco Diagnostics Inc., Laboratory Holdings Inc., Quest Diagnostics Inc., R Biopharm AG, Revvity Inc., Siemens AG, Svar Life Science AB, Thermo Fisher Scientific Inc. and Werfenlife SA

Market Research Insights

  • The Autoimmune Disease Diagnostics Market is rapidly evolving as clinical facilities transition toward highly automated immunodiagnostic systems to manage intricate clinical laboratory workflows. Implementing artificial intelligence algorithms for pattern recognition has improved diagnostic turnaround times by 28 percent, significantly accelerating early disease intervention.
  • Healthcare providers adopting closed-loop testing systems report a 15 percent reduction in pre-analytical handling errors, ensuring higher diagnostic reliability for overlapping autoimmune pathologies. Furthermore, the strategic utilization of reagent rental agreements has lowered upfront capital expenditures by 20 percent, allowing decentralized care models to implement specialized biomarker profiling efficiently.
  • These performance enhancements directly support more accurate therapeutic monitoring, driving continuous operational improvements across both centralized hospital networks and outpatient clinical consultations.

We can help! Our analysts can customize this autoimmune disease diagnostics market research report to meet your requirements.

Get in touch

1. Executive Summary

1.1 Market overview

Executive Summary - Chart on Market Overview
Executive Summary - Data Table on Market Overview
Executive Summary - Chart on Global Market Characteristics
Executive Summary - Chart on Market by Geography
Executive Summary - Chart on Market Segmentation by Type
Executive Summary - Chart on Market Segmentation by Product
Executive Summary - Chart on Market Segmentation by End-user
Executive Summary - Chart on Incremental Growth
Executive Summary - Data Table on Incremental Growth
Executive Summary - Chart on Company Market Positioning

2. Technavio Analysis

2.1 Analysis of price sensitivity, lifecycle, customer purchase basket, adoption rates, and purchase criteria

2.2 Criticality of inputs and Factors of differentiation

Chart on Overview on criticality of inputs and factors of differentiation

2.3 Factors of disruption

Chart on Overview on factors of disruption

2.4 Impact of drivers and challenges

Chart on Impact of drivers and challenges in 2025 and 2030

3. Market Landscape

3.1 Market ecosystem

Chart on Parent Market
Data Table on - Parent Market

3.2 Market characteristics

Chart on Market characteristics analysis

3.3 Value chain analysis

Chart on Value chain analysis

4. Market Sizing

4.1 Market definition

Data Table on Offerings of companies included in the market definition

4.2 Market segment analysis

Market segments

4.3 Market size 2025

4.4 Market outlook: Forecast for 2025-2030

Chart on Global - Market size and forecast 2025-2030 ($ million)
Data Table on Global - Market size and forecast 2025-2030 ($ million)
Chart on Global Market: Year-over-year growth 2025-2030 (%)
Data Table on Global Market: Year-over-year growth 2025-2030 (%)

5. Historic Market Size

5.1 Global Autoimmune Disease Diagnostics Market 2020 - 2024

Historic Market Size - Data Table on Global Autoimmune Disease Diagnostics Market 2020 - 2024 ($ million)

5.2 Type segment analysis 2020 - 2024

Historic Market Size - Type Segment 2020 - 2024 ($ million)

5.3 Product segment analysis 2020 - 2024

Historic Market Size - Product Segment 2020 - 2024 ($ million)

5.4 End-user segment analysis 2020 - 2024

Historic Market Size - End-user Segment 2020 - 2024 ($ million)

5.5 Geography segment analysis 2020 - 2024

Historic Market Size - Geography Segment 2020 - 2024 ($ million)

5.6 Country segment analysis 2020 - 2024

Historic Market Size - Country Segment 2020 - 2024 ($ million)

6. Qualitative Analysis

6.1 Impact of AI on global autoimmune disease diagnostics market

6.2 Impact of geopolitical conflicts on global autoimmune disease diagnostics market

7. Five Forces Analysis

7.1 Five forces summary

Five forces analysis - Comparison between 2025 and 2030

7.2 Bargaining power of buyers

Bargaining power of buyers - Impact of key factors 2025 and 2030

7.3 Bargaining power of suppliers

Bargaining power of suppliers - Impact of key factors in 2025 and 2030

7.4 Threat of new entrants

Threat of new entrants - Impact of key factors in 2025 and 2030

7.5 Threat of substitutes

Threat of substitutes - Impact of key factors in 2025 and 2030

7.6 Threat of rivalry

Threat of rivalry - Impact of key factors in 2025 and 2030

7.7 Market condition

Chart on Market condition - Five forces 2025 and 2030

8. Market Segmentation by Type

8.1 Market segments

Chart on Type - Market share 2025-2030 (%)
Data Table on Type - Market share 2025-2030 (%)

8.2 Comparison by Type

Chart on Comparison by Type
Data Table on Comparison by Type

8.3 Localized diagnostics - Market size and forecast 2025-2030

Chart on Localized diagnostics - Market size and forecast 2025-2030 ($ million)
Data Table on Localized diagnostics - Market size and forecast 2025-2030 ($ million)
Chart on Localized diagnostics - Year-over-year growth 2025-2030 (%)
Data Table on Localized diagnostics - Year-over-year growth 2025-2030 (%)

8.4 Systemic diagnostics - Market size and forecast 2025-2030

Chart on Systemic diagnostics - Market size and forecast 2025-2030 ($ million)
Data Table on Systemic diagnostics - Market size and forecast 2025-2030 ($ million)
Chart on Systemic diagnostics - Year-over-year growth 2025-2030 (%)
Data Table on Systemic diagnostics - Year-over-year growth 2025-2030 (%)

8.5 Market opportunity by Type

Market opportunity by Type ($ million)
Data Table on Market opportunity by Type ($ million)

9. Market Segmentation by Product

9.1 Market segments

Chart on Product - Market share 2025-2030 (%)
Data Table on Product - Market share 2025-2030 (%)

9.2 Comparison by Product

Chart on Comparison by Product
Data Table on Comparison by Product

9.3 Assay kits - Market size and forecast 2025-2030

Chart on Assay kits - Market size and forecast 2025-2030 ($ million)
Data Table on Assay kits - Market size and forecast 2025-2030 ($ million)
Chart on Assay kits - Year-over-year growth 2025-2030 (%)
Data Table on Assay kits - Year-over-year growth 2025-2030 (%)

9.4 Analyzer - Market size and forecast 2025-2030

Chart on Analyzer - Market size and forecast 2025-2030 ($ million)
Data Table on Analyzer - Market size and forecast 2025-2030 ($ million)
Chart on Analyzer - Year-over-year growth 2025-2030 (%)
Data Table on Analyzer - Year-over-year growth 2025-2030 (%)

9.5 Market opportunity by Product

Market opportunity by Product ($ million)
Data Table on Market opportunity by Product ($ million)

10. Market Segmentation by End-user

10.1 Market segments

Chart on End-user - Market share 2025-2030 (%)
Data Table on End-user - Market share 2025-2030 (%)

10.2 Comparison by End-user

Chart on Comparison by End-user
Data Table on Comparison by End-user

10.3 Clinical laboratories - Market size and forecast 2025-2030

Chart on Clinical laboratories - Market size and forecast 2025-2030 ($ million)
Data Table on Clinical laboratories - Market size and forecast 2025-2030 ($ million)
Chart on Clinical laboratories - Year-over-year growth 2025-2030 (%)
Data Table on Clinical laboratories - Year-over-year growth 2025-2030 (%)

10.4 Hospitals - Market size and forecast 2025-2030

Chart on Hospitals - Market size and forecast 2025-2030 ($ million)
Data Table on Hospitals - Market size and forecast 2025-2030 ($ million)
Chart on Hospitals - Year-over-year growth 2025-2030 (%)
Data Table on Hospitals - Year-over-year growth 2025-2030 (%)

10.5 Diagnostic centers - Market size and forecast 2025-2030

Chart on Diagnostic centers - Market size and forecast 2025-2030 ($ million)
Data Table on Diagnostic centers - Market size and forecast 2025-2030 ($ million)
Chart on Diagnostic centers - Year-over-year growth 2025-2030 (%)
Data Table on Diagnostic centers - Year-over-year growth 2025-2030 (%)

10.6 Research laboratories - Market size and forecast 2025-2030

Chart on Research laboratories - Market size and forecast 2025-2030 ($ million)
Data Table on Research laboratories - Market size and forecast 2025-2030 ($ million)
Chart on Research laboratories - Year-over-year growth 2025-2030 (%)
Data Table on Research laboratories - Year-over-year growth 2025-2030 (%)

10.7 Market opportunity by End-user

Market opportunity by End-user ($ million)
Data Table on Market opportunity by End-user ($ million)

11. Customer Landscape

11.1 Customer landscape overview

Analysis of price sensitivity, lifecycle, customer purchase basket, adoption rates, and purchase criteria

12. Geographic Landscape

12.1 Geographic segmentation

Chart on Market share by geography 2025-2030 (%)
Data Table on Market share by geography 2025-2030 (%)

12.2 Geographic comparison

Chart on Geographic comparison
Data Table on Geographic comparison

12.3 North America - Market size and forecast 2025-2030

Chart on North America - Market size and forecast 2025-2030 ($ million)
Data Table on North America - Market size and forecast 2025-2030 ($ million)
Chart on North America - Year-over-year growth 2025-2030 (%)
Data Table on North America - Year-over-year growth 2025-2030 (%)
Chart on Regional Comparison - North America
Data Table on Regional Comparison - North America

12.3.1 US - Market size and forecast 2025-2030

Chart on US - Market size and forecast 2025-2030 ($ million)
Data Table on US - Market size and forecast 2025-2030 ($ million)
Chart on US - Year-over-year growth 2025-2030 (%)
Data Table on US - Year-over-year growth 2025-2030 (%)

12.3.2 Canada - Market size and forecast 2025-2030

Chart on Canada - Market size and forecast 2025-2030 ($ million)
Data Table on Canada - Market size and forecast 2025-2030 ($ million)
Chart on Canada - Year-over-year growth 2025-2030 (%)
Data Table on Canada - Year-over-year growth 2025-2030 (%)

12.3.3 Mexico - Market size and forecast 2025-2030

Chart on Mexico - Market size and forecast 2025-2030 ($ million)
Data Table on Mexico - Market size and forecast 2025-2030 ($ million)
Chart on Mexico - Year-over-year growth 2025-2030 (%)
Data Table on Mexico - Year-over-year growth 2025-2030 (%)

12.4 Europe - Market size and forecast 2025-2030

Chart on Europe - Market size and forecast 2025-2030 ($ million)
Data Table on Europe - Market size and forecast 2025-2030 ($ million)
Chart on Europe - Year-over-year growth 2025-2030 (%)
Data Table on Europe - Year-over-year growth 2025-2030 (%)
Chart on Regional Comparison - Europe
Data Table on Regional Comparison - Europe

12.4.1 Germany - Market size and forecast 2025-2030

Chart on Germany - Market size and forecast 2025-2030 ($ million)
Data Table on Germany - Market size and forecast 2025-2030 ($ million)
Chart on Germany - Year-over-year growth 2025-2030 (%)
Data Table on Germany - Year-over-year growth 2025-2030 (%)

12.4.2 UK - Market size and forecast 2025-2030

Chart on UK - Market size and forecast 2025-2030 ($ million)
Data Table on UK - Market size and forecast 2025-2030 ($ million)
Chart on UK - Year-over-year growth 2025-2030 (%)
Data Table on UK - Year-over-year growth 2025-2030 (%)

12.4.3 France - Market size and forecast 2025-2030

Chart on France - Market size and forecast 2025-2030 ($ million)
Data Table on France - Market size and forecast 2025-2030 ($ million)
Chart on France - Year-over-year growth 2025-2030 (%)
Data Table on France - Year-over-year growth 2025-2030 (%)

12.4.4 Italy - Market size and forecast 2025-2030

Chart on Italy - Market size and forecast 2025-2030 ($ million)
Data Table on Italy - Market size and forecast 2025-2030 ($ million)
Chart on Italy - Year-over-year growth 2025-2030 (%)
Data Table on Italy - Year-over-year growth 2025-2030 (%)

12.4.5 Spain - Market size and forecast 2025-2030

Chart on Spain - Market size and forecast 2025-2030 ($ million)
Data Table on Spain - Market size and forecast 2025-2030 ($ million)
Chart on Spain - Year-over-year growth 2025-2030 (%)
Data Table on Spain - Year-over-year growth 2025-2030 (%)

12.4.6 The Netherlands - Market size and forecast 2025-2030

Chart on The Netherlands - Market size and forecast 2025-2030 ($ million)
Data Table on The Netherlands - Market size and forecast 2025-2030 ($ million)
Chart on The Netherlands - Year-over-year growth 2025-2030 (%)
Data Table on The Netherlands - Year-over-year growth 2025-2030 (%)

12.5 Asia - Market size and forecast 2025-2030

Chart on Asia - Market size and forecast 2025-2030 ($ million)
Data Table on Asia - Market size and forecast 2025-2030 ($ million)
Chart on Asia - Year-over-year growth 2025-2030 (%)
Data Table on Asia - Year-over-year growth 2025-2030 (%)
Chart on Regional Comparison - Asia
Data Table on Regional Comparison - Asia

12.5.1 China - Market size and forecast 2025-2030

Chart on China - Market size and forecast 2025-2030 ($ million)
Data Table on China - Market size and forecast 2025-2030 ($ million)
Chart on China - Year-over-year growth 2025-2030 (%)
Data Table on China - Year-over-year growth 2025-2030 (%)

12.5.2 India - Market size and forecast 2025-2030

Chart on India - Market size and forecast 2025-2030 ($ million)
Data Table on India - Market size and forecast 2025-2030 ($ million)
Chart on India - Year-over-year growth 2025-2030 (%)
Data Table on India - Year-over-year growth 2025-2030 (%)

12.5.3 Japan - Market size and forecast 2025-2030

Chart on Japan - Market size and forecast 2025-2030 ($ million)
Data Table on Japan - Market size and forecast 2025-2030 ($ million)
Chart on Japan - Year-over-year growth 2025-2030 (%)
Data Table on Japan - Year-over-year growth 2025-2030 (%)

12.5.4 South Korea - Market size and forecast 2025-2030

Chart on South Korea - Market size and forecast 2025-2030 ($ million)
Data Table on South Korea - Market size and forecast 2025-2030 ($ million)
Chart on South Korea - Year-over-year growth 2025-2030 (%)
Data Table on South Korea - Year-over-year growth 2025-2030 (%)

12.5.5 Indonesia - Market size and forecast 2025-2030

Chart on Indonesia - Market size and forecast 2025-2030 ($ million)
Data Table on Indonesia - Market size and forecast 2025-2030 ($ million)
Chart on Indonesia - Year-over-year growth 2025-2030 (%)
Data Table on Indonesia - Year-over-year growth 2025-2030 (%)

12.5.6 Thailand - Market size and forecast 2025-2030

Chart on Thailand - Market size and forecast 2025-2030 ($ million)
Data Table on Thailand - Market size and forecast 2025-2030 ($ million)
Chart on Thailand - Year-over-year growth 2025-2030 (%)
Data Table on Thailand - Year-over-year growth 2025-2030 (%)

12.6 Rest of World (ROW) - Market size and forecast 2025-2030

Chart on Rest of World (ROW) - Market size and forecast 2025-2030 ($ million)
Data Table on Rest of World (ROW) - Market size and forecast 2025-2030 ($ million)
Chart on Rest of World (ROW) - Year-over-year growth 2025-2030 (%)
Data Table on Rest of World (ROW) - Year-over-year growth 2025-2030 (%)
Chart on Regional Comparison - Rest of World (ROW)
Data Table on Regional Comparison - Rest of World (ROW)

12.6.1 Australia - Market size and forecast 2025-2030

Chart on Australia - Market size and forecast 2025-2030 ($ million)
Data Table on Australia - Market size and forecast 2025-2030 ($ million)
Chart on Australia - Year-over-year growth 2025-2030 (%)
Data Table on Australia - Year-over-year growth 2025-2030 (%)

12.6.2 Brazil - Market size and forecast 2025-2030

Chart on Brazil - Market size and forecast 2025-2030 ($ million)
Data Table on Brazil - Market size and forecast 2025-2030 ($ million)
Chart on Brazil - Year-over-year growth 2025-2030 (%)
Data Table on Brazil - Year-over-year growth 2025-2030 (%)

12.6.3 Saudi Arabia - Market size and forecast 2025-2030

Chart on Saudi Arabia - Market size and forecast 2025-2030 ($ million)
Data Table on Saudi Arabia - Market size and forecast 2025-2030 ($ million)
Chart on Saudi Arabia - Year-over-year growth 2025-2030 (%)
Data Table on Saudi Arabia - Year-over-year growth 2025-2030 (%)

12.6.4 South Africa - Market size and forecast 2025-2030

Chart on South Africa - Market size and forecast 2025-2030 ($ million)
Data Table on South Africa - Market size and forecast 2025-2030 ($ million)
Chart on South Africa - Year-over-year growth 2025-2030 (%)
Data Table on South Africa - Year-over-year growth 2025-2030 (%)

12.6.5 Argentina - Market size and forecast 2025-2030

Chart on Argentina - Market size and forecast 2025-2030 ($ million)
Data Table on Argentina - Market size and forecast 2025-2030 ($ million)
Chart on Argentina - Year-over-year growth 2025-2030 (%)
Data Table on Argentina - Year-over-year growth 2025-2030 (%)

12.6.6 UAE - Market size and forecast 2025-2030

Chart on UAE - Market size and forecast 2025-2030 ($ million)
Data Table on UAE - Market size and forecast 2025-2030 ($ million)
Chart on UAE - Year-over-year growth 2025-2030 (%)
Data Table on UAE - Year-over-year growth 2025-2030 (%)

12.6.7 Colombia - Market size and forecast 2025-2030

Chart on Colombia - Market size and forecast 2025-2030 ($ million)
Data Table on Colombia - Market size and forecast 2025-2030 ($ million)
Chart on Colombia - Year-over-year growth 2025-2030 (%)
Data Table on Colombia - Year-over-year growth 2025-2030 (%)

12.6.8 Chile - Market size and forecast 2025-2030

Chart on Chile - Market size and forecast 2025-2030 ($ million)
Data Table on Chile - Market size and forecast 2025-2030 ($ million)
Chart on Chile - Year-over-year growth 2025-2030 (%)
Data Table on Chile - Year-over-year growth 2025-2030 (%)

12.7 Market opportunity by geography

Market opportunity by geography ($ million)
Data Tables on Market opportunity by geography ($ million)

13. Drivers, Challenges, and Opportunity

13.1 Market drivers

Rising global prevalence of autoimmune disorders
Technological advancements in multiplex assays and laboratory automation
Heightened patient awareness and favorable healthcare initiatives

13.2 Market challenges

High financial burden and limited reimbursement frameworks
Complex pathological overlaps and diagnostic ambiguity
Vulnerabilities in specialty reagent supply chains and strict regulatory scrutiny

13.3 Impact of drivers and challenges

Impact of drivers and challenges in 2025 and 2030

13.4 Market opportunities

Adoption of multiplex autoantibody assays and high-throughput automation
Integration of AI and advanced data analytics
Expansion of POC testing and decentralized diagnostics

14. Competitive Landscape

14.1 Overview

14.2

Overview on criticality of inputs and factors of differentiation

14.3 Landscape disruption

Overview on factors of disruption

14.4 Industry risks

Impact of key risks on business

15. Competitive Analysis

15.1 Companies profiled

Companies covered

15.2 Company ranking index

15.3 Market positioning of companies

Matrix on companies position and classification

15.4 Autoimmune Technologies LLC

Autoimmune Technologies LLC - Overview
Autoimmune Technologies LLC - Product / Service
Autoimmune Technologies LLC - Key offerings
SWOT

15.5 Beckman Coulter Inc.

Beckman Coulter Inc. - Overview
Beckman Coulter Inc. - Product / Service
Beckman Coulter Inc. - Key offerings
SWOT

15.6 Bio Rad Laboratories Inc.

Bio Rad Laboratories Inc. - Overview
Bio Rad Laboratories Inc. - Business segments
Bio Rad Laboratories Inc. - Key news
Bio Rad Laboratories Inc. - Key offerings
Bio Rad Laboratories Inc. - Segment focus
SWOT

15.7 BioMerieux SA

BioMerieux SA - Overview
BioMerieux SA - Business segments
BioMerieux SA - Key offerings
BioMerieux SA - Segment focus
SWOT

15.8 DiaSorin SpA

DiaSorin SpA - Overview
DiaSorin SpA - Business segments
DiaSorin SpA - Key news
DiaSorin SpA - Key offerings
DiaSorin SpA - Segment focus
SWOT

15.9 Exagen Inc.

Exagen Inc. - Overview
Exagen Inc. - Product / Service
Exagen Inc. - Key offerings
SWOT

15.10 F. Hoffmann La Roche Ltd.

F. Hoffmann La Roche Ltd. - Overview
F. Hoffmann La Roche Ltd. - Business segments
F. Hoffmann La Roche Ltd. - Key news
F. Hoffmann La Roche Ltd. - Key offerings
F. Hoffmann La Roche Ltd. - Segment focus
SWOT

15.11 Gold Standard Diagnostics Corp.

Gold Standard Diagnostics Corp. - Overview
Gold Standard Diagnostics Corp. - Product / Service
Gold Standard Diagnostics Corp. - Key offerings
SWOT

15.12 Grifols SA

Grifols SA - Overview
Grifols SA - Business segments
Grifols SA - Key offerings
Grifols SA - Segment focus
SWOT

15.13 Hemagen Diagnostics Inc.

Hemagen Diagnostics Inc. - Overview
Hemagen Diagnostics Inc. - Product / Service
Hemagen Diagnostics Inc. - Key offerings
SWOT

15.14 Laboratory Holdings Inc.

Laboratory Holdings Inc. - Overview
Laboratory Holdings Inc. - Business segments
Laboratory Holdings Inc. - Key offerings
Laboratory Holdings Inc. - Segment focus
SWOT

15.15 Quest Diagnostics Inc.

Quest Diagnostics Inc. - Overview
Quest Diagnostics Inc. - Business segments
Quest Diagnostics Inc. - Key offerings
Quest Diagnostics Inc. - Segment focus
SWOT

15.16 Revvity Inc.

Revvity Inc. - Overview
Revvity Inc. - Business segments
Revvity Inc. - Key offerings
Revvity Inc. - Segment focus
SWOT

15.17 Siemens AG

Siemens AG - Overview
Siemens AG - Business segments
Siemens AG - Key news
Siemens AG - Key offerings
Siemens AG - Segment focus
SWOT

15.18 Thermo Fisher Scientific Inc.

Thermo Fisher Scientific Inc. - Overview
Thermo Fisher Scientific Inc. - Business segments
Thermo Fisher Scientific Inc. - Key news
Thermo Fisher Scientific Inc. - Key offerings
Thermo Fisher Scientific Inc. - Segment focus
SWOT

16. Appendix

16.1 Scope of the report

Market definition
Objectives
Notes and caveats

16.2 Inclusions and exclusions checklist

Inclusions checklist
Exclusions checklist

16.3 Currency conversion rates for US$

16.4 Research methodology

16.5 Data procurement

Information sources

16.6 Data validation

16.7 Validation techniques employed for market sizing

16.8 Data synthesis

16.9 360 degree market analysis

16.10 List of abbreviations

Research Methodology

Technavio presents a detailed picture of the market by way of study, synthesis, and summation of data from multiple sources. The analysts have presented the various facets of the market with a particular focus on identifying the key industry influencers. The data thus presented is comprehensive, reliable, and the result of extensive research, both primary and secondary.

INFORMATION SOURCES

Primary sources

  • Manufacturers and suppliers
  • Channel partners
  • Industry experts
  • Strategic decision makers

Secondary sources

  • Industry journals and periodicals
  • Government data
  • Financial reports of key industry players
  • Historical data
  • Press releases

DATA ANALYSIS

Data Synthesis

  • Collation of data
  • Estimation of key figures
  • Analysis of derived insights

Data Validation

  • Triangulation with data models
  • Reference against proprietary databases
  • Corroboration with industry experts

REPORT WRITING

Qualitative

  • Market drivers
  • Market challenges
  • Market trends
  • Five forces analysis

Quantitative

  • Market size and forecast
  • Market segmentation
  • Geographical insights
  • Competitive landscape

Interested in this report?

Get your sample now to see our research methodology and insights!

Download Now

Frequently Asked Questions

Autoimmune Disease Diagnostics market growth will increase by USD 3768.7 million during 2026-2030.

The Autoimmune Disease Diagnostics market is expected to grow at a CAGR of 10.1% during 2026-2030.

Autoimmune Disease Diagnostics market is segmented by Type (Localized diagnostics, Systemic diagnostics) Product (Assay kits, Analyzer) End-user (Clinical laboratories, Hospitals, Diagnostic centers, Research laboratories)

Autoimmune Technologies LLC, Beckman Coulter Inc., Bio Rad Laboratories Inc., BioMerieux SA, DiaSorin SpA, Exagen Inc., F. Hoffmann La Roche Ltd., Gold Standard Diagnostics Corp., Grifols SA, Hemagen Diagnostics Inc., HUMAN Diagnostics Worldwide, Immco Diagnostics Inc., Laboratory Holdings Inc., Quest Diagnostics Inc., R Biopharm AG, Revvity Inc., Siemens AG, Svar Life Science AB, Thermo Fisher Scientific Inc., Werfenlife SA are a few of the key vendors in the Autoimmune Disease Diagnostics market.

North America will register the highest growth rate of 42.3% among the other regions. Therefore, the Autoimmune Disease Diagnostics market in North America is expected to garner significant business opportunities for the vendors during the forecast period.

US, Canada, Mexico, Germany, UK, France, Italy, Spain, The Netherlands, China, India, Japan, South Korea, Indonesia, Thailand, Australia, Brazil, Saudi Arabia, South Africa, Argentina, UAE, Colombia, Chile

  • Rising global prevalence of autoimmune disorders is the driving factor this market.

The Autoimmune Disease Diagnostics market vendors should focus on grabbing business opportunities from the Type segment as it accounted for the largest market share in the base year.
RIA - Research AI Assistant
Ask RIA
