Augmented Reality And Virtual Reality Market Analysis, Size, and Forecast 2026-2030: APAC (China, Japan, and India), North America (US, Canada, and Mexico), Europe (Germany, UK, and France), Middle East and Africa (Saudi Arabia, UAE, and South Africa), South America (Brazil and Argentina), and Rest of World (ROW)

Augmented Reality And Virtual Reality Market Analysis, Size, and Forecast 2026-2030:
APAC (China, Japan, and India), North America (US, Canada, and Mexico), Europe (Germany, UK, and France), Middle East and Africa (Saudi Arabia, UAE, and South Africa), South America (Brazil and Argentina), and Rest of World (ROW)

Published: May 2026 317 Pages SKU: IRTNTR43509

Market Overview at a Glance

$777.12 B
Market Opportunity
48.1%
CAGR 2025 - 2030
34.2%
APAC Growth
$60.90 B
AR segment 2024

Augmented Reality And Virtual Reality Market Size 2026-2030

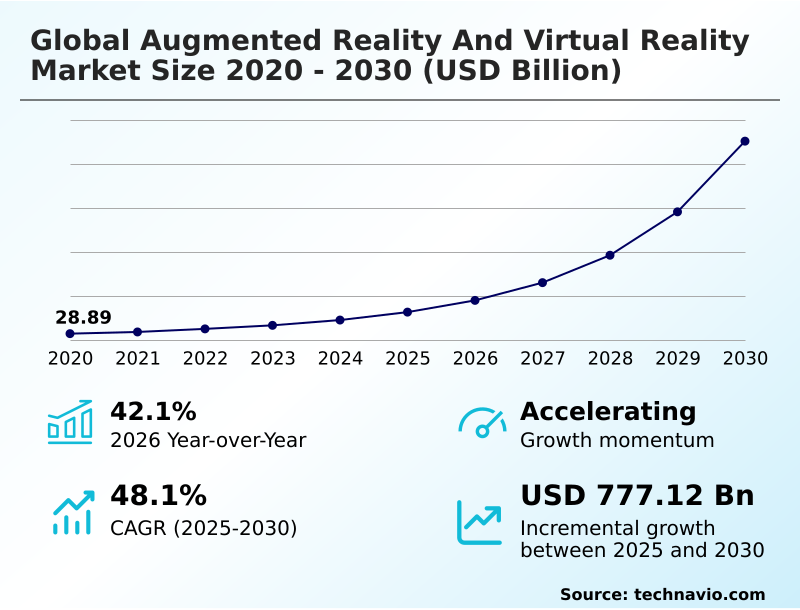
The augmented reality and virtual reality market size is valued to increase by USD 777.12 billion, at a CAGR of 48.1% from 2025 to 2030. Growing demand for AR and VR technology will drive the augmented reality and virtual reality market.

Major Market Trends & Insights

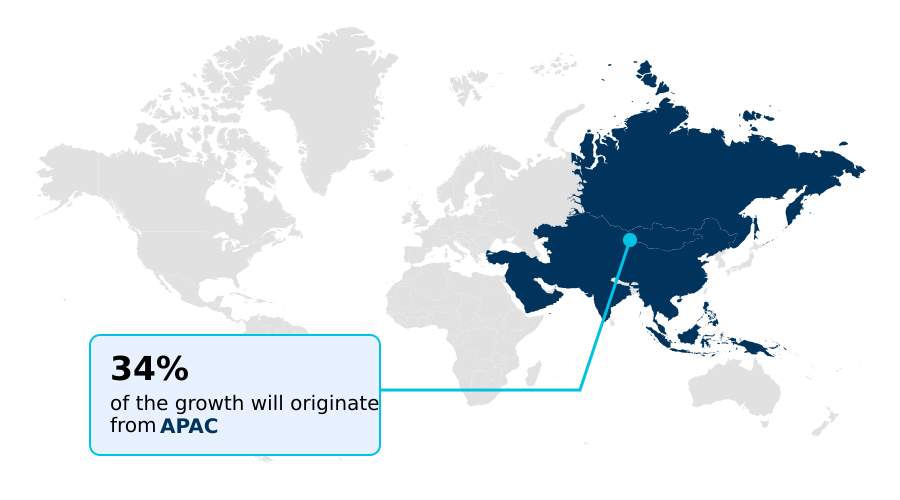
  • APAC dominated the market and accounted for a 34.2% growth during the forecast period.
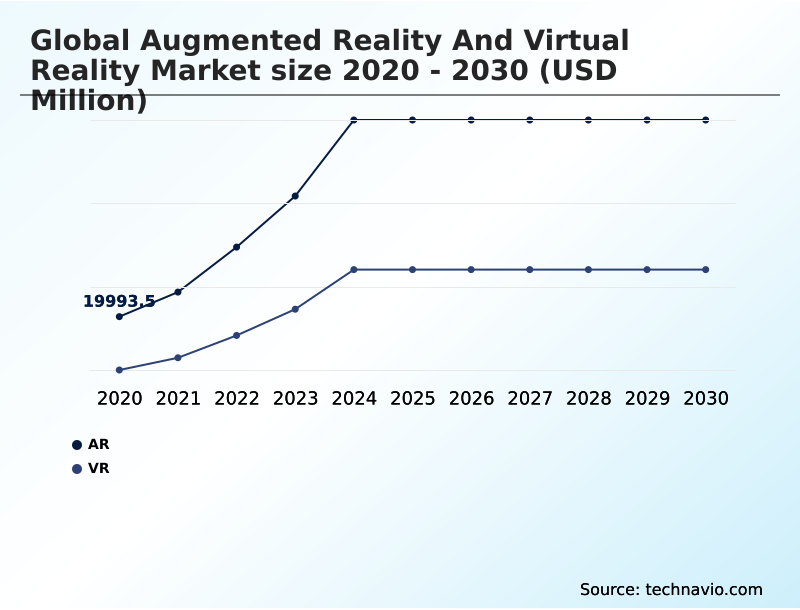
  • By Technology - AR segment was valued at USD 60.90 billion in 2024
  • By Application - Consumer segment accounted for the largest market revenue share in 2024

Market Size & Forecast

  • Market Opportunities: USD 874.95 billion
  • Market Future Opportunities: USD 777.12 billion
  • CAGR from 2025 to 2030 : 48.1%

Market Summary

  • The augmented reality and virtual reality market is experiencing strong expansion, propelled by advancements in immersive technologies and increasing adoption across diverse industries. Augmented reality enhances real-world environments by overlaying digital information, while virtual reality creates fully simulated digital worlds.
  • These technologies are transforming sectors such as gaming, healthcare, education, retail, manufacturing, and defense by improving training, visualization, and customer engagement. A key driver is the rising demand for enhanced user experiences, supported by widespread smartphone penetration and improved internet connectivity.
  • For instance, in manufacturing, AR overlays provide technicians with real-time, step-by-step instructions for complex assembly or maintenance tasks, significantly reducing errors and downtime. This practical application highlights the shift from consumer entertainment to critical enterprise tools.
  • However, the market's trajectory is moderated by challenges such as high development costs, technical limitations like device bulkiness and battery life, and data privacy concerns. As innovation continues and hardware becomes more accessible, the diversification of applications and growing investor confidence are set to sustain momentum.

What will be the Size of the Augmented Reality And Virtual Reality Market during the forecast period?

Get Key Insights on Market Forecast (PDF) Request Free Sample

How is the Augmented Reality And Virtual Reality Market Segmented?

The augmented reality and virtual reality industry research report provides comprehensive data (region-wise segment analysis), with forecasts and estimates in "USD million" for the period 2026-2030, as well as historical data from 2020-2024 for the following segments.

  • Technology
    • AR
    • VR
  • Application
    • Consumer
    • Enterprise
  • Component
    • Hardware
    • Software
  • End-user
    • Aerospace and defense
    • Consumer
    • Commercial
    • Enterprise
    • Others
  • Geography
    • APAC
      • China
      • Japan
      • India
    • North America
      • US
      • Canada
      • Mexico
    • Europe
      • Germany
      • UK
      • France
    • Middle East and Africa
      • Saudi Arabia
      • UAE
      • South Africa
    • South America
      • Brazil
      • Argentina
    • Rest of World (ROW)

By Technology Insights

The ar segment is estimated to witness significant growth during the forecast period.

The augmented reality and virtual reality market is segmented by technology, application, and end-user. The technology segment is led by augmented reality, driven by the adoption of AR-enabled smart glasses and applications that create an immersive digital environment.

In the application segment, enterprise use cases are expanding rapidly, with VR for industrial training and AR surgical simulation demonstrating significant efficiency gains. In fact, AR-guided industrial tasks have been shown to reduce errors by up to 25%.

The consumer segment remains robust, dominated by consumer VR gaming. Key end-user industries include healthcare, where AR in healthcare is transforming procedures, and education, where VR for education offers interactive learning.

The growth of enterprise AR solutions across various verticals underscores the market’s diversification beyond entertainment.

Request Free Sample

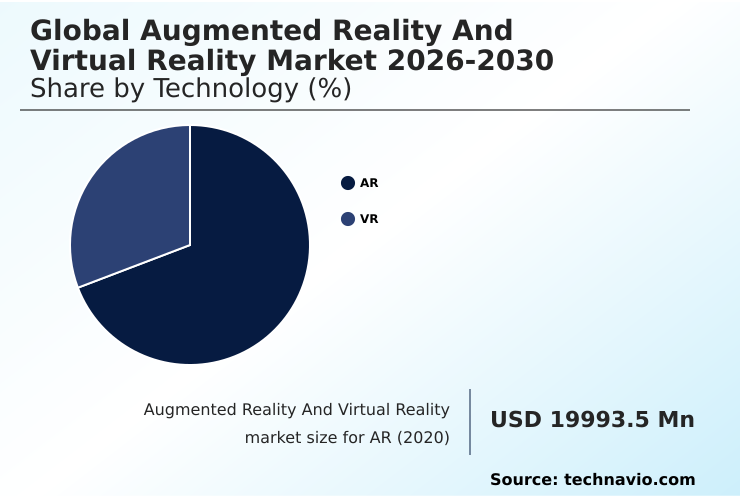
The AR segment was valued at USD 60.90 billion in 2024 and showed a gradual increase during the forecast period.

Request Free Sample

Regional Analysis

APAC is estimated to contribute 34.2% to the growth of the global market during the forecast period.Technavio’s analysts have elaborately explained the regional trends and drivers that shape the market during the forecast period.

See How Augmented Reality And Virtual Reality Market Demand is Rising in APAC Request Free Sample

The market landscape shows distinct regional dynamics. North America, representing a 32.53% growth opportunity, leads in enterprise adoption, particularly in aerospace and healthcare.

Europe excels in industrial applications, using AR overlay for manufacturing and VR for architectural design to enhance precision.

However, APAC is the fastest-growing region, projected to account for 34.15% of incremental growth, driven by a massive consumer base and manufacturing hubs in China and South Korea.

In this region, AR for logistics is optimizing supply chains, while digital twin visualization is becoming standard in smart city projects.

AR in construction and VR in real estate are gaining traction globally, but adoption is accelerating fastest in APAC's rapidly urbanizing economies, transforming how projects are planned and marketed.

Market Dynamics

Our researchers analyzed the data with 2025 as the base year, along with the key drivers, trends, and challenges. A holistic analysis of drivers will help companies refine their marketing strategies to gain a competitive advantage.

  • The strategic implementation of immersive technologies is unlocking significant operational value across industries. Enterprises are increasingly using augmented reality for remote expert guidance, which has been shown to reduce machinery downtime by connecting on-site technicians with specialists, achieving resolutions faster than traditional methods by a factor of two. This is particularly impactful in complex industrial settings.
  • The healthcare sector leverages virtual reality for surgical skills training, allowing surgeons to refine techniques in a risk-free environment. In manufacturing, AR-based quality control in manufacturing and deploying AR for real-time assembly instructions are minimizing production errors and enhancing throughput. A core focus is on using VR for employee safety training, especially in hazardous jobs.
  • Supply chains are being optimized with AR applications for warehouse inventory management, improving pick accuracy and speed. The architecture and real estate fields are being transformed by virtual reality for architectural visualization and VR for immersive real estate tours. As a result, businesses are examining the benefits of AR in retail customer experience and implementing VR for complex data visualization.
  • Other growing applications include AR for interactive museum exhibits and VR applications in cognitive rehabilitation therapy. The decision-making process now includes evaluating how AR improves field service operations, the cost of developing VR training modules, and understanding the impact of 5G on mobile AR performance.
  • Key strategic considerations involve enterprise AR platform selection criteria, measuring ROI of VR training programs, and addressing data privacy concerns in AR applications. The convergence of AR integration with IoT for smart factories, the rise of collaborative VR for the future of work, and specialized use cases like AR HUD systems in automotive sector define the market's forward trajectory.

What are the key market drivers leading to the rise in the adoption of Augmented Reality And Virtual Reality Industry?

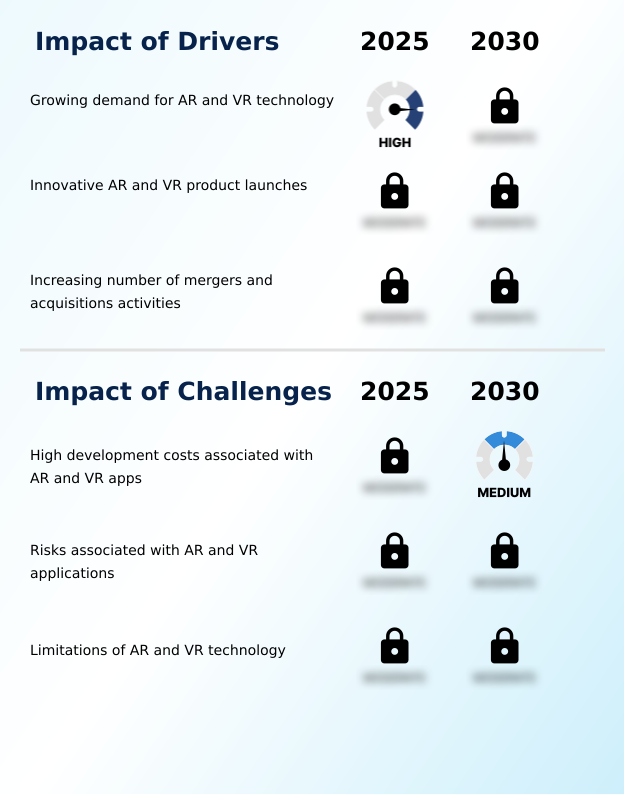
  • The growing demand for augmented and virtual reality technology is the key driver of market growth.

  • Market growth is driven by the increasing demand for immersive experiences in both consumer and enterprise sectors. Innovations in hardware, such as more powerful and comfortable head-mounted display (HMD) devices, are critical.
  • These advancements, which have seen processing power increase by 50% year-over-year, are enhancing real-time 3D rendering capabilities. The expansion of the spatial computing platform ecosystem is supported by sophisticated 3D content creation tools.
  • Enterprises are adopting these technologies for practical applications like VR design and prototyping and AR for field service.
  • Concurrently, AR in retail is transforming customer engagement, with virtual try-on features proven to boost conversion rates by over 90% by allowing customers to visualize products in their own space before purchase.

What are the market trends shaping the Augmented Reality And Virtual Reality Industry?

  • A significant upcoming market trend is the increasing flow of investment into startup companies specializing in augmented and virtual reality technologies.

  • Key trends shaping the market include the integration of the extended reality (XR) ecosystem, which merges AR and VR into a unified mixed reality (MR) experience. This convergence is expanding spatial computing use cases beyond gaming. The proliferation of standalone VR headsets and sophisticated mobile AR applications makes immersive technology more accessible for both VR entertainment experiences and enterprise functions.
  • WebAR experience development is lowering entry barriers, allowing businesses to launch interactive AR marketing campaigns that see engagement rates up to 70% higher than static ads. Moreover, enterprises leveraging XR for employee onboarding have reported a reduction in training time by as much as 40%, demonstrating a clear return on investment.

What challenges does the Augmented Reality And Virtual Reality Industry face during its growth?

  • High development costs associated with augmented and virtual reality applications are a key challenge affecting industry growth.

  • Despite strong growth drivers, the market faces significant challenges. The cost of developing VR training modules and other complex applications remains high, with projects often exceeding initial budgets by up to 45%. Technical limitations also persist; refining the computer vision algorithm for flawless environmental understanding and perfecting the motion tracking sensor and eye tracking technology are ongoing endeavors.
  • Issues with latency and hardware bulkiness can detract from the user experience. Furthermore, data privacy concerns in AR applications are a major hurdle for enterprise adoption, with over 60% of potential users citing security as a primary barrier.
  • While niche applications like VR for mental health are emerging, scaling solutions requires overcoming these technical and financial obstacles, including the complexities of haptic feedback integration.

Exclusive Technavio Analysis on Customer Landscape

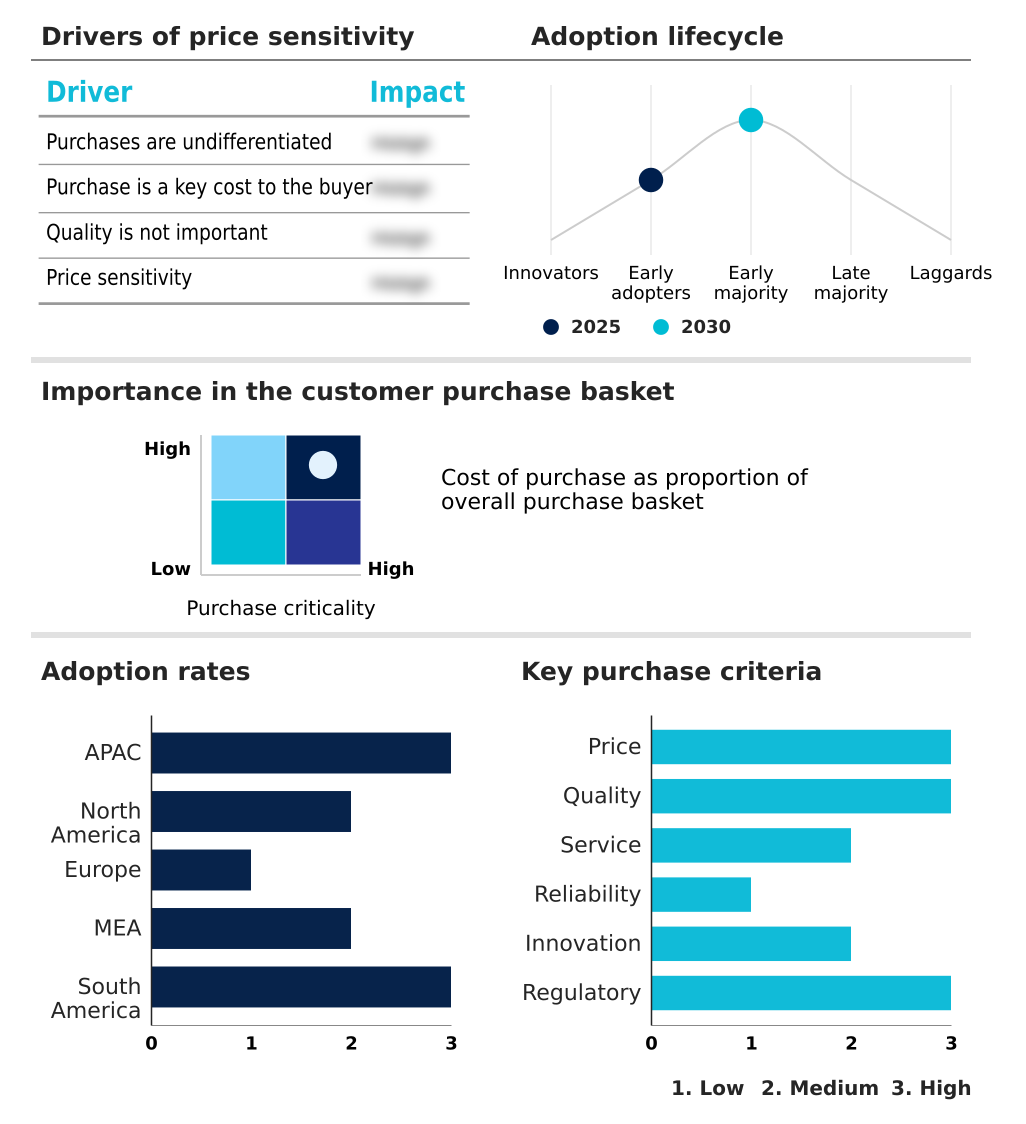
The augmented reality and virtual reality market forecasting report includes the adoption lifecycle of the market, covering from the innovator’s stage to the laggard’s stage. It focuses on adoption rates in different regions based on penetration. Furthermore, the augmented reality and virtual reality market report also includes key purchase criteria and drivers of price sensitivity to help companies evaluate and develop their market growth analysis strategies.

Customer Landscape of Augmented Reality And Virtual Reality Industry

Competitive Landscape

Companies are implementing various strategies, such as strategic alliances, augmented reality and virtual reality market forecast, partnerships, mergers and acquisitions, geographical expansion, and product/service launches, to enhance their presence in the industry.

Apple Inc. - Key offerings focus on advanced spatial computing platforms and development tools that enable the creation of immersive AR/VR applications for both consumer and enterprise use.

The industry research and growth report includes detailed analyses of the competitive landscape of the market and information about key companies, including:

  • Apple Inc.
  • Epic Games Inc.
  • Google LLC
  • Groove Jones LLC
  • HTC Corp.
  • Lenovo Group Ltd.
  • Magic Leap Inc.
  • Meta Platforms Inc.
  • Microsoft Corp.
  • Niantic Inc.
  • PTC Inc.
  • Samsung Electronics Co. Ltd.
  • Seiko Epson Corp.
  • Sony Group Corp.
  • Ultraleap Ltd.
  • Unity Technologies Inc.
  • Varjo Technologies Oy
  • VirtaMed AG
  • Vuzix Corp.
  • Wikitude GmbH
  • Xiaomi Corp.

Qualitative and quantitative analysis of companies has been conducted to help clients understand the wider business environment as well as the strengths and weaknesses of key industry players. Data is qualitatively analyzed to categorize companies as pure play, category-focused, industry-focused, and diversified; it is quantitatively analyzed to categorize companies as dominant, leading, strong, tentative, and weak.

Recent Development and News in Augmented reality and virtual reality market

  • In May 2025, Meta Platforms reported increased global demand for its virtual reality ecosystem, driven by expanding applications in gaming, social interaction, and enterprise collaboration tools.
  • In June 2025, Apple Inc. expanded its spatial computing portfolio with updated immersive device capabilities, focusing on enhanced mixed reality experiences and enterprise applications.
  • In July 2025, Unity Technologies announced strategic acquisition initiatives aimed at strengthening its real-time 3D and immersive content development capabilities.
  • In August 2025, Magic Leap secured renewed investor backing to expand its enterprise AR solutions, reflecting continued confidence in the growth potential of immersive technologies.

Dive into Technavio’s robust research methodology, blending expert interviews, extensive data synthesis, and validated models for unparalleled Augmented Reality And Virtual Reality Market insights. See full methodology.

Market Scope
Page number 317
Base year 2025
Historic period 2020-2024
Forecast period 2026-2030
Growth momentum & CAGR Accelerate at a CAGR of 48.1%
Market growth 2026-2030 USD 777123.6 million
Market structure Fragmented
YoY growth 2025-2026(%) 42.1%
Key countries China, Japan, India, South Korea, Australia, Indonesia, US, Canada, Mexico, Germany, UK, France, Italy, Spain, The Netherlands, Saudi Arabia, UAE, South Africa, Israel, Turkey, Brazil, Argentina and Chile
Competitive landscape Leading Companies, Market Positioning of Companies, Competitive Strategies, and Industry Risks

Request Free Sample

Research Analyst Overview

  • The augmented reality and virtual reality market is maturing into a foundational enterprise technology. Core hardware innovation in the head-mounted display (HMD), AR-enabled smart glasses, and virtual retinal display is critical. The quality of the immersive digital environment depends on the motion tracking sensor and haptic feedback integration.
  • Software is equally vital, with platforms like ARKit and realitykit, google arcore platform, and the vuforia engine ar enabling development. High-fidelity mixed reality (MR) experiences rely on real-time 3D rendering powered by the unreal engine for ar/vr and a sophisticated computer vision algorithm.
  • Boardroom decisions are now influenced by demonstrated ROI, with AR surgical simulation and VR for patient treatment planning becoming standards. Industrial applications like AR overlay for manufacturing, AR for remote maintenance, and AR-based navigation system optimize workflows, reducing task errors by over 25%.
  • The overarching spatial computing platform enables these uses, from digital twin visualization and VR for architectural design to battlefield simulation VR. Advanced features like eye tracking technology and hand gesture recognition, coupled with spatial audio processing, make interactions intuitive.
  • From VR training simulation to interactive product visualization and virtual property tours, the scope is broadening, powered by platforms like lightship AR platform, 8th wall webar, azure mixed reality, windows mixed reality, and meta quest platform.
  • Entertainment systems like playstation VR hardware also drive the ecosystem, alongside 3D content creation tools used for 3D modeling for AR, enabling real-time collaborative VR and WebAR experience development.

What are the Key Data Covered in this Augmented Reality And Virtual Reality Market Research and Growth Report?

  • What is the expected growth of the Augmented Reality And Virtual Reality Market between 2026 and 2030?

    • USD 777.12 billion, at a CAGR of 48.1%

  • What segmentation does the market report cover?

    • The report is segmented by Technology (AR, and VR), Application (Consumer, and Enterprise), Component (Hardware, and Software), End-user (Aerospace and defense, Consumer, Commercial, Enterprise, and Others) and Geography (APAC, North America, Europe, Middle East and Africa, South America)

  • Which regions are analyzed in the report?

    • APAC, North America, Europe, Middle East and Africa and South America

  • What are the key growth drivers and market challenges?

    • Growing demand for AR and VR technology, High development costs associated with AR and VR apps

  • Who are the major players in the Augmented Reality And Virtual Reality Market?

    • Apple Inc., Epic Games Inc., Google LLC, Groove Jones LLC, HTC Corp., Lenovo Group Ltd., Magic Leap Inc., Meta Platforms Inc., Microsoft Corp., Niantic Inc., PTC Inc., Samsung Electronics Co. Ltd., Seiko Epson Corp., Sony Group Corp., Ultraleap Ltd., Unity Technologies Inc., Varjo Technologies Oy, VirtaMed AG, Vuzix Corp., Wikitude GmbH and Xiaomi Corp.

Market Research Insights

  • The immersive technology market is defined by rapid innovation and expanding applications across sectors. While consumer-facing uses like gaming are prominent, the most significant value is being unlocked in enterprise environments. Enterprise AR solutions are driving measurable efficiency gains; for instance, deploying AR for field service improves first-time fix rates by over 35%.
  • Similarly, companies using VR for industrial training report up to a 60% reduction in workplace safety incidents. The distinction between use cases clarifies the AR vs VR differences, with AR enhancing real-world tasks and VR creating fully simulated environments for training and design.
  • Growth is fueled by continuous AR hardware development and increasing investment in VR content creation, broadening the technology's accessibility and impact.

We can help! Our analysts can customize this augmented reality and virtual reality market research report to meet your requirements.

Get in touch

1. Executive Summary

1.1 Market overview

Executive Summary - Chart on Market Overview
Executive Summary - Data Table on Market Overview
Executive Summary - Chart on Global Market Characteristics
Executive Summary - Chart on Market by Geography
Executive Summary - Chart on Market Segmentation by Technology
Executive Summary - Chart on Market Segmentation by Application
Executive Summary - Chart on Market Segmentation by Component
Executive Summary - Chart on Market Segmentation by End-user
Executive Summary - Chart on Incremental Growth
Executive Summary - Data Table on Incremental Growth
Executive Summary - Chart on Company Market Positioning

2. Technavio Analysis

2.1 Analysis of price sensitivity, lifecycle, customer purchase basket, adoption rates, and purchase criteria

2.2 Criticality of inputs and Factors of differentiation

Chart on Overview on criticality of inputs and factors of differentiation

2.3 Factors of disruption

Chart on Overview on factors of disruption

2.4 Impact of drivers and challenges

Chart on Impact of drivers and challenges in 2025 and 2030

3. Market Landscape

3.1 Market ecosystem

Chart on Parent Market
Data Table on - Parent Market

3.2 Market characteristics

Chart on Market characteristics analysis

3.3 Value chain analysis

Chart on Value chain analysis

4. Market Sizing

4.1 Market definition

Data Table on Offerings of companies included in the market definition

4.2 Market segment analysis

Market segments

4.3 Market size 2025

4.4 Market outlook: Forecast for 2025-2030

Chart on Global - Market size and forecast 2025-2030 ($ million)
Data Table on Global - Market size and forecast 2025-2030 ($ million)
Chart on Global Market: Year-over-year growth 2025-2030 (%)
Data Table on Global Market: Year-over-year growth 2025-2030 (%)

5. Historic Market Size

5.1 Global Augmented Reality And Virtual Reality Market 2020 - 2024

Historic Market Size - Data Table on Global Augmented Reality And Virtual Reality Market 2020 - 2024 ($ million)

5.2 Technology segment analysis 2020 - 2024

Historic Market Size - Technology Segment 2020 - 2024 ($ million)

5.3 Application segment analysis 2020 - 2024

Historic Market Size - Application Segment 2020 - 2024 ($ million)

5.4 Component segment analysis 2020 - 2024

Historic Market Size - Component Segment 2020 - 2024 ($ million)

5.5 End-user segment analysis 2020 - 2024

Historic Market Size - End-user Segment 2020 - 2024 ($ million)

5.6 Geography segment analysis 2020 - 2024

Historic Market Size - Geography Segment 2020 - 2024 ($ million)

5.7 Country segment analysis 2020 - 2024

Historic Market Size - Country Segment 2020 - 2024 ($ million)

6. Qualitative Analysis

6.1 Impact of AI on Global Augmented Reality and Virtual Reality Market

6.2 Impact of Geopolitical Conflicts on Global Augmented Reality and Virtual Reality Market

7. Five Forces Analysis

7.1 Five forces summary

Five forces analysis - Comparison between 2025 and 2030

7.2 Bargaining power of buyers

Bargaining power of buyers - Impact of key factors 2025 and 2030

7.3 Bargaining power of suppliers

Bargaining power of suppliers - Impact of key factors in 2025 and 2030

7.4 Threat of new entrants

Threat of new entrants - Impact of key factors in 2025 and 2030

7.5 Threat of substitutes

Threat of substitutes - Impact of key factors in 2025 and 2030

7.6 Threat of rivalry

Threat of rivalry - Impact of key factors in 2025 and 2030

7.7 Market condition

Chart on Market condition - Five forces 2025 and 2030

8. Market Segmentation by Technology

8.1 Market segments

Chart on Technology - Market share 2025-2030 (%)
Data Table on Technology - Market share 2025-2030 (%)

8.2 Comparison by Technology

Chart on Comparison by Technology
Data Table on Comparison by Technology

8.3 AR - Market size and forecast 2025-2030

Chart on AR - Market size and forecast 2025-2030 ($ million)
Data Table on AR - Market size and forecast 2025-2030 ($ million)
Chart on AR - Year-over-year growth 2025-2030 (%)
Data Table on AR - Year-over-year growth 2025-2030 (%)

8.4 VR - Market size and forecast 2025-2030

Chart on VR - Market size and forecast 2025-2030 ($ million)
Data Table on VR - Market size and forecast 2025-2030 ($ million)
Chart on VR - Year-over-year growth 2025-2030 (%)
Data Table on VR - Year-over-year growth 2025-2030 (%)

8.5 Market opportunity by Technology

Market opportunity by Technology ($ million)
Data Table on Market opportunity by Technology ($ million)

9. Market Segmentation by Application

9.1 Market segments

Chart on Application - Market share 2025-2030 (%)
Data Table on Application - Market share 2025-2030 (%)

9.2 Comparison by Application

Chart on Comparison by Application
Data Table on Comparison by Application

9.3 Consumer - Market size and forecast 2025-2030

Chart on Consumer - Market size and forecast 2025-2030 ($ million)
Data Table on Consumer - Market size and forecast 2025-2030 ($ million)
Chart on Consumer - Year-over-year growth 2025-2030 (%)
Data Table on Consumer - Year-over-year growth 2025-2030 (%)

9.4 Enterprise - Market size and forecast 2025-2030

Chart on Enterprise - Market size and forecast 2025-2030 ($ million)
Data Table on Enterprise - Market size and forecast 2025-2030 ($ million)
Chart on Enterprise - Year-over-year growth 2025-2030 (%)
Data Table on Enterprise - Year-over-year growth 2025-2030 (%)

9.5 Market opportunity by Application

Market opportunity by Application ($ million)
Data Table on Market opportunity by Application ($ million)

10. Market Segmentation by Component

10.1 Market segments

Chart on Component - Market share 2025-2030 (%)
Data Table on Component - Market share 2025-2030 (%)

10.2 Comparison by Component

Chart on Comparison by Component
Data Table on Comparison by Component

10.3 Hardware - Market size and forecast 2025-2030

Chart on Hardware - Market size and forecast 2025-2030 ($ million)
Data Table on Hardware - Market size and forecast 2025-2030 ($ million)
Chart on Hardware - Year-over-year growth 2025-2030 (%)
Data Table on Hardware - Year-over-year growth 2025-2030 (%)

10.4 Software - Market size and forecast 2025-2030

Chart on Software - Market size and forecast 2025-2030 ($ million)
Data Table on Software - Market size and forecast 2025-2030 ($ million)
Chart on Software - Year-over-year growth 2025-2030 (%)
Data Table on Software - Year-over-year growth 2025-2030 (%)

10.5 Market opportunity by Component

Market opportunity by Component ($ million)
Data Table on Market opportunity by Component ($ million)

11. Market Segmentation by End-user

11.1 Market segments

Chart on End-user - Market share 2025-2030 (%)
Data Table on End-user - Market share 2025-2030 (%)

11.2 Comparison by End-user

Chart on Comparison by End-user
Data Table on Comparison by End-user

11.3 Aerospace and defense - Market size and forecast 2025-2030

Chart on Aerospace and defense - Market size and forecast 2025-2030 ($ million)
Data Table on Aerospace and defense - Market size and forecast 2025-2030 ($ million)
Chart on Aerospace and defense - Year-over-year growth 2025-2030 (%)
Data Table on Aerospace and defense - Year-over-year growth 2025-2030 (%)

11.4 Consumer - Market size and forecast 2025-2030

Chart on Consumer - Market size and forecast 2025-2030 ($ million)
Data Table on Consumer - Market size and forecast 2025-2030 ($ million)
Chart on Consumer - Year-over-year growth 2025-2030 (%)
Data Table on Consumer - Year-over-year growth 2025-2030 (%)

11.5 Commercial - Market size and forecast 2025-2030

Chart on Commercial - Market size and forecast 2025-2030 ($ million)
Data Table on Commercial - Market size and forecast 2025-2030 ($ million)
Chart on Commercial - Year-over-year growth 2025-2030 (%)
Data Table on Commercial - Year-over-year growth 2025-2030 (%)

11.6 Enterprise - Market size and forecast 2025-2030

Chart on Enterprise - Market size and forecast 2025-2030 ($ million)
Data Table on Enterprise - Market size and forecast 2025-2030 ($ million)
Chart on Enterprise - Year-over-year growth 2025-2030 (%)
Data Table on Enterprise - Year-over-year growth 2025-2030 (%)

11.7 Others - Market size and forecast 2025-2030

Chart on Others - Market size and forecast 2025-2030 ($ million)
Data Table on Others - Market size and forecast 2025-2030 ($ million)
Chart on Others - Year-over-year growth 2025-2030 (%)
Data Table on Others - Year-over-year growth 2025-2030 (%)

11.8 Market opportunity by End-user

Market opportunity by End-user ($ million)
Data Table on Market opportunity by End-user ($ million)

12. Customer Landscape

12.1 Customer landscape overview

Analysis of price sensitivity, lifecycle, customer purchase basket, adoption rates, and purchase criteria

13. Geographic Landscape

13.1 Geographic segmentation

Chart on Market share by geography 2025-2030 (%)
Data Table on Market share by geography 2025-2030 (%)

13.2 Geographic comparison

Chart on Geographic comparison
Data Table on Geographic comparison

13.3 APAC - Market size and forecast 2025-2030

Chart on APAC - Market size and forecast 2025-2030 ($ million)
Data Table on APAC - Market size and forecast 2025-2030 ($ million)
Chart on APAC - Year-over-year growth 2025-2030 (%)
Data Table on APAC - Year-over-year growth 2025-2030 (%)
Chart on Regional Comparison - APAC
Data Table on Regional Comparison - APAC

13.3.1 China - Market size and forecast 2025-2030

Chart on China - Market size and forecast 2025-2030 ($ million)
Data Table on China - Market size and forecast 2025-2030 ($ million)
Chart on China - Year-over-year growth 2025-2030 (%)
Data Table on China - Year-over-year growth 2025-2030 (%)

13.3.2 Japan - Market size and forecast 2025-2030

Chart on Japan - Market size and forecast 2025-2030 ($ million)
Data Table on Japan - Market size and forecast 2025-2030 ($ million)
Chart on Japan - Year-over-year growth 2025-2030 (%)
Data Table on Japan - Year-over-year growth 2025-2030 (%)

13.3.3 India - Market size and forecast 2025-2030

Chart on India - Market size and forecast 2025-2030 ($ million)
Data Table on India - Market size and forecast 2025-2030 ($ million)
Chart on India - Year-over-year growth 2025-2030 (%)
Data Table on India - Year-over-year growth 2025-2030 (%)

13.3.4 South Korea - Market size and forecast 2025-2030

Chart on South Korea - Market size and forecast 2025-2030 ($ million)
Data Table on South Korea - Market size and forecast 2025-2030 ($ million)
Chart on South Korea - Year-over-year growth 2025-2030 (%)
Data Table on South Korea - Year-over-year growth 2025-2030 (%)

13.3.5 Australia - Market size and forecast 2025-2030

Chart on Australia - Market size and forecast 2025-2030 ($ million)
Data Table on Australia - Market size and forecast 2025-2030 ($ million)
Chart on Australia - Year-over-year growth 2025-2030 (%)
Data Table on Australia - Year-over-year growth 2025-2030 (%)

13.3.6 Indonesia - Market size and forecast 2025-2030

Chart on Indonesia - Market size and forecast 2025-2030 ($ million)
Data Table on Indonesia - Market size and forecast 2025-2030 ($ million)
Chart on Indonesia - Year-over-year growth 2025-2030 (%)
Data Table on Indonesia - Year-over-year growth 2025-2030 (%)

13.4 North America - Market size and forecast 2025-2030

Chart on North America - Market size and forecast 2025-2030 ($ million)
Data Table on North America - Market size and forecast 2025-2030 ($ million)
Chart on North America - Year-over-year growth 2025-2030 (%)
Data Table on North America - Year-over-year growth 2025-2030 (%)
Chart on Regional Comparison - North America
Data Table on Regional Comparison - North America

13.4.1 US - Market size and forecast 2025-2030

Chart on US - Market size and forecast 2025-2030 ($ million)
Data Table on US - Market size and forecast 2025-2030 ($ million)
Chart on US - Year-over-year growth 2025-2030 (%)
Data Table on US - Year-over-year growth 2025-2030 (%)

13.4.2 Canada - Market size and forecast 2025-2030

Chart on Canada - Market size and forecast 2025-2030 ($ million)
Data Table on Canada - Market size and forecast 2025-2030 ($ million)
Chart on Canada - Year-over-year growth 2025-2030 (%)
Data Table on Canada - Year-over-year growth 2025-2030 (%)

13.4.3 Mexico - Market size and forecast 2025-2030

Chart on Mexico - Market size and forecast 2025-2030 ($ million)
Data Table on Mexico - Market size and forecast 2025-2030 ($ million)
Chart on Mexico - Year-over-year growth 2025-2030 (%)
Data Table on Mexico - Year-over-year growth 2025-2030 (%)

13.5 Europe - Market size and forecast 2025-2030

Chart on Europe - Market size and forecast 2025-2030 ($ million)
Data Table on Europe - Market size and forecast 2025-2030 ($ million)
Chart on Europe - Year-over-year growth 2025-2030 (%)
Data Table on Europe - Year-over-year growth 2025-2030 (%)
Chart on Regional Comparison - Europe
Data Table on Regional Comparison - Europe

13.5.1 Germany - Market size and forecast 2025-2030

Chart on Germany - Market size and forecast 2025-2030 ($ million)
Data Table on Germany - Market size and forecast 2025-2030 ($ million)
Chart on Germany - Year-over-year growth 2025-2030 (%)
Data Table on Germany - Year-over-year growth 2025-2030 (%)

13.5.2 UK - Market size and forecast 2025-2030

Chart on UK - Market size and forecast 2025-2030 ($ million)
Data Table on UK - Market size and forecast 2025-2030 ($ million)
Chart on UK - Year-over-year growth 2025-2030 (%)
Data Table on UK - Year-over-year growth 2025-2030 (%)

13.5.3 France - Market size and forecast 2025-2030

Chart on France - Market size and forecast 2025-2030 ($ million)
Data Table on France - Market size and forecast 2025-2030 ($ million)
Chart on France - Year-over-year growth 2025-2030 (%)
Data Table on France - Year-over-year growth 2025-2030 (%)

13.5.4 Italy - Market size and forecast 2025-2030

Chart on Italy - Market size and forecast 2025-2030 ($ million)
Data Table on Italy - Market size and forecast 2025-2030 ($ million)
Chart on Italy - Year-over-year growth 2025-2030 (%)
Data Table on Italy - Year-over-year growth 2025-2030 (%)

13.5.5 Spain - Market size and forecast 2025-2030

Chart on Spain - Market size and forecast 2025-2030 ($ million)
Data Table on Spain - Market size and forecast 2025-2030 ($ million)
Chart on Spain - Year-over-year growth 2025-2030 (%)
Data Table on Spain - Year-over-year growth 2025-2030 (%)

13.5.6 The Netherlands - Market size and forecast 2025-2030

Chart on The Netherlands - Market size and forecast 2025-2030 ($ million)
Data Table on The Netherlands - Market size and forecast 2025-2030 ($ million)
Chart on The Netherlands - Year-over-year growth 2025-2030 (%)
Data Table on The Netherlands - Year-over-year growth 2025-2030 (%)

13.6 Middle East and Africa - Market size and forecast 2025-2030

Chart on Middle East and Africa - Market size and forecast 2025-2030 ($ million)
Data Table on Middle East and Africa - Market size and forecast 2025-2030 ($ million)
Chart on Middle East and Africa - Year-over-year growth 2025-2030 (%)
Data Table on Middle East and Africa - Year-over-year growth 2025-2030 (%)
Chart on Regional Comparison - Middle East and Africa
Data Table on Regional Comparison - Middle East and Africa

13.6.1 Saudi Arabia - Market size and forecast 2025-2030

Chart on Saudi Arabia - Market size and forecast 2025-2030 ($ million)
Data Table on Saudi Arabia - Market size and forecast 2025-2030 ($ million)
Chart on Saudi Arabia - Year-over-year growth 2025-2030 (%)
Data Table on Saudi Arabia - Year-over-year growth 2025-2030 (%)

13.6.2 UAE - Market size and forecast 2025-2030

Chart on UAE - Market size and forecast 2025-2030 ($ million)
Data Table on UAE - Market size and forecast 2025-2030 ($ million)
Chart on UAE - Year-over-year growth 2025-2030 (%)
Data Table on UAE - Year-over-year growth 2025-2030 (%)

13.6.3 South Africa - Market size and forecast 2025-2030

Chart on South Africa - Market size and forecast 2025-2030 ($ million)
Data Table on South Africa - Market size and forecast 2025-2030 ($ million)
Chart on South Africa - Year-over-year growth 2025-2030 (%)
Data Table on South Africa - Year-over-year growth 2025-2030 (%)

13.6.4 Israel - Market size and forecast 2025-2030

Chart on Israel - Market size and forecast 2025-2030 ($ million)
Data Table on Israel - Market size and forecast 2025-2030 ($ million)
Chart on Israel - Year-over-year growth 2025-2030 (%)
Data Table on Israel - Year-over-year growth 2025-2030 (%)

13.6.5 Turkey - Market size and forecast 2025-2030

Chart on Turkey - Market size and forecast 2025-2030 ($ million)
Data Table on Turkey - Market size and forecast 2025-2030 ($ million)
Chart on Turkey - Year-over-year growth 2025-2030 (%)
Data Table on Turkey - Year-over-year growth 2025-2030 (%)

13.7 South America - Market size and forecast 2025-2030

Chart on South America - Market size and forecast 2025-2030 ($ million)
Data Table on South America - Market size and forecast 2025-2030 ($ million)
Chart on South America - Year-over-year growth 2025-2030 (%)
Data Table on South America - Year-over-year growth 2025-2030 (%)
Chart on Regional Comparison - South America
Data Table on Regional Comparison - South America

13.7.1 Brazil - Market size and forecast 2025-2030

Chart on Brazil - Market size and forecast 2025-2030 ($ million)
Data Table on Brazil - Market size and forecast 2025-2030 ($ million)
Chart on Brazil - Year-over-year growth 2025-2030 (%)
Data Table on Brazil - Year-over-year growth 2025-2030 (%)

13.7.2 Argentina - Market size and forecast 2025-2030

Chart on Argentina - Market size and forecast 2025-2030 ($ million)
Data Table on Argentina - Market size and forecast 2025-2030 ($ million)
Chart on Argentina - Year-over-year growth 2025-2030 (%)
Data Table on Argentina - Year-over-year growth 2025-2030 (%)

13.7.3 Chile - Market size and forecast 2025-2030

Chart on Chile - Market size and forecast 2025-2030 ($ million)
Data Table on Chile - Market size and forecast 2025-2030 ($ million)
Chart on Chile - Year-over-year growth 2025-2030 (%)
Data Table on Chile - Year-over-year growth 2025-2030 (%)

13.8 Market opportunity by geography

Market opportunity by geography ($ million)
Data Tables on Market opportunity by geography ($ million)

14. Drivers, Challenges, and Opportunity

14.1 Market drivers

Growing demand for AR and VR technology
Innovative AR and VR product launches
Increasing number of mergers and acquisitions activities

14.2 Market challenges

High development costs associated with AR and VR apps
Risks associated with AR and VR applications
Limitations of AR and VR technology

14.3 Impact of drivers and challenges

Impact of drivers and challenges in 2025 and 2030

14.4 Market opportunities

Growing funding in startup AR and VR companies from investors
Diverse applications of AR and VR technology is amplifying market expedition rate
Integration of extended reality (XR) in market is amplifying growth

15. Competitive Landscape

15.1 Overview

15.2

Overview on criticality of inputs and factors of differentiation

15.3 Landscape disruption

Overview on factors of disruption

15.4 Industry risks

Impact of key risks on business

16. Competitive Analysis

16.1 Companies profiled

Companies covered

16.2 Company ranking index

16.3 Market positioning of companies

Matrix on companies position and classification

16.4 Apple Inc.

Apple Inc. - Overview
Apple Inc. - Business segments
Apple Inc. - Key news
Apple Inc. - Key offerings
Apple Inc. - Segment focus
SWOT

16.5 Epic Games Inc.

Epic Games Inc. - Overview
Epic Games Inc. - Product / Service
Epic Games Inc. - Key offerings
SWOT

16.6 Google LLC

Google LLC - Overview
Google LLC - Product / Service
Google LLC - Key offerings
SWOT

16.7 Groove Jones LLC

Groove Jones LLC - Overview
Groove Jones LLC - Product / Service
Groove Jones LLC - Key offerings
SWOT

16.8 HTC Corp.

HTC Corp. - Overview
HTC Corp. - Product / Service
HTC Corp. - Key offerings
SWOT

16.9 Lenovo Group Ltd.

Lenovo Group Ltd. - Overview
Lenovo Group Ltd. - Business segments
Lenovo Group Ltd. - Key offerings
Lenovo Group Ltd. - Segment focus
SWOT

16.10 Magic Leap Inc.

Magic Leap Inc. - Overview
Magic Leap Inc. - Product / Service
Magic Leap Inc. - Key offerings
SWOT

16.11 Meta Platforms Inc.

Meta Platforms Inc. - Overview
Meta Platforms Inc. - Business segments
Meta Platforms Inc. - Key offerings
Meta Platforms Inc. - Segment focus
SWOT

16.12 Microsoft Corp.

Microsoft Corp. - Overview
Microsoft Corp. - Business segments
Microsoft Corp. - Key news
Microsoft Corp. - Key offerings
Microsoft Corp. - Segment focus
SWOT

16.13 Niantic Inc.

Niantic Inc. - Overview
Niantic Inc. - Product / Service
Niantic Inc. - Key offerings
SWOT

16.14 PTC Inc.

PTC Inc. - Overview
PTC Inc. - Business segments
PTC Inc. - Key offerings
PTC Inc. - Segment focus
SWOT

16.15 Samsung Electronics Co. Ltd.

Samsung Electronics Co. Ltd. - Overview
Samsung Electronics Co. Ltd. - Business segments
Samsung Electronics Co. Ltd. - Key news
Samsung Electronics Co. Ltd. - Key offerings
Samsung Electronics Co. Ltd. - Segment focus
SWOT

16.16 Seiko Epson Corp.

Seiko Epson Corp. - Overview
Seiko Epson Corp. - Business segments
Seiko Epson Corp. - Key offerings
Seiko Epson Corp. - Segment focus
SWOT

16.17 Sony Group Corp.

Sony Group Corp. - Overview
Sony Group Corp. - Business segments
Sony Group Corp. - Key news
Sony Group Corp. - Key offerings
Sony Group Corp. - Segment focus
SWOT

16.18 Xiaomi Corp.

Xiaomi Corp. - Overview
Xiaomi Corp. - Business segments
Xiaomi Corp. - Key offerings
Xiaomi Corp. - Segment focus
SWOT

17. Appendix

17.1 Scope of the report

Market definition
Objectives
Notes and caveats

17.2 Inclusions and exclusions checklist

Inclusions checklist
Exclusions checklist

17.3 Currency conversion rates for US$

17.4 Research methodology

17.5 Data procurement

Information sources

17.6 Data validation

17.7 Validation techniques employed for market sizing

17.8 Data synthesis

17.9 360 degree market analysis

17.10 List of abbreviations

Research Methodology

Technavio presents a detailed picture of the market by way of study, synthesis, and summation of data from multiple sources. The analysts have presented the various facets of the market with a particular focus on identifying the key industry influencers. The data thus presented is comprehensive, reliable, and the result of extensive research, both primary and secondary.

INFORMATION SOURCES

Primary sources

  • Manufacturers and suppliers
  • Channel partners
  • Industry experts
  • Strategic decision makers

Secondary sources

  • Industry journals and periodicals
  • Government data
  • Financial reports of key industry players
  • Historical data
  • Press releases

DATA ANALYSIS

Data Synthesis

  • Collation of data
  • Estimation of key figures
  • Analysis of derived insights

Data Validation

  • Triangulation with data models
  • Reference against proprietary databases
  • Corroboration with industry experts

REPORT WRITING

Qualitative

  • Market drivers
  • Market challenges
  • Market trends
  • Five forces analysis

Quantitative

  • Market size and forecast
  • Market segmentation
  • Geographical insights
  • Competitive landscape

Interested in this report?

Get your sample now to see our research methodology and insights!

Download Now

Frequently Asked Questions

Augmented Reality And Virtual Reality market growth will increase by USD 777123.6 million during 2026-2030.

The Augmented Reality And Virtual Reality market is expected to grow at a CAGR of 48.1% during 2026-2030.

Augmented Reality And Virtual Reality market is segmented by Technology (AR, VR) Application (Consumer, Enterprise) Component (Hardware, Software) End-user (Aerospace and defense, Consumer, Commercial, Enterprise, Others)

Apple Inc., Epic Games Inc., Google LLC, Groove Jones LLC, HTC Corp., Lenovo Group Ltd., Magic Leap Inc., Meta Platforms Inc., Microsoft Corp., Niantic Inc., PTC Inc., Samsung Electronics Co. Ltd., Seiko Epson Corp., Sony Group Corp., Ultraleap Ltd., Unity Technologies Inc., Varjo Technologies Oy, VirtaMed AG, Vuzix Corp., Wikitude GmbH, Xiaomi Corp. are a few of the key vendors in the Augmented Reality And Virtual Reality market.

APAC will register the highest growth rate of 34.2% among the other regions. Therefore, the Augmented Reality And Virtual Reality market in APAC is expected to garner significant business opportunities for the vendors during the forecast period.

China, Japan, India, South Korea, Australia, Indonesia, US, Canada, Mexico, Germany, UK, France, Italy, Spain, The Netherlands, Saudi Arabia, UAE, South Africa, Israel, Turkey, Brazil, Argentina, Chile

  • Growing demand for AR and VR technology is the driving factor this market.

The Augmented Reality And Virtual Reality market vendors should focus on grabbing business opportunities from the Technology segment as it accounted for the largest market share in the base year.
RIA - Research AI Assistant
Ask RIA