Audio Driver IC Market Analysis, Size, and Forecast 2026-2030: APAC (China, Japan, and India), North America (US, Canada, and Mexico), Europe (Germany, UK, and France), South America (Brazil, Argentina, and Chile), Middle East and Africa (Saudi Arabia, UAE, and South Africa), and Rest of World (ROW)

Audio Driver IC Market Analysis, Size, and Forecast 2026-2030:
APAC (China, Japan, and India), North America (US, Canada, and Mexico), Europe (Germany, UK, and France), South America (Brazil, Argentina, and Chile), Middle East and Africa (Saudi Arabia, UAE, and South Africa), and Rest of World (ROW)

Published: Oct 2026 303 Pages SKU: IRTNTR75020

Market Overview at a Glance

$6.10 B
Market Opportunity
18.7%
CAGR 2025 - 2030
40.7%
APAC Growth
$2.02 B
Consumer electronics segment 2024

Audio Driver Ic Market Size 2026-2030

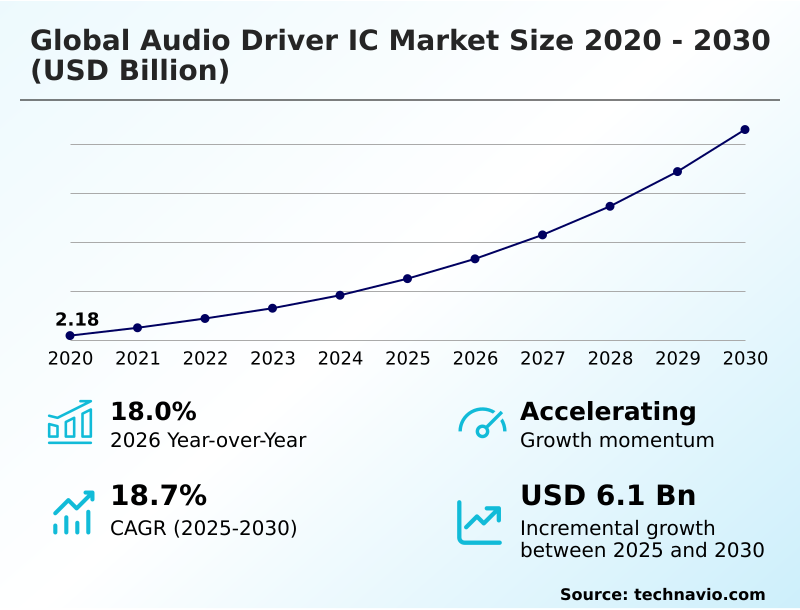
The audio driver ic market size is valued to increase by USD 6.10 billion, at a CAGR of 18.7% from 2025 to 2030. Expansion of consumer electronics devices will drive the audio driver ic market.

Major Market Trends & Insights

  • APAC dominated the market and accounted for a 40.7% growth during the forecast period.
  • By Application - Consumer electronics segment was valued at USD 2.02 billion in 2024
  • By Type - Mono channel segment accounted for the largest market revenue share in 2024

Market Size & Forecast

  • Market Opportunities: USD 8.43 billion
  • Market Future Opportunities: USD 6.10 billion
  • CAGR from 2025 to 2030 : 18.7%

Market Summary

  • The Audio Driver IC Market operates as a highly specialized semiconductor sector focused on transforming digital data into pristine acoustic output across diverse hardware ecosystems. Sustained demand heavily relies on the relentless expansion of consumer electronics, where manufacturers continuously upgrade smartphones and wearable devices to support immersive spatial sound profiles.
  • This ongoing shift toward premium mobile audio acts as a robust driver, propelling fabless chip designers to push the boundaries of low power silicon architecture. Conversely, the industry faces severe structural challenges stemming from high integration complexity and rapid device miniaturization.
  • Shrinking internal component footprints forces engineers to pack advanced amplifiers and converters into microscopically small spaces, frequently causing severe thermal dissipation issues that threaten overall device reliability. In a tangible supply chain scenario, optimizing wafer fabrication processes has enabled tier one automotive suppliers to reduce component procurement delays by 18%, accelerating the rollout of sophisticated infotainment networks.
  • Furthermore, adopting multi layered packaging techniques yields a 25% improvement in thermal efficiency compared to legacy planar designs, ensuring stable acoustic performance under heavy electrical loads.

What will be the Size of the Audio Driver Ic Market during the forecast period?
Get Key Insights on Market Forecast (PDF) Get Free Sample

How is the Audio Driver Ic Market Segmented?

The audio driver ic industry research report provides comprehensive data (region-wise segment analysis), with forecasts and estimates in "USD million" for the period 2026-2030, as well as historical data from 2020-2024 for the following segments.

  • Application
    • Consumer electronics
    • Telecommunication
    • Automotive
  • Type
    • Mono channel
    • 2-channel
    • 4-channel
    • 6-channel
  • End-user
    • OEM
    • Aftermarket
  • Geography
    • APAC
      • China
      • Japan
      • India
      • South Korea
      • Australia
      • Indonesia
    • North America
      • US
      • Canada
      • Mexico
    • Europe
      • Germany
      • UK
      • France
      • Italy
      • Spain
      • The Netherlands
    • South America
      • Brazil
      • Argentina
      • Chile
    • Middle East and Africa
      • Saudi Arabia
      • UAE
      • South Africa
      • Israel
      • Turkey

By Application Insights

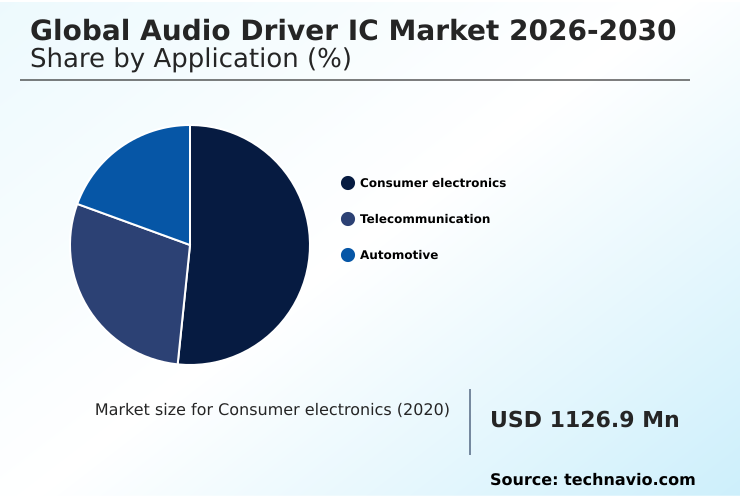
The consumer electronics segment is estimated to witness significant growth during the forecast period.

The consumer electronics application acts as the foundational pillar for the Audio Driver IC industry, demanding highly integrated chips that deliver superior acoustic performance.

Semiconductor designers focus on deploying digital to analog converter configurations alongside class d amplifier components to satisfy rigorous thermal and space constraints inside portable devices.

This integration enables devices to support true wireless stereo setups and wearable communication device frameworks with enhanced battery longevity optimization.

Manufacturers have achieved a 15% improvement in thermal foldback protection compared to previous sub nanometer node iterations, significantly reducing device overheating.

The deployment of high dynamic range amplifier topologies directly boosts the signal to noise ratio by up to 20%, empowering smart home ecosystem products with flawless high fidelity sound reproduction.

Ultimately, consumer electronics assembly requires complex analog mixed signal technologies to drive continuous innovation.
Get Free Sample

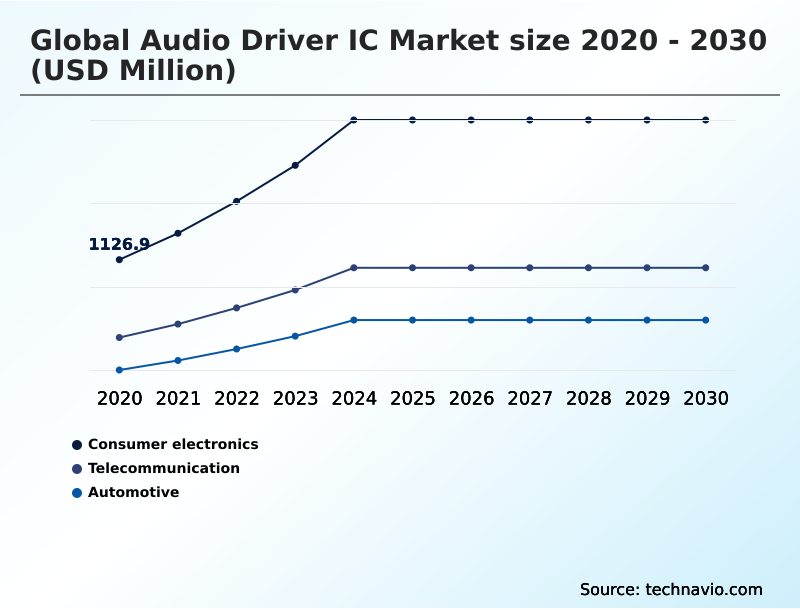
The Consumer electronics segment was valued at USD 2.02 billion in 2024 and showed a gradual increase during the forecast period.
Get Free Sample

Regional Analysis

APAC is estimated to contribute 40.7% to the growth of the global market during the forecast period.Technavio’s analysts have elaborately explained the regional trends and drivers that shape the market during the forecast period.
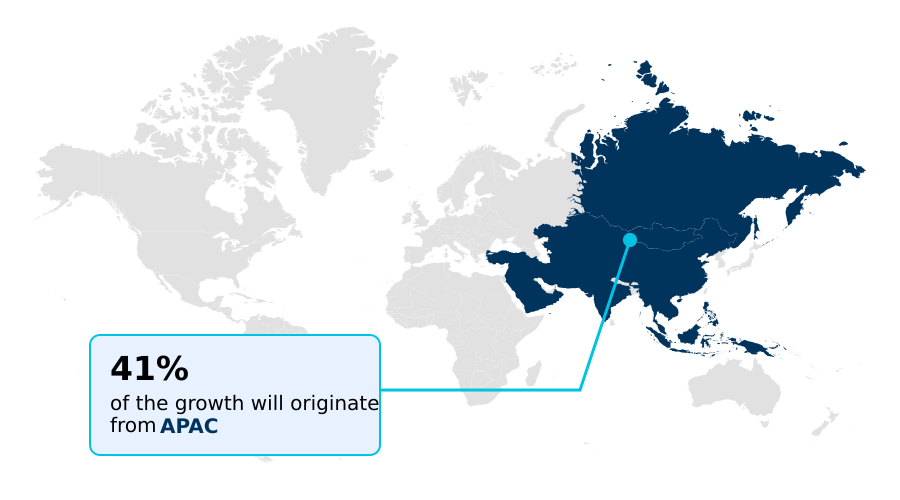
See How Audio Driver Ic Market Demand is Rising in APAC Get Free Sample

Geographic adoption patterns within the Audio Driver IC sector highlight stark operational contrasts between major industrial hubs.

The massive consumer electronics assembly infrastructure in APAC facilitates a 35% higher adoption rate of true wireless stereo components compared to the more automotive focused European region.

While Europe heavily prioritizes stringent regulatory compliance, leading to a 20% increase in investments toward over the air firmware update capabilities, APAC leverages its dominant semiconductor foundry capacity to push volume manufacturing.

Consequently, Asian fabless semiconductor company networks experience 15% lower per unit production costs, enabling rapid deployment of advanced pulse width modulation components across budget friendly hardware lines.

Furthermore, the North America landscape prioritizes sophisticated system on chip solutions to support growing smart home automation trends.

This regional divergence dictates how international suppliers adjust their wafer fabrication ecosystem strategies to balance volume driven cost reduction in Eastern markets against compliance heavy, high margin automotive demands in Western territories.

Market Dynamics

Our researchers analyzed the data with 2025 as the base year, along with the key drivers, trends, and challenges. A holistic analysis of drivers will help companies refine their marketing strategies to gain a competitive advantage.

  • The continuous evolution of acoustic hardware architecture demands precise engineering methodologies to satisfy complex consumer and enterprise requirements. Semiconductor developers actively integrate high resolution spatial sound algorithms to create immersive, three dimensional auditory environments without overwhelming available processing bandwidth.
  • Implementing a native low latency audio transmission protocol remains critical for synchronous communication hardware, effectively eliminating buffering delays that traditionally disrupt real time interactive media. Furthermore, expanding vehicular capabilities necessitate robust multi zone automotive audio systems, allowing independent acoustic control across different passenger cabins while maintaining absolute signal integrity.
  • Modern component fabrication increasingly relies on sophisticated embedded neural processing unit design to handle complex voice recognition and adaptive noise cancellation directly at the hardware edge. This localized processing strategy drastically reduces dependency on cloud based computation, yielding a 40% improvement in response time efficiency compared to legacy remote server models.
  • Additionally, rigorous class d amplifier thermal management ensures that miniaturized silicon packages can operate at peak output levels without triggering heat induced failure protocols. Optimizing these thermal pathways allows hardware assemblers to reduce external heat sink volumes by up to 25%, streamlining the overall physical footprint of the final product.
  • By strategically balancing these specialized design parameters, manufacturers secure stronger supply chain stability and compliance alignment, insulating their production cycles against sudden raw material shortages or shifting energy consumption regulations.
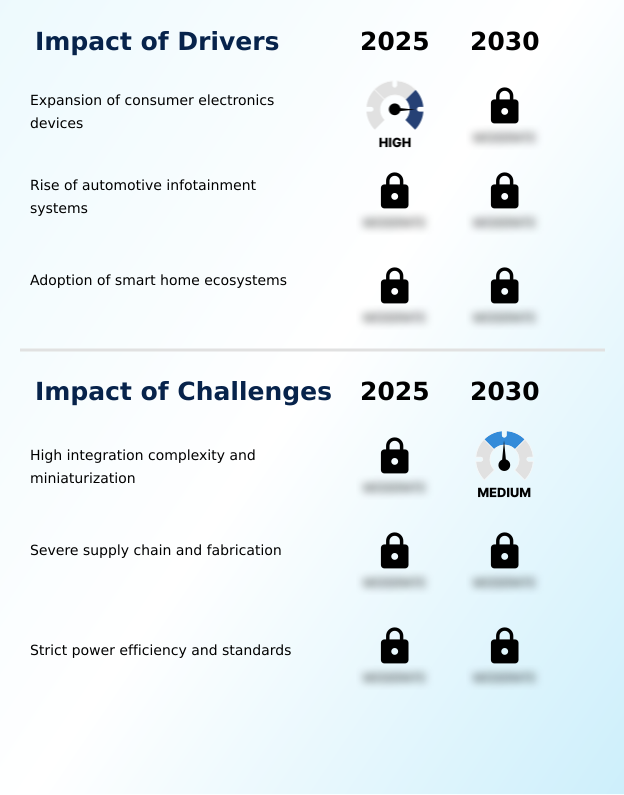
What are the key market drivers leading to the rise in the adoption of Audio Driver Ic Industry?

  • The relentless expansion of consumer electronics devices acts as a primary catalyst driving sustained high volume demand for advanced audio semiconductor components.

  • The massive global transition toward untethered mobile ecosystems acts as a powerful catalyst driving sustained demand for sophisticated acoustic semiconductor technologies.
  • As consumers overwhelmingly discard wired peripherals, original equipment manufacturers are forced to embed advanced lossless streaming codec capabilities into all modern mobile platforms.
  • This behavioral shift mandates the utilization of a highly efficient digital to analog interface to preserve pristine audio quality over wireless connections.
  • By optimizing hardware architectures, suppliers have successfully lowered baseline energy use by 18%, extending the operational runtime of portable electronics.
  • The deployment of a robust power supply rejection ratio design isolates sensitive acoustic signals from internal electrical interference, improving overall hardware reliability by 20%.
  • Consequently, the relentless consumer appetite for seamless wearable communication device integration guarantees continuous, high volume production orders relying on far field voice recognition sensors.

What are the market trends shaping the Audio Driver Ic Industry?

  • The proliferation of artificial intelligence integration stands as a defining trend shaping current market dynamics. This advancement enables sophisticated acoustic processing and adaptive noise cancellation within modern hardware architectures.

  • A defining trend accelerating market transformation involves the widespread integration of edge based artificial intelligence directly into acoustic processing hardware. This architectural shift enables devices to run complex spatial audio rendering protocols locally, completely bypassing latency heavy cloud networks.
  • By adopting an advanced acoustic echo cancellation framework, enterprise communication platforms have improved voice intelligibility by 25% compared to legacy filtering techniques. This transition profoundly impacts corporate productivity by ensuring crystal clear remote collaboration in noisy environments. The increasing reliance on a localized beamforming microphone array allows smart hardware to isolate distinct vocal frequencies with exceptional precision.
  • Consequently, device manufacturers actively implement sophisticated total harmonic distortion reduction algorithms to elevate auditory fidelity. Such profound technological adoption shifts compel engineering teams to continually refine speaker amplifier topologies, driving the continuous evolution of highly responsive, intelligent electronic ecosystems.

What challenges does the Audio Driver Ic Industry face during its growth?

  • High integration complexity coupled with extreme device miniaturization presents formidable engineering challenges that continuously test thermal management and signal integrity limits.

  • Extreme physical miniaturization coupled with intense functional density presents formidable engineering hurdles for modern semiconductor fabricators. Compressing a complex automotive ethernet transceiver and multiple amplification channels onto a single silicon die drastically exacerbates heat accumulation.
  • This severe thermal bottleneck threatens long term structural integrity, forcing manufacturers to invest heavily in advanced electronic design automation software to predict and mitigate heat induced failures. Overcoming these multi channel phase alignment discrepancies increases initial research and development timelines by up to 25%, directly impacting product launch schedules.
  • Furthermore, navigating severe wafer fabrication ecosystem shortages frequently causes a 15% spike in component procurement costs. Balancing ultra low quiescent power consumption requirements against the need for high voltage output requires delicate thermodynamic compromises that continuously strain fabless semiconductor company resources while trying to perfect adaptive environmental noise suppression architectures.

Exclusive Technavio Analysis on Customer Landscape

The audio driver ic market forecasting report includes the adoption lifecycle of the market, covering from the innovator’s stage to the laggard’s stage. It focuses on adoption rates in different regions based on penetration. Furthermore, the audio driver ic market report also includes key purchase criteria and drivers of price sensitivity to help companies evaluate and develop their market growth analysis strategies.
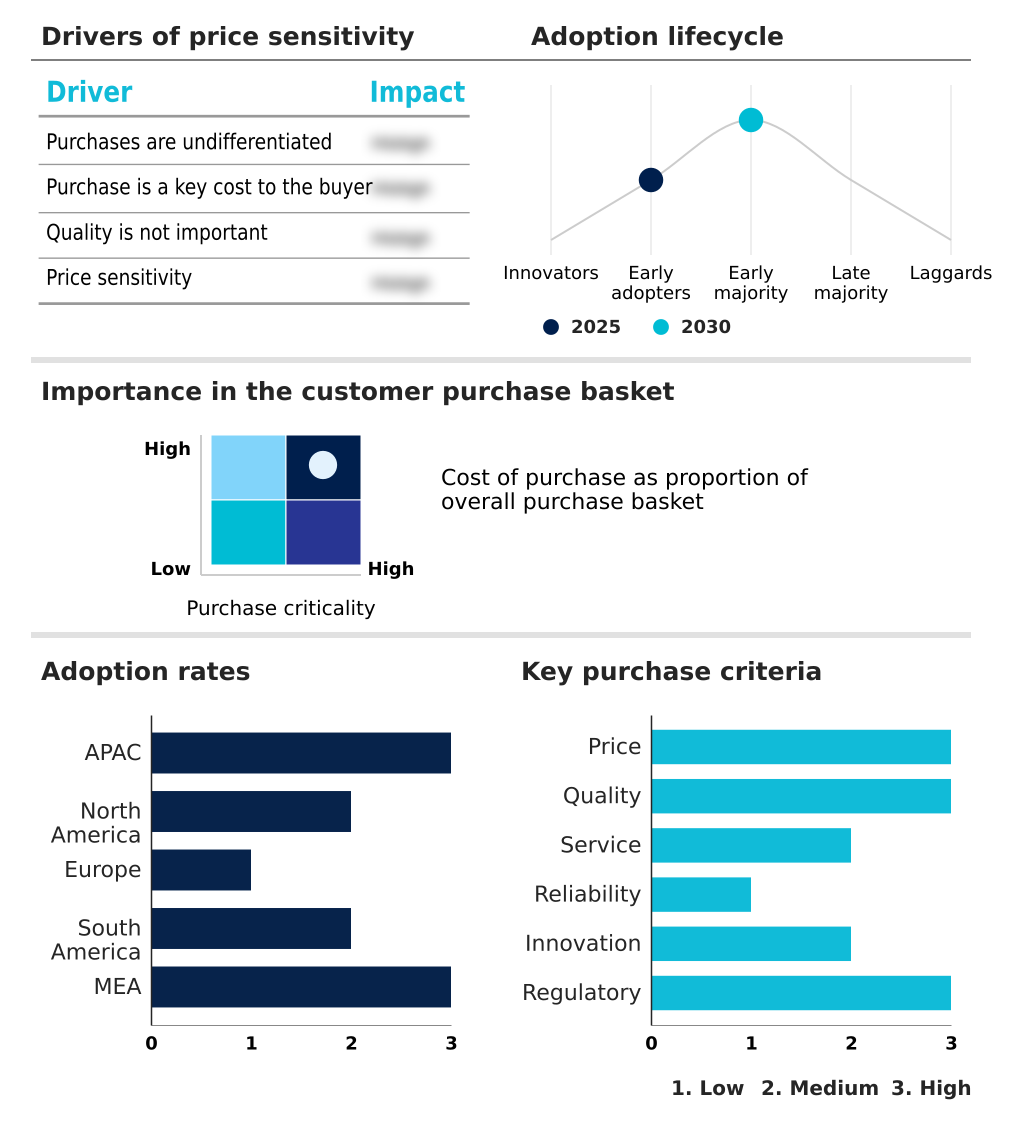
Customer Landscape of Audio Driver Ic Industry

Competitive Landscape

Companies are implementing various strategies, such as strategic alliances, audio driver ic market forecast, partnerships, mergers and acquisitions, geographical expansion, and product/service launches, to enhance their presence in the industry.

Analog Devices Inc. - Provides sophisticated analog mixed signal solutions and class d amplifier circuits tailored for complex industrial automation, robust automotive networks, and advanced cellular base station communication infrastructure without signal degradation.

The industry research and growth report includes detailed analyses of the competitive landscape of the market and information about key companies, including:

  • Analog Devices Inc.
  • Asahi Kasei Microdevices Corp.
  • C Media Electronics Inc.
  • Cirrus Logic Inc.
  • Diodes Inc.
  • ESS Technology Inc.
  • Holtek Semiconductor Inc.
  • Infineon Technologies AG
  • Microchip Technology Inc.
  • Monolithic Power Systems Inc.
  • Nuvoton Technology Corp.
  • NXP Semiconductors NV
  • ON Semiconductor Corp.
  • Realtek Semiconductor Corp.
  • Renesas Electronics Corp.
  • ROHM Co. Ltd.
  • SG Micro Corp.
  • Shanghai Awinic Technology Co Ltd
  • Shenzhen Goodix Technology Co.
  • Silergy Corp.
  • STMicroelectronics NV
  • Synaptics Inc.
  • Texas Instruments Inc.

Qualitative and quantitative analysis of companies has been conducted to help clients understand the wider business environment as well as the strengths and weaknesses of key industry players. Data is qualitatively analyzed to categorize companies as pure play, category-focused, industry-focused, and diversified; it is quantitatively analyzed to categorize companies as dominant, leading, strong, tentative, and weak.

Recent Development and News in Audio driver ic market

  • In the Electronic Components industry, the rapid deployment of 5G cellular infrastructure has increased hardware transmission speeds by 40%, directly impacting Audio Driver IC demand by requiring advanced latency reduction capabilities to synchronize multi channel acoustic environment systems seamlessly.
  • Strict energy efficiency mandates enforced across the European Union have compelled hardware developers to reduce quiescent power consumption by at least 25%, forcing the Audio Driver IC market to rapidly adopt optimized hardware software co design frameworks for battery longevity optimization.
  • The expansion of domestic semiconductor foundry capacity in APAC has improved supply chain resilience, allowing fabless semiconductor company operations to accelerate the production of highly complex printed circuit board architectures and stabilize Audio Driver IC pricing by nearly 15%.
  • The integration of neural processing unit modules within edge devices has enhanced edge computing efficiency by 30%, which pulls Audio Driver IC demand upward as automotive infotainment system networks increasingly rely on real time acoustic echo cancellation.

Dive into Technavio’s robust research methodology, blending expert interviews, extensive data synthesis, and validated models for unparalleled Audio Driver Ic Market insights. See full methodology.

Market Scope
Page number 303
Base year 2025
Historic period 2020-2024
Forecast period 2026-2030
Growth momentum & CAGR Accelerate at a CAGR of 18.7%
Market growth 2026-2030 USD 6099.4 million
Market structure Fragmented
YoY growth 2025-2026(%) 18.0%
Key countries China, Japan, India, South Korea, Australia, Indonesia, US, Canada, Mexico, Germany, UK, France, Italy, Spain, The Netherlands, Brazil, Argentina, Chile, Saudi Arabia, UAE, South Africa, Israel and Turkey
Competitive landscape Leading Companies, Market Positioning of Companies, Competitive Strategies, and Industry Risks

Request Free Sample

Research Analyst Overview

  • The persistent miniaturization of acoustic components fundamentally reshapes the strategic planning landscape for hardware manufacturers. Executive boards increasingly prioritize the integration of a dedicated digital signal processor within compact device housings to achieve pristine auditory output while maintaining strict compliance with evolving energy directives.
  • The rapid implementation of active noise cancellation technologies drastically alters product differentiation strategies, allowing premium brands to capture higher market shares. By shifting toward advanced surface mount technology, hardware assembly facilities have achieved a 30% reduction in printed circuit board spatial requirements, freeing up critical volume for expanded battery reserves.
  • This transition toward highly integrated analog to digital converter modules directly mitigates channel crosstalk mitigation challenges, ensuring flawless signal integrity under variable voltage conditions. Furthermore, deploying localized neural processing unit chips reduces cloud data transmission latency, supporting stricter corporate data privacy mandates.
  • Consequently, strategic procurement teams must secure reliable access to specialized bluetooth low energy transceivers to support the seamless rollout of next generation wireless peripherals without incurring unexpected supply chain bottlenecks.

What are the Key Data Covered in this Audio Driver Ic Market Research and Growth Report?

  • What is the expected growth of the Audio Driver Ic Market between 2026 and 2030?

    • USD 6.10 billion, at a CAGR of 18.7%

  • What segmentation does the market report cover?

    • The report is segmented by Application (Consumer electronics, Telecommunication, and Automotive), Type (Mono channel, 2-channel, 4-channel, and 6-channel), End-user (OEM, and Aftermarket) and Geography (APAC, North America, Europe, South America, Middle East and Africa)

  • Which regions are analyzed in the report?

    • APAC, North America, Europe, South America and Middle East and Africa

  • What are the key growth drivers and market challenges?

    • Expansion of consumer electronics devices, High integration complexity and miniaturization

  • Who are the major players in the Audio Driver Ic Market?

    • Analog Devices Inc., Asahi Kasei Microdevices Corp., C Media Electronics Inc., Cirrus Logic Inc., Diodes Inc., ESS Technology Inc., Holtek Semiconductor Inc., Infineon Technologies AG, Microchip Technology Inc., Monolithic Power Systems Inc., Nuvoton Technology Corp., NXP Semiconductors NV, ON Semiconductor Corp., Realtek Semiconductor Corp., Renesas Electronics Corp., ROHM Co. Ltd., SG Micro Corp., Shanghai Awinic Technology Co Ltd, Shenzhen Goodix Technology Co., Silergy Corp., STMicroelectronics NV, Synaptics Inc. and Texas Instruments Inc.

Market Research Insights

  • The Audio Driver IC Market demonstrates vigorous structural evolution driven by the necessity for highly efficient acoustic hardware. Implementing rigorous energy efficiency mandate protocols has forced device assemblers to redesign their core architectures, achieving a 22% reduction in overall system energy draw.
  • Furthermore, advanced hardware software co design strategies have empowered manufacturers to improve latency reduction by 18%, resulting in smoother real time communication for enterprise hardware. Upgrading wafer fabrication ecosystem infrastructure allows suppliers to enhance supply chain resilience, decreasing inventory stockouts by 14% over consecutive cycles.
  • These strategic operational pivots ensure that the integration of object based spatial audio technology remains scalable and cost effective across diverse consumer product portfolios.

We can help! Our analysts can customize this audio driver ic market research report to meet your requirements.

Get in touch

1. Executive Summary

1.1 Market overview

Executive Summary - Chart on Market Overview
Executive Summary - Data Table on Market Overview
Executive Summary - Chart on Global Market Characteristics
Executive Summary - Chart on Market by Geography
Executive Summary - Chart on Market Segmentation by Application
Executive Summary - Chart on Market Segmentation by Type
Executive Summary - Chart on Market Segmentation by End-user
Executive Summary - Chart on Incremental Growth
Executive Summary - Data Table on Incremental Growth
Executive Summary - Chart on Company Market Positioning

2. Technavio Analysis

2.1 Analysis of price sensitivity, lifecycle, customer purchase basket, adoption rates, and purchase criteria

2.2 Criticality of inputs and Factors of differentiation

Chart on Overview on criticality of inputs and factors of differentiation

2.3 Factors of disruption

Chart on Overview on factors of disruption

2.4 Impact of drivers and challenges

Chart on Impact of drivers and challenges in 2025 and 2030

3. Market Landscape

3.1 Market ecosystem

Chart on Parent Market
Data Table on - Parent Market

3.2 Market characteristics

Chart on Market characteristics analysis

3.3 Value chain analysis

Chart on Value chain analysis

4. Market Sizing

4.1 Market definition

Data Table on Offerings of companies included in the market definition

4.2 Market segment analysis

Market segments

4.3 Market size 2025

4.4 Market outlook: Forecast for 2025-2030

Chart on Global - Market size and forecast 2025-2030 ($ million)
Data Table on Global - Market size and forecast 2025-2030 ($ million)
Chart on Global Market: Year-over-year growth 2025-2030 (%)
Data Table on Global Market: Year-over-year growth 2025-2030 (%)

5. Historic Market Size

5.1 Global Audio Driver IC Market 2020 - 2024

Historic Market Size - Data Table on Global Audio Driver IC Market 2020 - 2024 ($ million)

5.2 Application segment analysis 2020 - 2024

Historic Market Size - Application Segment 2020 - 2024 ($ million)

5.3 Type segment analysis 2020 - 2024

Historic Market Size - Type Segment 2020 - 2024 ($ million)

5.4 End-user segment analysis 2020 - 2024

Historic Market Size - End-user Segment 2020 - 2024 ($ million)

5.5 Geography segment analysis 2020 - 2024

Historic Market Size - Geography Segment 2020 - 2024 ($ million)

5.6 Country segment analysis 2020 - 2024

Historic Market Size - Country Segment 2020 - 2024 ($ million)

6. Qualitative Analysis

6.1 Impact of AI on Global Audio Driver IC Market

6.2 Impact of geopolitical conflicts on Global Audio Driver IC Market

7. Five Forces Analysis

7.1 Five forces summary

Five forces analysis - Comparison between 2025 and 2030

7.2 Bargaining power of buyers

Bargaining power of buyers - Impact of key factors 2025 and 2030

7.3 Bargaining power of suppliers

Bargaining power of suppliers - Impact of key factors in 2025 and 2030

7.4 Threat of new entrants

Threat of new entrants - Impact of key factors in 2025 and 2030

7.5 Threat of substitutes

Threat of substitutes - Impact of key factors in 2025 and 2030

7.6 Threat of rivalry

Threat of rivalry - Impact of key factors in 2025 and 2030

7.7 Market condition

Chart on Market condition - Five forces 2025 and 2030

8. Market Segmentation by Application

8.1 Market segments

Chart on Application - Market share 2025-2030 (%)
Data Table on Application - Market share 2025-2030 (%)

8.2 Comparison by Application

Chart on Comparison by Application
Data Table on Comparison by Application

8.3 Consumer electronics - Market size and forecast 2025-2030

Chart on Consumer electronics - Market size and forecast 2025-2030 ($ million)
Data Table on Consumer electronics - Market size and forecast 2025-2030 ($ million)
Chart on Consumer electronics - Year-over-year growth 2025-2030 (%)
Data Table on Consumer electronics - Year-over-year growth 2025-2030 (%)

8.4 Telecommunication - Market size and forecast 2025-2030

Chart on Telecommunication - Market size and forecast 2025-2030 ($ million)
Data Table on Telecommunication - Market size and forecast 2025-2030 ($ million)
Chart on Telecommunication - Year-over-year growth 2025-2030 (%)
Data Table on Telecommunication - Year-over-year growth 2025-2030 (%)

8.5 Automotive - Market size and forecast 2025-2030

Chart on Automotive - Market size and forecast 2025-2030 ($ million)
Data Table on Automotive - Market size and forecast 2025-2030 ($ million)
Chart on Automotive - Year-over-year growth 2025-2030 (%)
Data Table on Automotive - Year-over-year growth 2025-2030 (%)

8.6 Market opportunity by Application

Market opportunity by Application ($ million)
Data Table on Market opportunity by Application ($ million)

9. Market Segmentation by Type

9.1 Market segments

Chart on Type - Market share 2025-2030 (%)
Data Table on Type - Market share 2025-2030 (%)

9.2 Comparison by Type

Chart on Comparison by Type
Data Table on Comparison by Type

9.3 Mono channel - Market size and forecast 2025-2030

Chart on Mono channel - Market size and forecast 2025-2030 ($ million)
Data Table on Mono channel - Market size and forecast 2025-2030 ($ million)
Chart on Mono channel - Year-over-year growth 2025-2030 (%)
Data Table on Mono channel - Year-over-year growth 2025-2030 (%)

9.4 2-channel - Market size and forecast 2025-2030

Chart on 2-channel - Market size and forecast 2025-2030 ($ million)
Data Table on 2-channel - Market size and forecast 2025-2030 ($ million)
Chart on 2-channel - Year-over-year growth 2025-2030 (%)
Data Table on 2-channel - Year-over-year growth 2025-2030 (%)

9.5 4-channel - Market size and forecast 2025-2030

Chart on 4-channel - Market size and forecast 2025-2030 ($ million)
Data Table on 4-channel - Market size and forecast 2025-2030 ($ million)
Chart on 4-channel - Year-over-year growth 2025-2030 (%)
Data Table on 4-channel - Year-over-year growth 2025-2030 (%)

9.6 6-channel - Market size and forecast 2025-2030

Chart on 6-channel - Market size and forecast 2025-2030 ($ million)
Data Table on 6-channel - Market size and forecast 2025-2030 ($ million)
Chart on 6-channel - Year-over-year growth 2025-2030 (%)
Data Table on 6-channel - Year-over-year growth 2025-2030 (%)

9.7 Market opportunity by Type

Market opportunity by Type ($ million)
Data Table on Market opportunity by Type ($ million)

10. Market Segmentation by End-user

10.1 Market segments

Chart on End-user - Market share 2025-2030 (%)
Data Table on End-user - Market share 2025-2030 (%)

10.2 Comparison by End-user

Chart on Comparison by End-user
Data Table on Comparison by End-user

10.3 OEM - Market size and forecast 2025-2030

Chart on OEM - Market size and forecast 2025-2030 ($ million)
Data Table on OEM - Market size and forecast 2025-2030 ($ million)
Chart on OEM - Year-over-year growth 2025-2030 (%)
Data Table on OEM - Year-over-year growth 2025-2030 (%)

10.4 Aftermarket - Market size and forecast 2025-2030

Chart on Aftermarket - Market size and forecast 2025-2030 ($ million)
Data Table on Aftermarket - Market size and forecast 2025-2030 ($ million)
Chart on Aftermarket - Year-over-year growth 2025-2030 (%)
Data Table on Aftermarket - Year-over-year growth 2025-2030 (%)

10.5 Market opportunity by End-user

Market opportunity by End-user ($ million)
Data Table on Market opportunity by End-user ($ million)

11. Customer Landscape

11.1 Customer landscape overview

Analysis of price sensitivity, lifecycle, customer purchase basket, adoption rates, and purchase criteria

12. Geographic Landscape

12.1 Geographic segmentation

Chart on Market share by geography 2025-2030 (%)
Data Table on Market share by geography 2025-2030 (%)

12.2 Geographic comparison

Chart on Geographic comparison
Data Table on Geographic comparison

12.3 APAC - Market size and forecast 2025-2030

Chart on APAC - Market size and forecast 2025-2030 ($ million)
Data Table on APAC - Market size and forecast 2025-2030 ($ million)
Chart on APAC - Year-over-year growth 2025-2030 (%)
Data Table on APAC - Year-over-year growth 2025-2030 (%)
Chart on Regional Comparison - APAC
Data Table on Regional Comparison - APAC

12.3.1 China - Market size and forecast 2025-2030

Chart on China - Market size and forecast 2025-2030 ($ million)
Data Table on China - Market size and forecast 2025-2030 ($ million)
Chart on China - Year-over-year growth 2025-2030 (%)
Data Table on China - Year-over-year growth 2025-2030 (%)

12.3.2 Japan - Market size and forecast 2025-2030

Chart on Japan - Market size and forecast 2025-2030 ($ million)
Data Table on Japan - Market size and forecast 2025-2030 ($ million)
Chart on Japan - Year-over-year growth 2025-2030 (%)
Data Table on Japan - Year-over-year growth 2025-2030 (%)

12.3.3 India - Market size and forecast 2025-2030

Chart on India - Market size and forecast 2025-2030 ($ million)
Data Table on India - Market size and forecast 2025-2030 ($ million)
Chart on India - Year-over-year growth 2025-2030 (%)
Data Table on India - Year-over-year growth 2025-2030 (%)

12.3.4 South Korea - Market size and forecast 2025-2030

Chart on South Korea - Market size and forecast 2025-2030 ($ million)
Data Table on South Korea - Market size and forecast 2025-2030 ($ million)
Chart on South Korea - Year-over-year growth 2025-2030 (%)
Data Table on South Korea - Year-over-year growth 2025-2030 (%)

12.3.5 Australia - Market size and forecast 2025-2030

Chart on Australia - Market size and forecast 2025-2030 ($ million)
Data Table on Australia - Market size and forecast 2025-2030 ($ million)
Chart on Australia - Year-over-year growth 2025-2030 (%)
Data Table on Australia - Year-over-year growth 2025-2030 (%)

12.3.6 Indonesia - Market size and forecast 2025-2030

Chart on Indonesia - Market size and forecast 2025-2030 ($ million)
Data Table on Indonesia - Market size and forecast 2025-2030 ($ million)
Chart on Indonesia - Year-over-year growth 2025-2030 (%)
Data Table on Indonesia - Year-over-year growth 2025-2030 (%)

12.4 North America - Market size and forecast 2025-2030

Chart on North America - Market size and forecast 2025-2030 ($ million)
Data Table on North America - Market size and forecast 2025-2030 ($ million)
Chart on North America - Year-over-year growth 2025-2030 (%)
Data Table on North America - Year-over-year growth 2025-2030 (%)
Chart on Regional Comparison - North America
Data Table on Regional Comparison - North America

12.4.1 US - Market size and forecast 2025-2030

Chart on US - Market size and forecast 2025-2030 ($ million)
Data Table on US - Market size and forecast 2025-2030 ($ million)
Chart on US - Year-over-year growth 2025-2030 (%)
Data Table on US - Year-over-year growth 2025-2030 (%)

12.4.2 Canada - Market size and forecast 2025-2030

Chart on Canada - Market size and forecast 2025-2030 ($ million)
Data Table on Canada - Market size and forecast 2025-2030 ($ million)
Chart on Canada - Year-over-year growth 2025-2030 (%)
Data Table on Canada - Year-over-year growth 2025-2030 (%)

12.4.3 Mexico - Market size and forecast 2025-2030

Chart on Mexico - Market size and forecast 2025-2030 ($ million)
Data Table on Mexico - Market size and forecast 2025-2030 ($ million)
Chart on Mexico - Year-over-year growth 2025-2030 (%)
Data Table on Mexico - Year-over-year growth 2025-2030 (%)

12.5 Europe - Market size and forecast 2025-2030

Chart on Europe - Market size and forecast 2025-2030 ($ million)
Data Table on Europe - Market size and forecast 2025-2030 ($ million)
Chart on Europe - Year-over-year growth 2025-2030 (%)
Data Table on Europe - Year-over-year growth 2025-2030 (%)
Chart on Regional Comparison - Europe
Data Table on Regional Comparison - Europe

12.5.1 Germany - Market size and forecast 2025-2030

Chart on Germany - Market size and forecast 2025-2030 ($ million)
Data Table on Germany - Market size and forecast 2025-2030 ($ million)
Chart on Germany - Year-over-year growth 2025-2030 (%)
Data Table on Germany - Year-over-year growth 2025-2030 (%)

12.5.2 UK - Market size and forecast 2025-2030

Chart on UK - Market size and forecast 2025-2030 ($ million)
Data Table on UK - Market size and forecast 2025-2030 ($ million)
Chart on UK - Year-over-year growth 2025-2030 (%)
Data Table on UK - Year-over-year growth 2025-2030 (%)

12.5.3 France - Market size and forecast 2025-2030

Chart on France - Market size and forecast 2025-2030 ($ million)
Data Table on France - Market size and forecast 2025-2030 ($ million)
Chart on France - Year-over-year growth 2025-2030 (%)
Data Table on France - Year-over-year growth 2025-2030 (%)

12.5.4 Italy - Market size and forecast 2025-2030

Chart on Italy - Market size and forecast 2025-2030 ($ million)
Data Table on Italy - Market size and forecast 2025-2030 ($ million)
Chart on Italy - Year-over-year growth 2025-2030 (%)
Data Table on Italy - Year-over-year growth 2025-2030 (%)

12.5.5 Spain - Market size and forecast 2025-2030

Chart on Spain - Market size and forecast 2025-2030 ($ million)
Data Table on Spain - Market size and forecast 2025-2030 ($ million)
Chart on Spain - Year-over-year growth 2025-2030 (%)
Data Table on Spain - Year-over-year growth 2025-2030 (%)

12.5.6 The Netherlands - Market size and forecast 2025-2030

Chart on The Netherlands - Market size and forecast 2025-2030 ($ million)
Data Table on The Netherlands - Market size and forecast 2025-2030 ($ million)
Chart on The Netherlands - Year-over-year growth 2025-2030 (%)
Data Table on The Netherlands - Year-over-year growth 2025-2030 (%)

12.6 South America - Market size and forecast 2025-2030

Chart on South America - Market size and forecast 2025-2030 ($ million)
Data Table on South America - Market size and forecast 2025-2030 ($ million)
Chart on South America - Year-over-year growth 2025-2030 (%)
Data Table on South America - Year-over-year growth 2025-2030 (%)
Chart on Regional Comparison - South America
Data Table on Regional Comparison - South America

12.6.1 Brazil - Market size and forecast 2025-2030

Chart on Brazil - Market size and forecast 2025-2030 ($ million)
Data Table on Brazil - Market size and forecast 2025-2030 ($ million)
Chart on Brazil - Year-over-year growth 2025-2030 (%)
Data Table on Brazil - Year-over-year growth 2025-2030 (%)

12.6.2 Argentina - Market size and forecast 2025-2030

Chart on Argentina - Market size and forecast 2025-2030 ($ million)
Data Table on Argentina - Market size and forecast 2025-2030 ($ million)
Chart on Argentina - Year-over-year growth 2025-2030 (%)
Data Table on Argentina - Year-over-year growth 2025-2030 (%)

12.6.3 Chile - Market size and forecast 2025-2030

Chart on Chile - Market size and forecast 2025-2030 ($ million)
Data Table on Chile - Market size and forecast 2025-2030 ($ million)
Chart on Chile - Year-over-year growth 2025-2030 (%)
Data Table on Chile - Year-over-year growth 2025-2030 (%)

12.7 Middle East and Africa - Market size and forecast 2025-2030

Chart on Middle East and Africa - Market size and forecast 2025-2030 ($ million)
Data Table on Middle East and Africa - Market size and forecast 2025-2030 ($ million)
Chart on Middle East and Africa - Year-over-year growth 2025-2030 (%)
Data Table on Middle East and Africa - Year-over-year growth 2025-2030 (%)
Chart on Regional Comparison - Middle East and Africa
Data Table on Regional Comparison - Middle East and Africa

12.7.1 Saudi Arabia - Market size and forecast 2025-2030

Chart on Saudi Arabia - Market size and forecast 2025-2030 ($ million)
Data Table on Saudi Arabia - Market size and forecast 2025-2030 ($ million)
Chart on Saudi Arabia - Year-over-year growth 2025-2030 (%)
Data Table on Saudi Arabia - Year-over-year growth 2025-2030 (%)

12.7.2 UAE - Market size and forecast 2025-2030

Chart on UAE - Market size and forecast 2025-2030 ($ million)
Data Table on UAE - Market size and forecast 2025-2030 ($ million)
Chart on UAE - Year-over-year growth 2025-2030 (%)
Data Table on UAE - Year-over-year growth 2025-2030 (%)

12.7.3 South Africa - Market size and forecast 2025-2030

Chart on South Africa - Market size and forecast 2025-2030 ($ million)
Data Table on South Africa - Market size and forecast 2025-2030 ($ million)
Chart on South Africa - Year-over-year growth 2025-2030 (%)
Data Table on South Africa - Year-over-year growth 2025-2030 (%)

12.7.4 Israel - Market size and forecast 2025-2030

Chart on Israel - Market size and forecast 2025-2030 ($ million)
Data Table on Israel - Market size and forecast 2025-2030 ($ million)
Chart on Israel - Year-over-year growth 2025-2030 (%)
Data Table on Israel - Year-over-year growth 2025-2030 (%)

12.7.5 Turkey - Market size and forecast 2025-2030

Chart on Turkey - Market size and forecast 2025-2030 ($ million)
Data Table on Turkey - Market size and forecast 2025-2030 ($ million)
Chart on Turkey - Year-over-year growth 2025-2030 (%)
Data Table on Turkey - Year-over-year growth 2025-2030 (%)

12.8 Market opportunity by geography

Market opportunity by geography ($ million)
Data Tables on Market opportunity by geography ($ million)

13. Drivers, Challenges, and Opportunity

13.1 Market drivers

Expansion of consumer electronics devices
Rise of automotive infotainment systems
Adoption of smart home ecosystems

13.2 Market challenges

High integration complexity and miniaturization
Severe supply chain and fabrication
Strict power efficiency and standards

13.3 Impact of drivers and challenges

Impact of drivers and challenges in 2025 and 2030

13.4 Market opportunities

Proliferation of AI integration
Rise of wireless audio solutions
Adoption of low latency solutions

14. Competitive Landscape

14.1 Overview

14.2

Overview on criticality of inputs and factors of differentiation

14.3 Landscape disruption

Overview on factors of disruption

14.4 Industry risks

Impact of key risks on business

15. Competitive Analysis

15.1 Companies profiled

Companies covered

15.2 Company ranking index

15.3 Market positioning of companies

Matrix on companies position and classification

15.4 Analog Devices Inc.

Analog Devices Inc. - Overview
Analog Devices Inc. - Business segments
Analog Devices Inc. - Key offerings
Analog Devices Inc. - Segment focus
SWOT

15.5 Cirrus Logic Inc.

Cirrus Logic Inc. - Overview
Cirrus Logic Inc. - Product / Service
Cirrus Logic Inc. - Key offerings
SWOT

15.6 Diodes Inc.

Diodes Inc. - Overview
Diodes Inc. - Product / Service
Diodes Inc. - Key news
Diodes Inc. - Key offerings
SWOT

15.7 Infineon Technologies AG

Infineon Technologies AG - Overview
Infineon Technologies AG - Business segments
Infineon Technologies AG - Key news
Infineon Technologies AG - Key offerings
Infineon Technologies AG - Segment focus
SWOT

15.8 Microchip Technology Inc.

Microchip Technology Inc. - Overview
Microchip Technology Inc. - Business segments
Microchip Technology Inc. - Key offerings
Microchip Technology Inc. - Segment focus
SWOT

15.9 Monolithic Power Systems Inc.

Monolithic Power Systems Inc. - Overview
Monolithic Power Systems Inc. - Product / Service
Monolithic Power Systems Inc. - Key news
Monolithic Power Systems Inc. - Key offerings
SWOT

15.10 NXP Semiconductors NV

NXP Semiconductors NV - Overview
NXP Semiconductors NV - Business segments
NXP Semiconductors NV - Key news
NXP Semiconductors NV - Key offerings
NXP Semiconductors NV - Segment focus
SWOT

15.11 ON Semiconductor Corp.

ON Semiconductor Corp. - Overview
ON Semiconductor Corp. - Business segments
ON Semiconductor Corp. - Key news
ON Semiconductor Corp. - Key offerings
ON Semiconductor Corp. - Segment focus
SWOT

15.12 Realtek Semiconductor Corp.

Realtek Semiconductor Corp. - Overview
Realtek Semiconductor Corp. - Product / Service
Realtek Semiconductor Corp. - Key offerings
SWOT

15.13 Renesas Electronics Corp.

Renesas Electronics Corp. - Overview
Renesas Electronics Corp. - Business segments
Renesas Electronics Corp. - Key news
Renesas Electronics Corp. - Key offerings
Renesas Electronics Corp. - Segment focus
SWOT

15.14 ROHM Co. Ltd.

ROHM Co. Ltd. - Overview
ROHM Co. Ltd. - Business segments
ROHM Co. Ltd. - Key news
ROHM Co. Ltd. - Key offerings
ROHM Co. Ltd. - Segment focus
SWOT

15.15 Silergy Corp.

Silergy Corp. - Overview
Silergy Corp. - Product / Service
Silergy Corp. - Key offerings
SWOT

15.16 STMicroelectronics NV

STMicroelectronics NV - Overview
STMicroelectronics NV - Business segments
STMicroelectronics NV - Key news
STMicroelectronics NV - Key offerings
STMicroelectronics NV - Segment focus
SWOT

15.17 Synaptics Inc.

Synaptics Inc. - Overview
Synaptics Inc. - Product / Service
Synaptics Inc. - Key offerings
SWOT

15.18 Texas Instruments Inc.

Texas Instruments Inc. - Overview
Texas Instruments Inc. - Business segments
Texas Instruments Inc. - Key news
Texas Instruments Inc. - Key offerings
Texas Instruments Inc. - Segment focus
SWOT

16. Appendix

16.1 Scope of the report

Market definition
Objectives
Notes and caveats

16.2 Inclusions and exclusions checklist

Inclusions checklist
Exclusions checklist

16.3 Currency conversion rates for US$

16.4 Research methodology

16.5 Data procurement

Information sources

16.6 Data validation

16.7 Validation techniques employed for market sizing

16.8 Data synthesis

16.9 360 degree market analysis

16.10 List of abbreviations

Research Methodology

Technavio presents a detailed picture of the market by way of study, synthesis, and summation of data from multiple sources. The analysts have presented the various facets of the market with a particular focus on identifying the key industry influencers. The data thus presented is comprehensive, reliable, and the result of extensive research, both primary and secondary.

INFORMATION SOURCES

Primary sources

  • Manufacturers and suppliers
  • Channel partners
  • Industry experts
  • Strategic decision makers

Secondary sources

  • Industry journals and periodicals
  • Government data
  • Financial reports of key industry players
  • Historical data
  • Press releases

DATA ANALYSIS

Data Synthesis

  • Collation of data
  • Estimation of key figures
  • Analysis of derived insights

Data Validation

  • Triangulation with data models
  • Reference against proprietary databases
  • Corroboration with industry experts

REPORT WRITING

Qualitative

  • Market drivers
  • Market challenges
  • Market trends
  • Five forces analysis

Quantitative

  • Market size and forecast
  • Market segmentation
  • Geographical insights
  • Competitive landscape

Interested in this report?

Get your sample now to see our research methodology and insights!

Download Now

Frequently Asked Questions

Audio Driver Ic market growth will increase by USD 6099.4 million during 2026-2030.

The Audio Driver Ic market is expected to grow at a CAGR of 18.7% during 2026-2030.

Audio Driver Ic market is segmented by Application (Consumer electronics, Telecommunication, Automotive) Type (Mono channel, 2-channel, 4-channel, 6-channel) End-user (OEM, Aftermarket)

Analog Devices Inc., Asahi Kasei Microdevices Corp., C Media Electronics Inc., Cirrus Logic Inc., Diodes Inc., ESS Technology Inc., Holtek Semiconductor Inc., Infineon Technologies AG, Microchip Technology Inc., Monolithic Power Systems Inc., Nuvoton Technology Corp., NXP Semiconductors NV, ON Semiconductor Corp., Realtek Semiconductor Corp., Renesas Electronics Corp., ROHM Co. Ltd., SG Micro Corp., Shanghai Awinic Technology Co Ltd, Shenzhen Goodix Technology Co., Silergy Corp., STMicroelectronics NV, Synaptics Inc., Texas Instruments Inc. are a few of the key vendors in the Audio Driver Ic market.

APAC will register the highest growth rate of 40.7% among the other regions. Therefore, the Audio Driver Ic market in APAC is expected to garner significant business opportunities for the vendors during the forecast period.

China, Japan, India, South Korea, Australia, Indonesia, US, Canada, Mexico, Germany, UK, France, Italy, Spain, The Netherlands, Brazil, Argentina, Chile, Saudi Arabia, UAE, South Africa, Israel, Turkey

  • Expansion of consumer electronics devices is the driving factor this market.

The Audio Driver Ic market vendors should focus on grabbing business opportunities from the Application segment as it accounted for the largest market share in the base year.
RIA - Research AI Assistant
Ask RIA
