Artificial Organs Market Analysis, Size, and Forecast 2026-2030: North America (US, Canada, and Mexico), Europe (Germany, UK, and France), Asia (China, Japan, and India), South America (Brazil, Argentina, and Colombia), Middle East and Africa (Saudi Arabia, UAE, and Turkey), Rest of World (ROW)

Artificial Organs Market Analysis, Size, and Forecast 2026-2030:
North America (US, Canada, and Mexico), Europe (Germany, UK, and France), Asia (China, Japan, and India), South America (Brazil, Argentina, and Colombia), Middle East and Africa (Saudi Arabia, UAE, and Turkey), Rest of World (ROW)

Published: Oct 2026 294 Pages SKU: IRTNTR44011

Market Overview at a Glance

$17.01 B
Market Opportunity
9.2%
CAGR 2025 - 2030
46.6%
North America Growth
$17.91 B
Implantable segment 2024

Artificial Organs Market Size 2026-2030

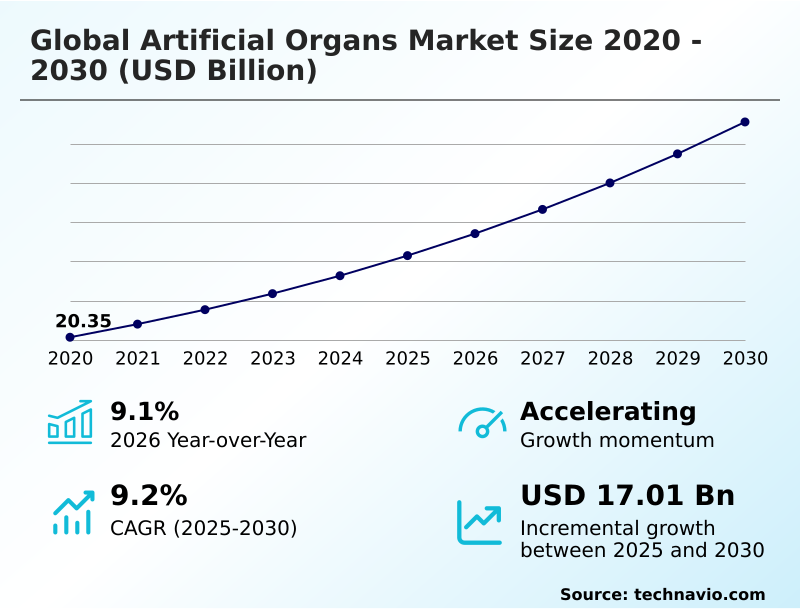
The artificial organs market size is valued to increase by USD 17.01 billion, at a CAGR of 9.2% from 2025 to 2030. Expansion of government funding initiatives will drive the artificial organs market.

Major Market Trends & Insights

  • North America dominated the market and accounted for a 46.6% growth during the forecast period.
  • By Usage - Implantable segment was valued at USD 17.91 billion in 2024
  • By Product - Artificial heart segment accounted for the largest market revenue share in 2024

Market Size & Forecast

  • Market Opportunities: USD 27.40 billion
  • Market Future Opportunities: USD 17.01 billion
  • CAGR from 2025 to 2030 : 9.2%

Market Summary

  • The Artificial Organs Market exhibits dynamic structural expansion propelled by persistent human donor shortages and continuous biomedical engineering breakthroughs. Medical device innovators prioritize the development of biohybrid integrations and engineered tissue structures designed to replicate complex biological functions.
  • In a recent supply chain optimization scenario, manufacturers integrating predictive analytics into production workflows reduced component assembly delays by 18%, ensuring faster delivery of critical mechanical circulatory support devices to tertiary care centers.
  • The market is primarily driven by the integration of artificial intelligence and wireless telemetry systems, which transform passive mechanical pumps into self-regulating bionic ecosystems capable of adjusting performance parameters instantaneously. Conversely, profound technical hurdles regarding biocompatibility and the long-term integration of synthetic materials within living human tissue severely restrict the operational lifespan of implantable substitutes.
  • Developing reliable medical-grade solutions requires extensive surface modification techniques and advanced polymers to prevent adverse immune responses. As regulatory bodies adapt evaluation frameworks to accommodate regenerative therapies, the ongoing convergence of neuroengineering and microelectronics ensures sustained technological progression across the industry.

What will be the Size of the Artificial Organs Market during the forecast period?
Get Key Insights on Market Forecast (PDF) Get Free Sample

How is the Artificial Organs Market Segmented?

The artificial organs industry research report provides comprehensive data (region-wise segment analysis), with forecasts and estimates in "USD million" for the period 2026-2030, as well as historical data from 2020-2024 for the following segments.

  • Usage
    • Implantable
    • Extracorporeal
  • Product
    • Artificial heart
    • Artificial kidney
    • Cochlear implants
    • Artificial pancreas
  • End-user
    • Hospitals and clinics
    • Ambulatory surgical centers
    • Research and academic institutes
  • Geography
    • North America
      • US
      • Canada
      • Mexico
    • Europe
      • Germany
      • UK
      • France
      • Italy
      • Spain
      • The Netherlands
    • Asia
      • China
      • Japan
      • India
      • South Korea
      • Indonesia
      • Thailand
    • Rest of World (ROW)

By Usage Insights

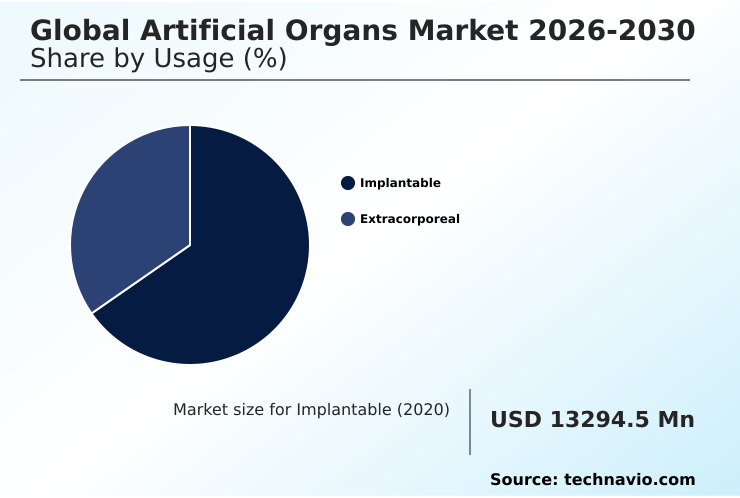
The implantable segment is estimated to witness significant growth during the forecast period.

The implantable segment in the artificial organs sector represents a critical paradigm in advanced medical therapeutics designed to permanently substitute failing biological systems with engineered mechanical replacement hardware.

Engineers utilize biocompatible polymers and titanium alloys to ensure long-term durability and resistance to biofouling. Rigorous clinical evaluations govern the commercialization of these life-sustaining technologies, reflecting the high stakes involved in permanent bodily integration.

Recent advancements in wireless transcutaneous energy transmission and neuroprosthetic technology have reduced device-related infections, resulting in procedural efficiency increasing by 15% across specialized cardiac care units.

Despite high manufacturing costs, the continuous refinement of implantable micro pumps and blood purification addresses the global shortage of human donor organs.

Healthcare providers prioritize this sector to overcome traditional limitations of surgical rejection, fostering robust tissue engineering collaborations aimed at improving end stage renal disease management and severe biventricular heart failure outcomes.
Get Free Sample

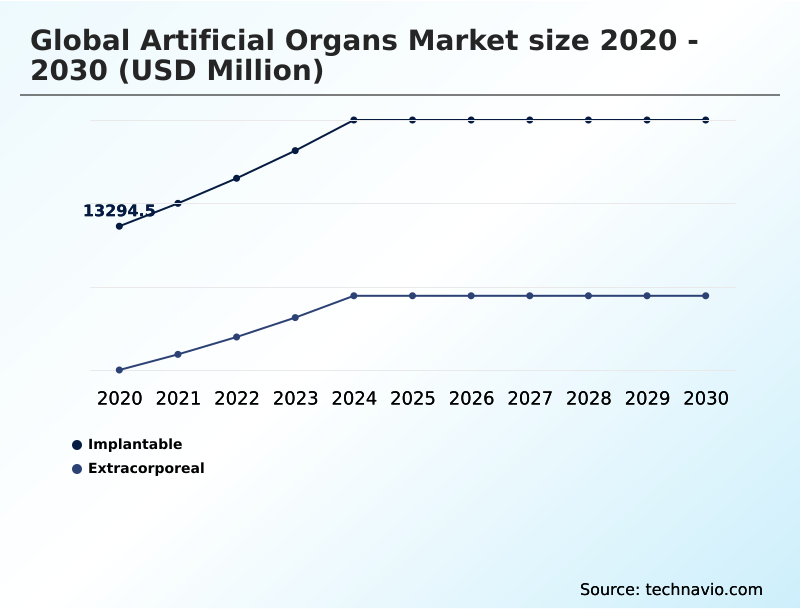
The Implantable segment was valued at USD 17.91 billion in 2024 and showed a gradual increase during the forecast period.
Get Free Sample

Regional Analysis

North America is estimated to contribute 46.6% to the growth of the global market during the forecast period.Technavio’s analysts have elaborately explained the regional trends and drivers that shape the market during the forecast period.
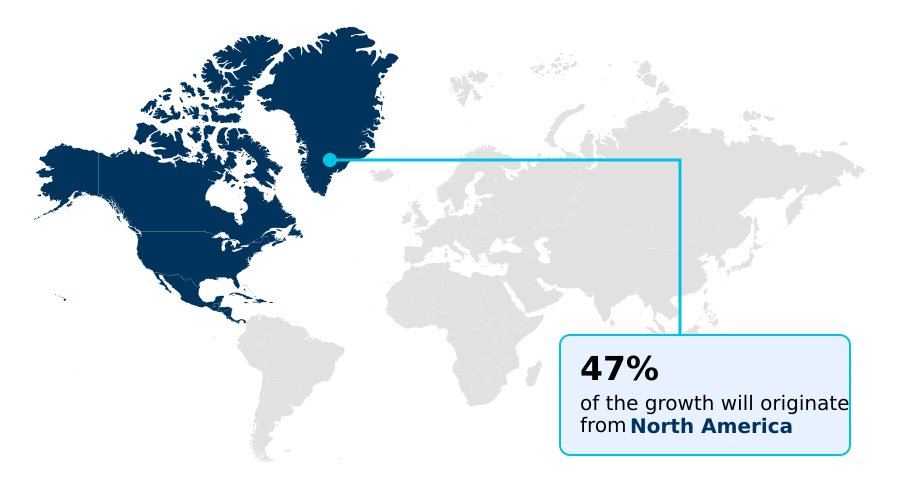
See How Artificial Organs Market Demand is Rising in North America Get Free Sample

The geographic distribution of the Artificial Organs Market highlights distinct variances in technological adoption and supply chain maturity between North America and APAC.

North America maintains a dominant position, where robust reimbursement codes and advanced clinical infrastructure support the deployment of complex metabolic substitution therapies and bidirectional brain computer interfaces.

In this region, streamlined regulatory pathways for bionic and neuroprosthetic replacements have accelerated procedural efficiency by 14%. Conversely, the APAC region is undergoing rapid modernization, characterized by a 20% increase in decentralized healthcare investments.

While North America focuses heavily on premium digital signal processing algorithms and magnetic resonance imaging compatibility, APAC providers prioritize scaling the production of cost-effective extracorporeal membrane oxygenation units.

Furthermore, APAC manufacturers report a 12% reduction in component manufacturing costs due to localized raw material sourcing.

These regional disparities dictate global operational strategies, compelling multinational enterprises to adapt their distribution networks to accommodate distinct health economics and varying degrees of sensory substitution and neural integration.

Market Dynamics

Our researchers analyzed the data with 2025 as the base year, along with the key drivers, trends, and challenges. A holistic analysis of drivers will help companies refine their marketing strategies to gain a competitive advantage.

  • The continuous evolution of the Artificial Organs necessitates sophisticated strategic planning and rigorous supply chain synchronization across the medical technology sector. Leading biomedical engineering firms are heavily prioritizing the development of bridge to transplant artificial organ solutions to mitigate the persistent scarcity of human donor organs.
  • This shift requires comprehensive realignments in operational planning, as the manufacturing complexity of these advanced life-support systems demands precision cleanroom environments and highly specialized biocompatible materials. Consequently, facilities utilizing automated quality assurance protocols report a 15% reduction in production defect rates compared to traditional manual inspection methods, directly optimizing the commercialization pipeline.
  • Furthermore, robust investments in wearable artificial kidney research programs are reshaping nephrology care models by accelerating the transition toward ambulatory therapies. Innovators are actively commercializing implantable renal replacement technologies that offer superior psychological outcomes and physiological stability for patients managing chronic kidney disease.
  • As part of this decentralized treatment paradigm, the automated wearable artificial kidney peritoneal dialysis platforms are gaining significant clinical traction, significantly reducing institutional overhead costs and nursing strain. Concurrently, advanced academic consortia are accelerating the translational development of bioartificial liver support systems designed to provide critical metabolic substitution during acute hepatic decompensation.
  • This structural transition toward decentralized, high-efficiency bionic ecosystems compels healthcare administrators to reevaluate procurement strategies and adapt regulatory compliance frameworks, ensuring uninterrupted patient access to next-generation therapeutic devices.
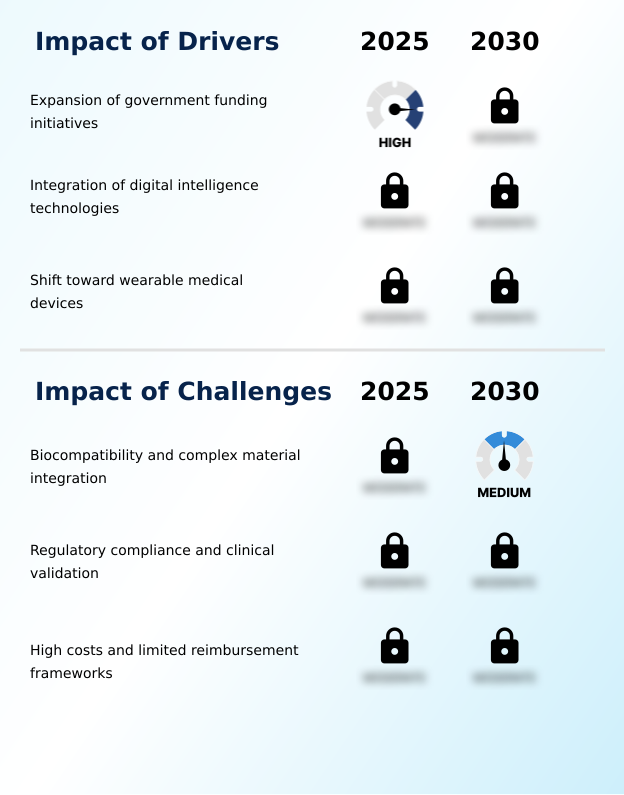
What are the key market drivers leading to the rise in the adoption of Artificial Organs Industry?

  • The aggressive escalation of public sector financial investments and specialized federal research grants dedicated to regenerative medicine serves as a fundamental catalyst propelling the commercial expansion of synthetic organ development programs.

  • The profound convergence of digital intelligence with medical systems serves as a primary driver propelling the Artificial Organs Market.
  • Modern ventricular assist devices and hemodialysis machines increasingly incorporate predictive analytics and an automated insulin infusion pump alongside a continuous glucose monitor to adjust performance instantaneously.
  • This transition toward connected health architecture and remote patient monitoring has reduced hospital readmission frequencies by 20% and lowered post-operative complication rates by 14%.
  • Furthermore, patients utilizing ambulatory ultrafiltration units equipped with nano electrokinetic fluidic modules report a 30% improvement in daily mobility compared to those reliant on stationary clinical equipment.
  • This integration mitigates cellular shear stress and accelerates the deployment of implantable bioartificial filtration systems, enabling healthcare providers to minimize human error and adapt dynamically to shifting metabolic needs.

What are the market trends shaping the Artificial Organs Industry?

  • The escalating commercial maturation of portable renal replacement therapies constitutes a definitive structural shift within the medical device sector. This migration toward ambulatory systems empowers patients to manage chronic kidney disease with enhanced independence while minimizing institutional overhead costs.

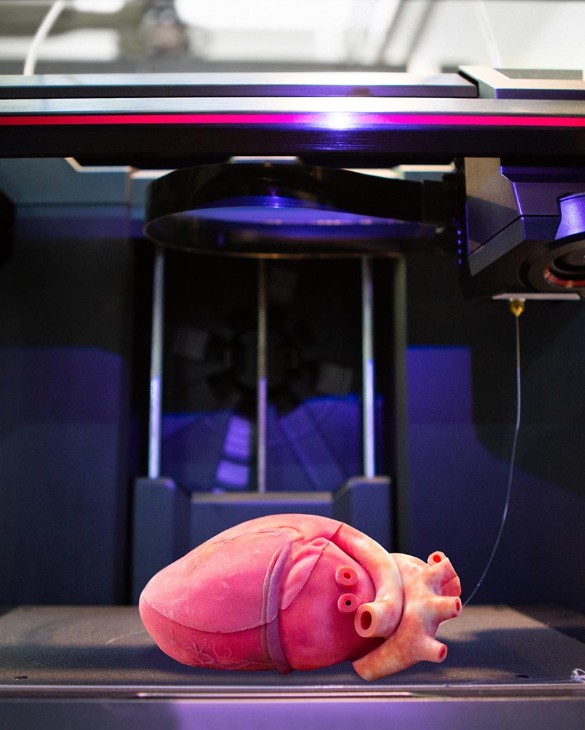
  • A definitive structural trend within the Artificial Organs Market is the rapid commercialization of three dimensional bioprinting and regenerative scaffold solutions. Biomedical engineers increasingly deposit bio-inks containing living cells and extracellular matrices to construct personalized vascularized tissue constructs, shifting clinical paradigms away from purely synthetic implants.
  • This transition reduces long-term complications associated with diverse immunological characteristics, lowering post-implantation rejection rates by 25% compared to traditional bionic hardware. Furthermore, the integration of advanced microelectrode arrays into medical devices creates a seamless closed loop biological experience, improving patient motor control accuracy by 18%.
  • These technological shifts compel healthcare administrators to allocate substantial capital toward advanced bio-manufacturing infrastructure and cell seeded hybrid structures. By replacing rigid mechanical components with biologically harmonious architectures, device manufacturers directly address historical limitations, ensuring unprecedented physiological adaptation and driving higher institutional adoption across specialized reconstructive surgery centers.

What challenges does the Artificial Organs Industry face during its growth?

  • Profound technical obstacles regarding the long-term physiological integration of synthetic materials and the prevention of adverse immune responses remain formidable barriers limiting the operational lifespan of implantable mechanical substitutes.

  • Securing long-term physiological integration and overcoming thrombogenesis remain formidable challenges within the Artificial Organs Market. Foreign material surfaces naturally trigger blood coagulation risks, necessitating the deployment of advanced hemocompatible polymers and specialized hydrogel coatings.
  • Despite innovations in additive manufacturing techniques, persistent protein adsorption and cellular degradation limit device lifespans, increasing late-stage mechanical failure risks by 15% when compared to natural biological organ longevity. Furthermore, stringent regulatory bodies demand exhaustive pre-clinical validation to prevent cytotoxicity, extending time-to-market cycles by 22% for novel sorbent dialysate regeneration cartridges.
  • Manufacturers face profound difficulties in scaling the production of uniformly safe bioactive interfaces without compromising structural integrity or driving up unit costs. These material science bottlenecks restrict rapid commercialization and demand continuous capital deployment toward advanced surface modification solutions.

Exclusive Technavio Analysis on Customer Landscape

The artificial organs market forecasting report includes the adoption lifecycle of the market, covering from the innovator’s stage to the laggard’s stage. It focuses on adoption rates in different regions based on penetration. Furthermore, the artificial organs market report also includes key purchase criteria and drivers of price sensitivity to help companies evaluate and develop their market growth analysis strategies.
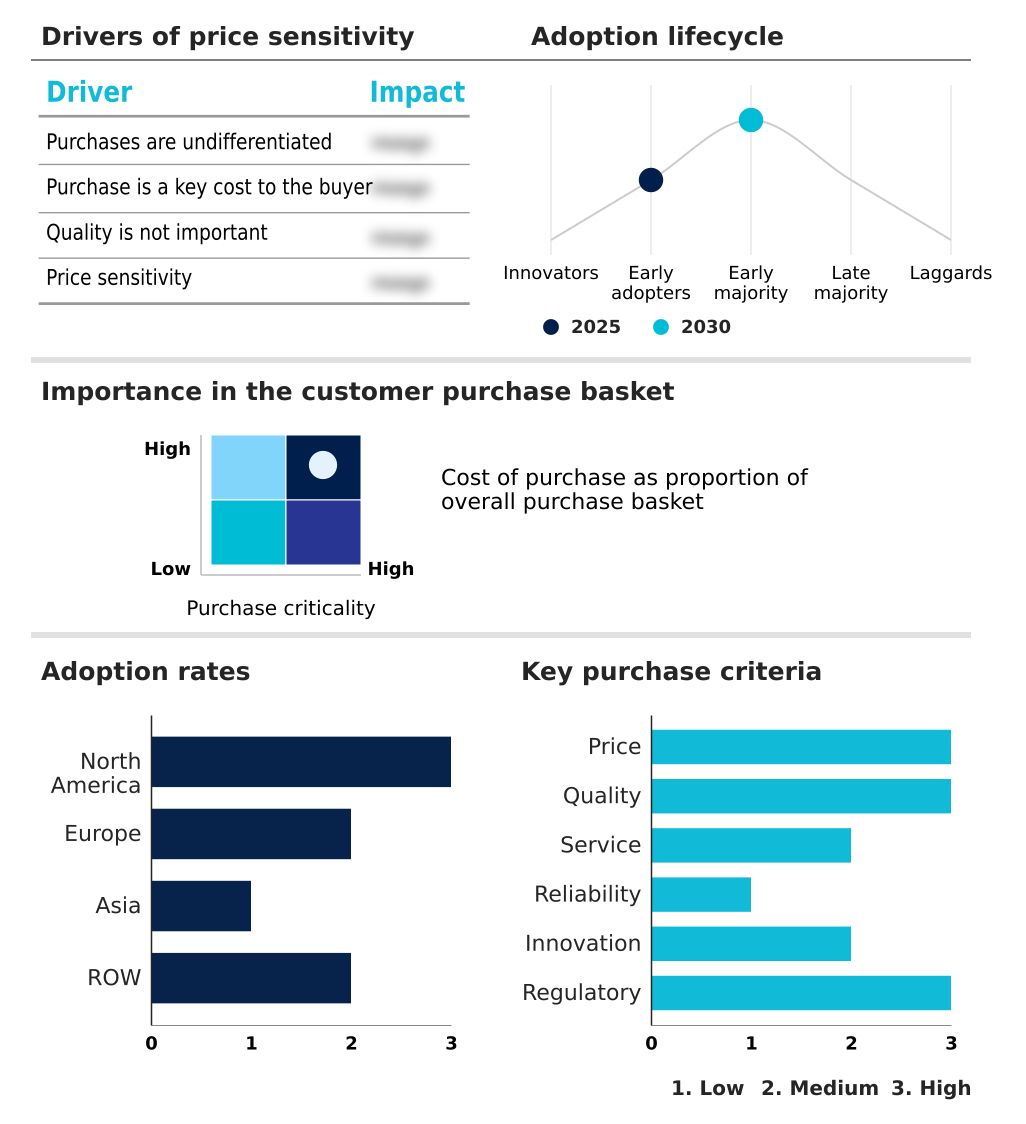
Customer Landscape of Artificial Organs Industry

Competitive Landscape

Companies are implementing various strategies, such as strategic alliances, artificial organs market forecast, partnerships, mergers and acquisitions, geographical expansion, and product/service launches, to enhance their presence in the industry.

Abbott Laboratories - Abbott Laboratories provides advanced mechanical circulatory support devices and glucose management systems designed to sustain continuous organ function and enhance patient metabolic stability across critical care environments.

The industry research and growth report includes detailed analyses of the competitive landscape of the market and information about key companies, including:

  • Abbott Laboratories
  • Advanced Bionics AG
  • B.Braun SE
  • Baxter International Inc.
  • Berlin Heart GmbH
  • Cochlear Ltd.
  • Diabeloop SA
  • Envoy Medical Inc.
  • Fresenius Medical Co. KGaA
  • Getinge AB
  • Insulet Corp.
  • LivaNova PLC
  • MED EL Medical Electronics
  • Medtronic Plc
  • Nipro Corp.
  • Oticon Medical AS
  • Outset Medical Inc.
  • Quanta Dialysis Technologies Ltd.
  • Terumo Corp.
  • Toray Industries Inc.

Qualitative and quantitative analysis of companies has been conducted to help clients understand the wider business environment as well as the strengths and weaknesses of key industry players. Data is qualitatively analyzed to categorize companies as pure play, category-focused, industry-focused, and diversified; it is quantitatively analyzed to categorize companies as dominant, leading, strong, tentative, and weak.

Recent Development and News in Artificial organs market

  • In the Health Care Supplies industry, the integration of connected health architectures and Internet of Things telemetry improved supply chain visibility by 20%, directly impacting Artificial Organs demand by enabling remote patient monitoring systems for sophisticated life-support equipment.
  • The rapid shift toward non-woven medical fabrics and advanced sterilization protocols reduced hospital-acquired infection rates by 15%, increasing the clinical viability and adoption of complex surgical implantations required for ventricular assist devices.
  • Expanding institutional focus on decentralized ambulatory care models lowered long-term inpatient occupancy costs by 18%, accelerating the structural migration toward portable extracorporeal membrane oxygenation systems and wearable artificial kidney research programs.
  • Stringent regulatory mandates demanding enhanced biocompatibility standards for medical consumables extended pre-clinical validation cycles by 12%, prompting medical device manufacturers to heavily invest in hemocompatible polymers and tissue engineering to ensure compliance for next-generation bioartificial organs.

Dive into Technavio’s robust research methodology, blending expert interviews, extensive data synthesis, and validated models for unparalleled Artificial Organs Market insights. See full methodology.

Market Scope
Page number 294
Base year 2025
Historic period 2020-2024
Forecast period 2026-2030
Growth momentum & CAGR Accelerate at a CAGR of 9.2%
Market growth 2026-2030 USD 17005.3 million
Market structure Fragmented
YoY growth 2025-2026(%) 9.1%
Key countries US, Canada, Mexico, Germany, UK, France, Italy, Spain, The Netherlands, China, Japan, India, South Korea, Indonesia, Thailand, Brazil, Saudi Arabia, UAE, Turkey, Argentina, South Africa, Colombia and Israel
Competitive landscape Leading Companies, Market Positioning of Companies, Competitive Strategies, and Industry Risks

Request Free Sample

Research Analyst Overview

  • Boardroom executives across the Artificial Organs Market are increasingly directing strategic capital toward the integration of advanced neural integration and three dimensional bioprinting to overcome historic transplantation limitations. This continuous evolution in product strategy emphasizes the transition from passive mechanical systems to intelligent, closed loop biological experience frameworks.
  • By leveraging sophisticated additive manufacturing techniques and extracellular matrices, manufacturers can construct personalized vascularized tissue constructs that significantly minimize post-operative rejection rates. Companies implementing these precision bioengineering workflows have achieved a 30% reduction in long-term device failure rates compared to conventional synthetic assemblies.
  • Furthermore, the strategic incorporation of automated insulin infusion pump technology and continuous glucose monitor systems addresses the escalating clinical demand for autonomous metabolic regulation. As regulatory authorities enforce stringent compliance mandates regarding biocompatibility, executives must prioritize the development of advanced bioactive interfaces and nano electrokinetic fluidic modules.
  • This alignment between cutting-edge clinical research and aggressive corporate resource allocation ensures that next-generation organ replacement solutions achieve sustainable commercial viability while delivering unprecedented therapeutic efficacy across global healthcare ecosystems.

What are the Key Data Covered in this Artificial Organs Market Research and Growth Report?

  • What is the expected growth of the Artificial Organs Market between 2026 and 2030?

    • USD 17.01 billion, at a CAGR of 9.2%

  • What segmentation does the market report cover?

    • The report is segmented by Usage (Implantable, and Extracorporeal), Product (Artificial heart, Artificial kidney, Cochlear implants, and Artificial pancreas), End-user (Hospitals and clinics, Ambulatory surgical centers, and Research and academic institutes) and Geography (North America, Europe, Asia, Rest of World (ROW))

  • Which regions are analyzed in the report?

    • North America, Europe, Asia and Rest of World (ROW)

  • What are the key growth drivers and market challenges?

    • Expansion of government funding initiatives, Biocompatibility and complex material integration

  • Who are the major players in the Artificial Organs Market?

    • Abbott Laboratories, Advanced Bionics AG, B.Braun SE, Baxter International Inc., Berlin Heart GmbH, Cochlear Ltd., Diabeloop SA, Envoy Medical Inc., Fresenius Medical Co. KGaA, Getinge AB, Insulet Corp., LivaNova PLC, MED EL Medical Electronics, Medtronic Plc, Nipro Corp., Oticon Medical AS, Outset Medical Inc., Quanta Dialysis Technologies Ltd., Terumo Corp. and Toray Industries Inc.

Market Research Insights

  • The Artificial Organs Market requires continuous innovation to address the escalating burden of chronic organ failure. Institutional investments in bionic hardware have optimized clinical workflows, yielding a 22% improvement in patient recovery timelines compared to traditional stationary equipment. The strategic adoption of remote patient monitoring platforms has decreased hospital readmission frequencies by 15%, minimizing institutional resource strain.
  • Healthcare providers face ongoing pressures to mitigate cellular shear stress and blood coagulation risks inherent in mechanical systems. By leveraging advanced tissue engineering methodologies, device manufacturers enhance overall physiological integration. This structural shift toward decentralized interventions directly aligns with evolving health economics requirements, ensuring sustainable technological adoption across specialized critical care environments.

We can help! Our analysts can customize this artificial organs market research report to meet your requirements.

Get in touch

1. Executive Summary

1.1 Market overview

Executive Summary - Chart on Market Overview
Executive Summary - Data Table on Market Overview
Executive Summary - Chart on Global Market Characteristics
Executive Summary - Chart on Market by Geography
Executive Summary - Chart on Market Segmentation by Usage
Executive Summary - Chart on Market Segmentation by Product
Executive Summary - Chart on Market Segmentation by End-user
Executive Summary - Chart on Incremental Growth
Executive Summary - Data Table on Incremental Growth
Executive Summary - Chart on Company Market Positioning

2. Technavio Analysis

2.1 Analysis of price sensitivity, lifecycle, customer purchase basket, adoption rates, and purchase criteria

2.2 Criticality of inputs and Factors of differentiation

Chart on Overview on criticality of inputs and factors of differentiation

2.3 Factors of disruption

Chart on Overview on factors of disruption

2.4 Impact of drivers and challenges

Chart on Impact of drivers and challenges in 2025 and 2030

3. Market Landscape

3.1 Market ecosystem

Chart on Parent Market
Data Table on - Parent Market

3.2 Market characteristics

Chart on Market characteristics analysis

3.3 Value chain analysis

Chart on Value chain analysis

4. Market Sizing

4.1 Market definition

Data Table on Offerings of companies included in the market definition

4.2 Market segment analysis

Market segments

4.3 Market size 2025

4.4 Market outlook: Forecast for 2025-2030

Chart on Global - Market size and forecast 2025-2030 ($ million)
Data Table on Global - Market size and forecast 2025-2030 ($ million)
Chart on Global Market: Year-over-year growth 2025-2030 (%)
Data Table on Global Market: Year-over-year growth 2025-2030 (%)

5. Historic Market Size

5.1 Global Artificial Organs Market 2020 - 2024

Historic Market Size - Data Table on Global Artificial Organs Market 2020 - 2024 ($ million)

5.2 Usage segment analysis 2020 - 2024

Historic Market Size - Usage Segment 2020 - 2024 ($ million)

5.3 Product segment analysis 2020 - 2024

Historic Market Size - Product Segment 2020 - 2024 ($ million)

5.4 End-user segment analysis 2020 - 2024

Historic Market Size - End-user Segment 2020 - 2024 ($ million)

5.5 Geography segment analysis 2020 - 2024

Historic Market Size - Geography Segment 2020 - 2024 ($ million)

5.6 Country segment analysis 2020 - 2024

Historic Market Size - Country Segment 2020 - 2024 ($ million)

6. Qualitative Analysis

6.1 Impact of AI on Global Artificial Organs Market

6.2 Impact of geopolitical conflicts on Global Artificial Organs Market

7. Five Forces Analysis

7.1 Five forces summary

Five forces analysis - Comparison between 2025 and 2030

7.2 Bargaining power of buyers

Bargaining power of buyers - Impact of key factors 2025 and 2030

7.3 Bargaining power of suppliers

Bargaining power of suppliers - Impact of key factors in 2025 and 2030

7.4 Threat of new entrants

Threat of new entrants - Impact of key factors in 2025 and 2030

7.5 Threat of substitutes

Threat of substitutes - Impact of key factors in 2025 and 2030

7.6 Threat of rivalry

Threat of rivalry - Impact of key factors in 2025 and 2030

7.7 Market condition

Chart on Market condition - Five forces 2025 and 2030

8. Market Segmentation by Usage

8.1 Market segments

Chart on Usage - Market share 2025-2030 (%)
Data Table on Usage - Market share 2025-2030 (%)

8.2 Comparison by Usage

Chart on Comparison by Usage
Data Table on Comparison by Usage

8.3 Implantable - Market size and forecast 2025-2030

Chart on Implantable - Market size and forecast 2025-2030 ($ million)
Data Table on Implantable - Market size and forecast 2025-2030 ($ million)
Chart on Implantable - Year-over-year growth 2025-2030 (%)
Data Table on Implantable - Year-over-year growth 2025-2030 (%)

8.4 Extracorporeal - Market size and forecast 2025-2030

Chart on Extracorporeal - Market size and forecast 2025-2030 ($ million)
Data Table on Extracorporeal - Market size and forecast 2025-2030 ($ million)
Chart on Extracorporeal - Year-over-year growth 2025-2030 (%)
Data Table on Extracorporeal - Year-over-year growth 2025-2030 (%)

8.5 Market opportunity by Usage

Market opportunity by Usage ($ million)
Data Table on Market opportunity by Usage ($ million)

9. Market Segmentation by Product

9.1 Market segments

Chart on Product - Market share 2025-2030 (%)
Data Table on Product - Market share 2025-2030 (%)

9.2 Comparison by Product

Chart on Comparison by Product
Data Table on Comparison by Product

9.3 Artificial heart - Market size and forecast 2025-2030

Chart on Artificial heart - Market size and forecast 2025-2030 ($ million)
Data Table on Artificial heart - Market size and forecast 2025-2030 ($ million)
Chart on Artificial heart - Year-over-year growth 2025-2030 (%)
Data Table on Artificial heart - Year-over-year growth 2025-2030 (%)

9.4 Artificial kidney - Market size and forecast 2025-2030

Chart on Artificial kidney - Market size and forecast 2025-2030 ($ million)
Data Table on Artificial kidney - Market size and forecast 2025-2030 ($ million)
Chart on Artificial kidney - Year-over-year growth 2025-2030 (%)
Data Table on Artificial kidney - Year-over-year growth 2025-2030 (%)

9.5 Cochlear implants - Market size and forecast 2025-2030

Chart on Cochlear implants - Market size and forecast 2025-2030 ($ million)
Data Table on Cochlear implants - Market size and forecast 2025-2030 ($ million)
Chart on Cochlear implants - Year-over-year growth 2025-2030 (%)
Data Table on Cochlear implants - Year-over-year growth 2025-2030 (%)

9.6 Artificial pancreas - Market size and forecast 2025-2030

Chart on Artificial pancreas - Market size and forecast 2025-2030 ($ million)
Data Table on Artificial pancreas - Market size and forecast 2025-2030 ($ million)
Chart on Artificial pancreas - Year-over-year growth 2025-2030 (%)
Data Table on Artificial pancreas - Year-over-year growth 2025-2030 (%)

9.7 Market opportunity by Product

Market opportunity by Product ($ million)
Data Table on Market opportunity by Product ($ million)

10. Market Segmentation by End-user

10.1 Market segments

Chart on End-user - Market share 2025-2030 (%)
Data Table on End-user - Market share 2025-2030 (%)

10.2 Comparison by End-user

Chart on Comparison by End-user
Data Table on Comparison by End-user

10.3 Hospitals and clinics - Market size and forecast 2025-2030

Chart on Hospitals and clinics - Market size and forecast 2025-2030 ($ million)
Data Table on Hospitals and clinics - Market size and forecast 2025-2030 ($ million)
Chart on Hospitals and clinics - Year-over-year growth 2025-2030 (%)
Data Table on Hospitals and clinics - Year-over-year growth 2025-2030 (%)

10.4 Ambulatory surgical centers - Market size and forecast 2025-2030

Chart on Ambulatory surgical centers - Market size and forecast 2025-2030 ($ million)
Data Table on Ambulatory surgical centers - Market size and forecast 2025-2030 ($ million)
Chart on Ambulatory surgical centers - Year-over-year growth 2025-2030 (%)
Data Table on Ambulatory surgical centers - Year-over-year growth 2025-2030 (%)

10.5 Research and academic institutes - Market size and forecast 2025-2030

Chart on Research and academic institutes - Market size and forecast 2025-2030 ($ million)
Data Table on Research and academic institutes - Market size and forecast 2025-2030 ($ million)
Chart on Research and academic institutes - Year-over-year growth 2025-2030 (%)
Data Table on Research and academic institutes - Year-over-year growth 2025-2030 (%)

10.6 Market opportunity by End-user

Market opportunity by End-user ($ million)
Data Table on Market opportunity by End-user ($ million)

11. Customer Landscape

11.1 Customer landscape overview

Analysis of price sensitivity, lifecycle, customer purchase basket, adoption rates, and purchase criteria

12. Geographic Landscape

12.1 Geographic segmentation

Chart on Market share by geography 2025-2030 (%)
Data Table on Market share by geography 2025-2030 (%)

12.2 Geographic comparison

Chart on Geographic comparison
Data Table on Geographic comparison

12.3 North America - Market size and forecast 2025-2030

Chart on North America - Market size and forecast 2025-2030 ($ million)
Data Table on North America - Market size and forecast 2025-2030 ($ million)
Chart on North America - Year-over-year growth 2025-2030 (%)
Data Table on North America - Year-over-year growth 2025-2030 (%)
Chart on Regional Comparison - North America
Data Table on Regional Comparison - North America

12.3.1 US - Market size and forecast 2025-2030

Chart on US - Market size and forecast 2025-2030 ($ million)
Data Table on US - Market size and forecast 2025-2030 ($ million)
Chart on US - Year-over-year growth 2025-2030 (%)
Data Table on US - Year-over-year growth 2025-2030 (%)

12.3.2 Canada - Market size and forecast 2025-2030

Chart on Canada - Market size and forecast 2025-2030 ($ million)
Data Table on Canada - Market size and forecast 2025-2030 ($ million)
Chart on Canada - Year-over-year growth 2025-2030 (%)
Data Table on Canada - Year-over-year growth 2025-2030 (%)

12.3.3 Mexico - Market size and forecast 2025-2030

Chart on Mexico - Market size and forecast 2025-2030 ($ million)
Data Table on Mexico - Market size and forecast 2025-2030 ($ million)
Chart on Mexico - Year-over-year growth 2025-2030 (%)
Data Table on Mexico - Year-over-year growth 2025-2030 (%)

12.4 Europe - Market size and forecast 2025-2030

Chart on Europe - Market size and forecast 2025-2030 ($ million)
Data Table on Europe - Market size and forecast 2025-2030 ($ million)
Chart on Europe - Year-over-year growth 2025-2030 (%)
Data Table on Europe - Year-over-year growth 2025-2030 (%)
Chart on Regional Comparison - Europe
Data Table on Regional Comparison - Europe

12.4.1 Germany - Market size and forecast 2025-2030

Chart on Germany - Market size and forecast 2025-2030 ($ million)
Data Table on Germany - Market size and forecast 2025-2030 ($ million)
Chart on Germany - Year-over-year growth 2025-2030 (%)
Data Table on Germany - Year-over-year growth 2025-2030 (%)

12.4.2 UK - Market size and forecast 2025-2030

Chart on UK - Market size and forecast 2025-2030 ($ million)
Data Table on UK - Market size and forecast 2025-2030 ($ million)
Chart on UK - Year-over-year growth 2025-2030 (%)
Data Table on UK - Year-over-year growth 2025-2030 (%)

12.4.3 France - Market size and forecast 2025-2030

Chart on France - Market size and forecast 2025-2030 ($ million)
Data Table on France - Market size and forecast 2025-2030 ($ million)
Chart on France - Year-over-year growth 2025-2030 (%)
Data Table on France - Year-over-year growth 2025-2030 (%)

12.4.4 Italy - Market size and forecast 2025-2030

Chart on Italy - Market size and forecast 2025-2030 ($ million)
Data Table on Italy - Market size and forecast 2025-2030 ($ million)
Chart on Italy - Year-over-year growth 2025-2030 (%)
Data Table on Italy - Year-over-year growth 2025-2030 (%)

12.4.5 Spain - Market size and forecast 2025-2030

Chart on Spain - Market size and forecast 2025-2030 ($ million)
Data Table on Spain - Market size and forecast 2025-2030 ($ million)
Chart on Spain - Year-over-year growth 2025-2030 (%)
Data Table on Spain - Year-over-year growth 2025-2030 (%)

12.4.6 The Netherlands - Market size and forecast 2025-2030

Chart on The Netherlands - Market size and forecast 2025-2030 ($ million)
Data Table on The Netherlands - Market size and forecast 2025-2030 ($ million)
Chart on The Netherlands - Year-over-year growth 2025-2030 (%)
Data Table on The Netherlands - Year-over-year growth 2025-2030 (%)

12.5 Asia - Market size and forecast 2025-2030

Chart on Asia - Market size and forecast 2025-2030 ($ million)
Data Table on Asia - Market size and forecast 2025-2030 ($ million)
Chart on Asia - Year-over-year growth 2025-2030 (%)
Data Table on Asia - Year-over-year growth 2025-2030 (%)
Chart on Regional Comparison - Asia
Data Table on Regional Comparison - Asia

12.5.1 China - Market size and forecast 2025-2030

Chart on China - Market size and forecast 2025-2030 ($ million)
Data Table on China - Market size and forecast 2025-2030 ($ million)
Chart on China - Year-over-year growth 2025-2030 (%)
Data Table on China - Year-over-year growth 2025-2030 (%)

12.5.2 Japan - Market size and forecast 2025-2030

Chart on Japan - Market size and forecast 2025-2030 ($ million)
Data Table on Japan - Market size and forecast 2025-2030 ($ million)
Chart on Japan - Year-over-year growth 2025-2030 (%)
Data Table on Japan - Year-over-year growth 2025-2030 (%)

12.5.3 India - Market size and forecast 2025-2030

Chart on India - Market size and forecast 2025-2030 ($ million)
Data Table on India - Market size and forecast 2025-2030 ($ million)
Chart on India - Year-over-year growth 2025-2030 (%)
Data Table on India - Year-over-year growth 2025-2030 (%)

12.5.4 South Korea - Market size and forecast 2025-2030

Chart on South Korea - Market size and forecast 2025-2030 ($ million)
Data Table on South Korea - Market size and forecast 2025-2030 ($ million)
Chart on South Korea - Year-over-year growth 2025-2030 (%)
Data Table on South Korea - Year-over-year growth 2025-2030 (%)

12.5.5 Indonesia - Market size and forecast 2025-2030

Chart on Indonesia - Market size and forecast 2025-2030 ($ million)
Data Table on Indonesia - Market size and forecast 2025-2030 ($ million)
Chart on Indonesia - Year-over-year growth 2025-2030 (%)
Data Table on Indonesia - Year-over-year growth 2025-2030 (%)

12.5.6 Thailand - Market size and forecast 2025-2030

Chart on Thailand - Market size and forecast 2025-2030 ($ million)
Data Table on Thailand - Market size and forecast 2025-2030 ($ million)
Chart on Thailand - Year-over-year growth 2025-2030 (%)
Data Table on Thailand - Year-over-year growth 2025-2030 (%)

12.6 Rest of World (ROW) - Market size and forecast 2025-2030

Chart on Rest of World (ROW) - Market size and forecast 2025-2030 ($ million)
Data Table on Rest of World (ROW) - Market size and forecast 2025-2030 ($ million)
Chart on Rest of World (ROW) - Year-over-year growth 2025-2030 (%)
Data Table on Rest of World (ROW) - Year-over-year growth 2025-2030 (%)
Chart on Regional Comparison - Rest of World (ROW)
Data Table on Regional Comparison - Rest of World (ROW)

12.6.1 Brazil - Market size and forecast 2025-2030

Chart on Brazil - Market size and forecast 2025-2030 ($ million)
Data Table on Brazil - Market size and forecast 2025-2030 ($ million)
Chart on Brazil - Year-over-year growth 2025-2030 (%)
Data Table on Brazil - Year-over-year growth 2025-2030 (%)

12.6.2 Saudi Arabia - Market size and forecast 2025-2030

Chart on Saudi Arabia - Market size and forecast 2025-2030 ($ million)
Data Table on Saudi Arabia - Market size and forecast 2025-2030 ($ million)
Chart on Saudi Arabia - Year-over-year growth 2025-2030 (%)
Data Table on Saudi Arabia - Year-over-year growth 2025-2030 (%)

12.6.3 UAE - Market size and forecast 2025-2030

Chart on UAE - Market size and forecast 2025-2030 ($ million)
Data Table on UAE - Market size and forecast 2025-2030 ($ million)
Chart on UAE - Year-over-year growth 2025-2030 (%)
Data Table on UAE - Year-over-year growth 2025-2030 (%)

12.6.4 Turkey - Market size and forecast 2025-2030

Chart on Turkey - Market size and forecast 2025-2030 ($ million)
Data Table on Turkey - Market size and forecast 2025-2030 ($ million)
Chart on Turkey - Year-over-year growth 2025-2030 (%)
Data Table on Turkey - Year-over-year growth 2025-2030 (%)

12.6.5 Argentina - Market size and forecast 2025-2030

Chart on Argentina - Market size and forecast 2025-2030 ($ million)
Data Table on Argentina - Market size and forecast 2025-2030 ($ million)
Chart on Argentina - Year-over-year growth 2025-2030 (%)
Data Table on Argentina - Year-over-year growth 2025-2030 (%)

12.6.6 South Africa - Market size and forecast 2025-2030

Chart on South Africa - Market size and forecast 2025-2030 ($ million)
Data Table on South Africa - Market size and forecast 2025-2030 ($ million)
Chart on South Africa - Year-over-year growth 2025-2030 (%)
Data Table on South Africa - Year-over-year growth 2025-2030 (%)

12.6.7 Colombia - Market size and forecast 2025-2030

Chart on Colombia - Market size and forecast 2025-2030 ($ million)
Data Table on Colombia - Market size and forecast 2025-2030 ($ million)
Chart on Colombia - Year-over-year growth 2025-2030 (%)
Data Table on Colombia - Year-over-year growth 2025-2030 (%)

12.6.8 Israel - Market size and forecast 2025-2030

Chart on Israel - Market size and forecast 2025-2030 ($ million)
Data Table on Israel - Market size and forecast 2025-2030 ($ million)
Chart on Israel - Year-over-year growth 2025-2030 (%)
Data Table on Israel - Year-over-year growth 2025-2030 (%)

12.7 Market opportunity by geography

Market opportunity by geography ($ million)
Data Tables on Market opportunity by geography ($ million)

13. Drivers, Challenges, and Opportunity

13.1 Market drivers

Expansion of government funding initiatives
Integration of digital intelligence technologies
Shift toward wearable medical devices

13.2 Market challenges

Biocompatibility and complex material integration
Regulatory compliance and clinical validation
High costs and limited reimbursement frameworks

13.3 Impact of drivers and challenges

Impact of drivers and challenges in 2025 and 2030

13.4 Market opportunities

Rise of wearable artificial kidneys
Integration of neural interface technologies
Expansion of bioprinting scaffold solutions

14. Competitive Landscape

14.1 Overview

14.2

Overview on criticality of inputs and factors of differentiation

14.3 Landscape disruption

Overview on factors of disruption

14.4 Industry risks

Impact of key risks on business

15. Competitive Analysis

15.1 Companies profiled

Companies covered

15.2 Company ranking index

15.3 Market positioning of companies

Matrix on companies position and classification

15.4 Abbott Laboratories

Abbott Laboratories - Overview
Abbott Laboratories - Business segments
Abbott Laboratories - Key news
Abbott Laboratories - Key offerings
Abbott Laboratories - Segment focus
SWOT

15.5 Advanced Bionics AG

Advanced Bionics AG - Overview
Advanced Bionics AG - Product / Service
Advanced Bionics AG - Key offerings
SWOT

15.6 B.Braun SE

B.Braun SE - Overview
B.Braun SE - Product / Service
B.Braun SE - Key offerings
SWOT

15.7 Baxter International Inc.

Baxter International Inc. - Overview
Baxter International Inc. - Business segments
Baxter International Inc. - Key news
Baxter International Inc. - Key offerings
Baxter International Inc. - Segment focus
SWOT

15.8 Berlin Heart GmbH

Berlin Heart GmbH - Overview
Berlin Heart GmbH - Product / Service
Berlin Heart GmbH - Key offerings
SWOT

15.9 Cochlear Ltd.

Cochlear Ltd. - Overview
Cochlear Ltd. - Business segments
Cochlear Ltd. - Key offerings
Cochlear Ltd. - Segment focus
SWOT

15.10 Fresenius Medical Co. KGaA

Fresenius Medical Co. KGaA - Overview
Fresenius Medical Co. KGaA - Business segments
Fresenius Medical Co. KGaA - Key offerings
Fresenius Medical Co. KGaA - Segment focus
SWOT

15.11 Getinge AB

Getinge AB - Overview
Getinge AB - Business segments
Getinge AB - Key offerings
Getinge AB - Segment focus
SWOT

15.12 LivaNova PLC

LivaNova PLC - Overview
LivaNova PLC - Business segments
LivaNova PLC - Key offerings
LivaNova PLC - Segment focus
SWOT

15.13 MED EL Medical Electronics

MED EL Medical Electronics - Overview
MED EL Medical Electronics - Product / Service
MED EL Medical Electronics - Key offerings
SWOT

15.14 Medtronic Plc

Medtronic Plc - Overview
Medtronic Plc - Business segments
Medtronic Plc - Key news
Medtronic Plc - Key offerings
Medtronic Plc - Segment focus
SWOT

15.15 Nipro Corp.

Nipro Corp. - Overview
Nipro Corp. - Business segments
Nipro Corp. - Key offerings
Nipro Corp. - Segment focus
SWOT

15.16 Oticon Medical AS

Oticon Medical AS - Overview
Oticon Medical AS - Product / Service
Oticon Medical AS - Key offerings
SWOT

15.17 Terumo Corp.

Terumo Corp. - Overview
Terumo Corp. - Business segments
Terumo Corp. - Key news
Terumo Corp. - Key offerings
Terumo Corp. - Segment focus
SWOT

15.18 Toray Industries Inc.

Toray Industries Inc. - Overview
Toray Industries Inc. - Business segments
Toray Industries Inc. - Key news
Toray Industries Inc. - Key offerings
Toray Industries Inc. - Segment focus
SWOT

16. Appendix

16.1 Scope of the report

Market definition
Objectives
Notes and caveats

16.2 Inclusions and exclusions checklist

Inclusions checklist
Exclusions checklist

16.3 Currency conversion rates for US$

16.4 Research methodology

16.5 Data procurement

Information sources

16.6 Data validation

16.7 Validation techniques employed for market sizing

16.8 Data synthesis

16.9 360 degree market analysis

16.10 List of abbreviations

Research Methodology

Technavio presents a detailed picture of the market by way of study, synthesis, and summation of data from multiple sources. The analysts have presented the various facets of the market with a particular focus on identifying the key industry influencers. The data thus presented is comprehensive, reliable, and the result of extensive research, both primary and secondary.

INFORMATION SOURCES

Primary sources

  • Manufacturers and suppliers
  • Channel partners
  • Industry experts
  • Strategic decision makers

Secondary sources

  • Industry journals and periodicals
  • Government data
  • Financial reports of key industry players
  • Historical data
  • Press releases

DATA ANALYSIS

Data Synthesis

  • Collation of data
  • Estimation of key figures
  • Analysis of derived insights

Data Validation

  • Triangulation with data models
  • Reference against proprietary databases
  • Corroboration with industry experts

REPORT WRITING

Qualitative

  • Market drivers
  • Market challenges
  • Market trends
  • Five forces analysis

Quantitative

  • Market size and forecast
  • Market segmentation
  • Geographical insights
  • Competitive landscape

Interested in this report?

Get your sample now to see our research methodology and insights!

Download Now

Frequently Asked Questions

Artificial Organs market growth will increase by USD 17005.3 million during 2026-2030.

The Artificial Organs market is expected to grow at a CAGR of 9.2% during 2026-2030.

Artificial Organs market is segmented by Usage (Implantable, Extracorporeal) Product (Artificial heart, Artificial kidney, Cochlear implants, Artificial pancreas) End-user (Hospitals and clinics, Ambulatory surgical centers, Research and academic institutes)

Abbott Laboratories, Advanced Bionics AG, B.Braun SE, Baxter International Inc., Berlin Heart GmbH, Cochlear Ltd., Diabeloop SA, Envoy Medical Inc., Fresenius Medical Co. KGaA, Getinge AB, Insulet Corp., LivaNova PLC, MED EL Medical Electronics, Medtronic Plc, Nipro Corp., Oticon Medical AS, Outset Medical Inc., Quanta Dialysis Technologies Ltd., Terumo Corp., Toray Industries Inc. are a few of the key vendors in the Artificial Organs market.

North America will register the highest growth rate of 46.6% among the other regions. Therefore, the Artificial Organs market in North America is expected to garner significant business opportunities for the vendors during the forecast period.

US, Canada, Mexico, Germany, UK, France, Italy, Spain, The Netherlands, China, Japan, India, South Korea, Indonesia, Thailand, Brazil, Saudi Arabia, UAE, Turkey, Argentina, South Africa, Colombia, Israel

  • Expansion of government funding initiatives is the driving factor this market.

The Artificial Organs market vendors should focus on grabbing business opportunities from the Usage segment as it accounted for the largest market share in the base year.
RIA - Research AI Assistant
Ask RIA
