Amino Acid Market Analysis, Size, and Forecast 2026-2030: APAC (China, Japan, and India), Europe (Germany, France, and UK), North America (US, Canada, and Mexico), South America (Brazil, Argentina, and Chile), Middle East and Africa (South Africa, Saudi Arabia, and UAE), and Rest of World (ROW)

Amino Acid Market Analysis, Size, and Forecast 2026-2030:
APAC (China, Japan, and India), Europe (Germany, France, and UK), North America (US, Canada, and Mexico), South America (Brazil, Argentina, and Chile), Middle East and Africa (South Africa, Saudi Arabia, and UAE), and Rest of World (ROW)

Published: Oct 2026 299 Pages SKU: IRTNTR40821

Market Overview at a Glance

$15.14 B
Market Opportunity
8.1%
CAGR 2025 - 2030
46.8%
APAC Growth
$13.87 B
Animal feed segment 2024

Amino Acid Market Size 2026-2030

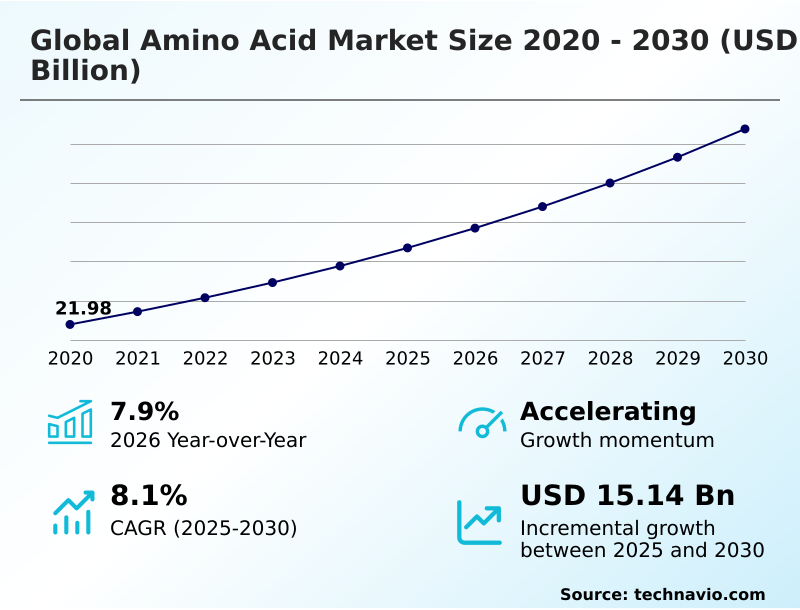
The amino acid market size is valued to increase by USD 15.14 billion, at a CAGR of 8.1% from 2025 to 2030. Expanding global animal protein consumption drives feed efficiency solutions demand will drive the amino acid market.

Major Market Trends & Insights

  • APAC dominated the market and accounted for a 46.8% growth during the forecast period.
  • By Application - Animal feed segment was valued at USD 13.87 billion in 2024
  • By Type - Plant based segment accounted for the largest market revenue share in 2024

Market Size & Forecast

  • Market Opportunities: USD 24.88 billion
  • Market Future Opportunities: USD 15.14 billion
  • CAGR from 2025 to 2030 : 8.1%

Market Summary

  • The Amino Acid Market is experiencing rapid structural transformation driven by the escalating need for precise nutritional inputs and sustainable agricultural frameworks. As livestock producers face intense pressure to optimize output, enhanced feed efficiency has become a critical operational priority.
  • By integrating high-purity crystalline additives into animal diets, feed mills achieve remarkable results; for instance, dietary protein efficiency improved by 15% compared to traditional meal formulations, leading to significantly lower input costs. This demand for high-performance efficiency solutions acts as a primary market driver, compelling manufacturers to scale up processing capacities.
  • However, the industry encounters notable constraints due to fluctuating chemical and raw material prices. Volatility in agricultural commodity costs creates substantial economic uncertainty for raw material procurement, severely squeezing producer margins. To mitigate these risks, ingredient suppliers are actively deploying continuous optimization and vertical integration strategies.
  • Ultimately, advanced biological processing frameworks allow enterprises to balance high-volume commercial production with stringent environmental compliance mandates, ensuring stable Amino Acid supply chains.

What will be the Size of the Amino Acid Market during the forecast period?
Get Key Insights on Market Forecast (PDF) Get Free Sample

How is the Amino Acid Market Segmented?

The amino acid industry research report provides comprehensive data (region-wise segment analysis), with forecasts and estimates in "USD million" for the period 2026-2030, as well as historical data from 2020-2024 for the following segments.

  • Application
    • Animal feed
    • Pharmaceuticals
    • Food and beverages
  • Type
    • Plant based
    • Animal based
  • Product
    • Non-essential
    • Essential
  • Geography
    • APAC
      • China
      • Japan
      • India
      • South Korea
      • Indonesia
      • Australia
    • Europe
      • Germany
      • France
      • UK
      • Italy
      • Spain
      • The Netherlands
    • North America
      • US
      • Canada
      • Mexico
    • South America
      • Brazil
      • Argentina
      • Chile
    • Middle East and Africa
      • South Africa
      • Saudi Arabia
      • UAE
      • Egypt
      • Turkey

By Application Insights

The animal feed segment is estimated to witness significant growth during the forecast period.

The animal feed sector represents a critical application domain driven by precision animal nutrition strategies and protein fortification requirements. To optimize feed conversion efficiency, livestock producers integrate essential dietary additives that reduce reliance on traditional high-protein feedstuffs.

Implementing targeted approaches ensures optimal nitrogen retention and cellular synthesis within livestock. This methodology yields significant operational advantages; farming operations report that feed conversion efficiency improved by 15%, substantially lowering overall dietary costs.

Furthermore, precision feeding techniques facilitate a 20% decrease in environmental waste, aligning with global carbon emission reduction mandates.

By utilizing advanced biomanufacturing processes and sustainable agricultural practices, agricultural producers maintain high animal growth rates while ensuring robust nutritional deficit compensation without overburdening digestive systems.
Get Free Sample

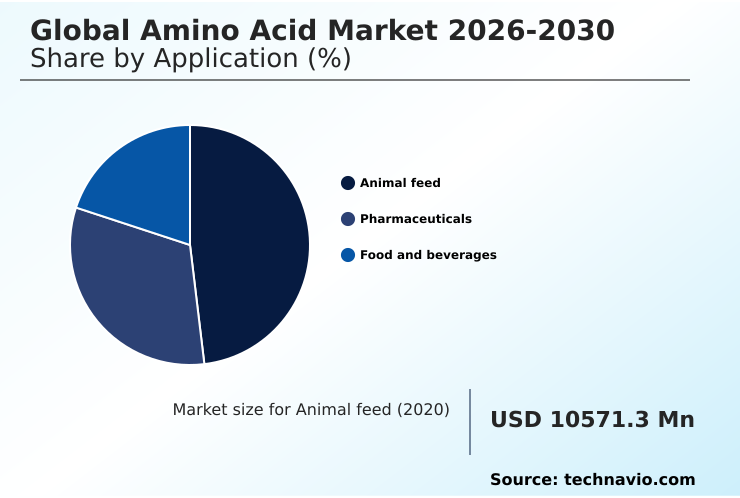
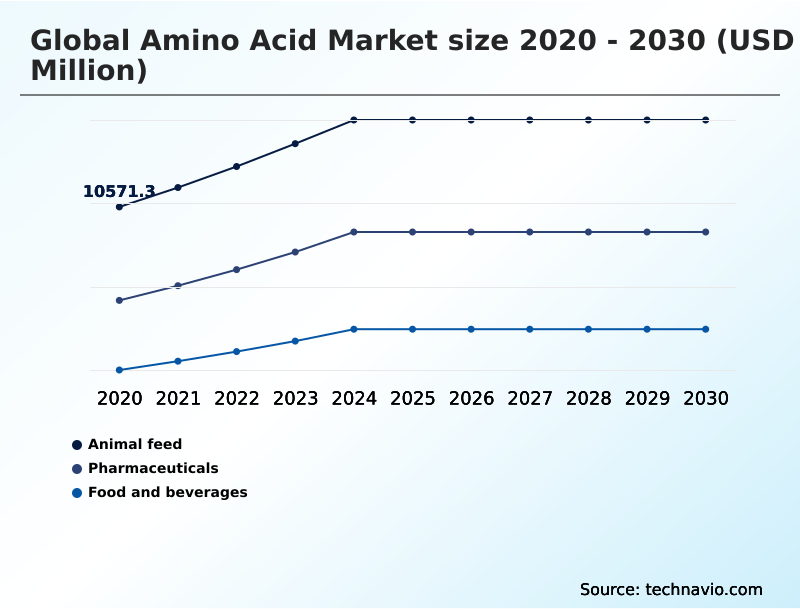
The Animal feed segment was valued at USD 13.87 billion in 2024 and showed a gradual increase during the forecast period.
Get Free Sample

Regional Analysis

APAC is estimated to contribute 46.8% to the growth of the global market during the forecast period.Technavio’s analysts have elaborately explained the regional trends and drivers that shape the market during the forecast period.
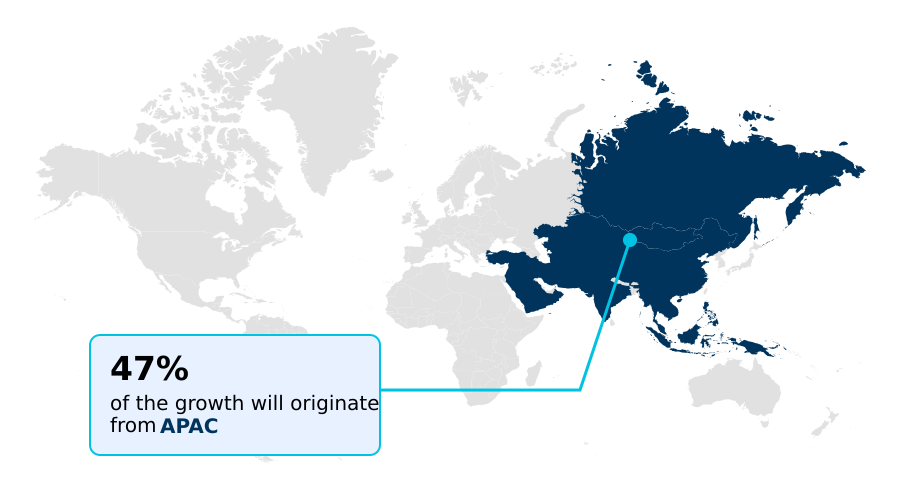
See How Amino Acid Market Demand is Rising in APAC Get Free Sample

The geographic landscape of the Amino Acid Market highlights a distinct divergence in regional adoption and operational scale. APAC leads commercial production, utilizing mega-scale microbial fermentation to support massive aquaculture and livestock sectors.

The capacity expansion in APAC has resulted in bulk production output outpacing European facilities by 35%, maximizing cellular productivity maximization. Conversely, North America and Europe prioritize high-purity crystallization infrastructure and specialized peptide synthesis for biopharmaceutical synthesis.

Within these Western hubs, continuous fermentation optimization and compliance alignment have improved processing times by 20%. While APAC focuses on high-volume bio-derived raw materials and agricultural biostimulants, Western markets heavily invest in pharmaceutical-grade formulation and targeted bioactive combinations.

This strategic contrast allows APAC to dominate bulk manufacturing, whereas North American operators achieve a 15% higher margin on clinical formulations, reflecting tailored approaches to regional supply chain demands.

Market Dynamics

Our researchers analyzed the data with 2025 as the base year, along with the key drivers, trends, and challenges. A holistic analysis of drivers will help companies refine their marketing strategies to gain a competitive advantage.

  • The continuous evolution of the Amino Acid Market is fundamentally driven by the necessity to enhance operational efficiency across diverse biochemical supply chains. As agricultural and biotechnology sectors scale production, operators are heavily investing in microbial fermentation optimization strategies to maximize yield and reduce energy consumption.
  • This focus on process refinement allows manufacturers to improve raw material conversion rates by 22% compared to legacy extraction methods, drastically lowering overhead expenses. Furthermore, the rising consumer demand for eco-friendly personal care and food products has accelerated the search for plant-based feed additive alternatives, enabling enterprises to transition away from petroleum-derived synthetic inputs.
  • Ensuring consistent high-quality outputs requires the implementation of sustainable amino acid production processes, which align tightly with global regulatory frameworks targeting emissions. In the healthcare sector, the surging requirements for clinical nutrition and monoclonal antibody manufacturing highlight the critical importance of biopharmaceutical cell culture media synthesis.
  • These highly purified formulations are essential for maintaining cellular viability and ensuring the structural integrity of advanced therapeutics. Concurrently, agricultural operators are increasingly relying on precision livestock nutrition formulations to optimize animal growth metrics while minimizing environmental waste.
  • By integrating these targeted nutritional strategies, commercial farming operations significantly lower their dependency on volatile commodity proteins, thereby strengthening supply chain resilience and protecting gross margins against sudden agricultural pricing fluctuations.
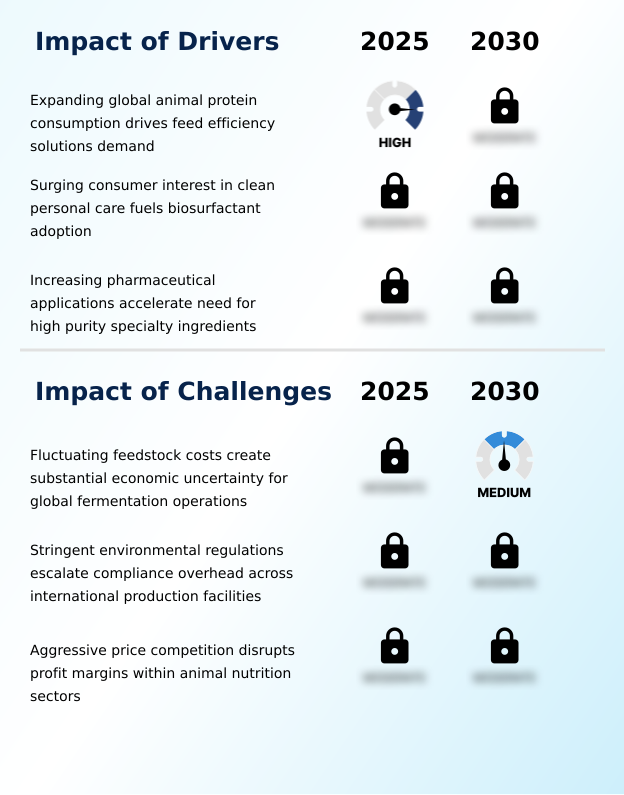
What are the key market drivers leading to the rise in the adoption of Amino Acid Industry?

  • The escalating consumption of animal protein worldwide is significantly accelerating the demand for advanced feed efficiency solutions in commercial livestock operations.

  • Escalating demand for high-purity clinical applications and functional sports nutrition acts as a primary catalyst for the Amino Acid Market. Because demographic shifts require precise nutrient delivery, the utilization of intravenous parenteral nutrition has surged across healthcare systems.
  • To satisfy rigorous pharmacopeial standards, producers are heavily investing in metabolic engineering and specialized downstream purification infrastructure. Consequently, facilities deploying these advanced systems alongside targeted enzymatic extraction report that final product purity improved by 14%, significantly reducing costly batch rejections.
  • Simultaneously, the expanding deployment of cell culture media for therapeutic synthesis and metabolic pathway optimization has lowered upstream processing delays by 22%.
  • By securing high-quality bio-based ingredients and customized amino acid ingredients, pharmaceutical manufacturers maintain strict compliance while accelerating the commercial rollout of complex therapeutic pipelines.

What are the market trends shaping the Amino Acid Industry?

  • The shift toward sustainable, plant-based feedstocks is fundamentally restructuring manufacturing operations. This transition promotes eco-friendly production while significantly reducing reliance on conventional agricultural carbon sources.

  • The accelerated integration of computational strain design is fundamentally redefining manufacturing parameters within the Amino Acid Market. To bypass the natural limits of traditional bacterial strains, biotechnology enterprises are deploying genetic engineering to manipulate pathways for enhanced recombinant protein expression.
  • Because custom cell factories significantly enhance substrate conversion through renewable biomass utilization, fermentation yield optimization rates have improved by 28%, directly lowering baseline production expenses. Furthermore, the adoption of automated big-bag packaging has reduced supply chain downtime by 15%, ensuring consistent batch delivery.
  • As consumer scrutiny intensifies, downstream buyers mandate full traceability, prompting manufacturers to adopt bio-based biosurfactants, eco-friendly biosurfactants, and clean-label formulations. This transition toward sustainable operations within circular economy models maximizes resource efficiency by 20%, heavily influencing corporate asset acquisition strategies across the biological engineering sector.

What challenges does the Amino Acid Industry face during its growth?

  • Volatility in raw material pricing introduces considerable economic uncertainty, severely pressuring the profit margins of international fermentation operations.

  • Extreme volatility in raw material and energy pricing introduces severe operational friction across the Amino Acid Market. Because biochemical processes rely heavily on carbon-intensive fermentation feedstocks and synthetic chemical intermediates, sudden fluctuations in agricultural commodity costs directly erode gross profit margins.
  • To comply with tightening regional environmental frameworks, industrial facilities are forced to integrate biological wastewater treatment units and advanced biological wastewater treatment systems, drastically inflating overhead expenses. Consequently, mid-sized operators face severe capital constraints, leading to a 15% reduction in discretionary investments for synthetic biology platforms and metabolic regulation research.
  • Furthermore, aggressive spot market price competition for plant-derived functional ingredients and natural flavor enhancers has compressed profit margins by nearly 12%. Overcoming these structural hurdles requires massive capital allocation toward organic wastewater management, ensuring continuous international market participation despite unpredictable feedstock variations.

Exclusive Technavio Analysis on Customer Landscape

The amino acid market forecasting report includes the adoption lifecycle of the market, covering from the innovator’s stage to the laggard’s stage. It focuses on adoption rates in different regions based on penetration. Furthermore, the amino acid market report also includes key purchase criteria and drivers of price sensitivity to help companies evaluate and develop their market growth analysis strategies.
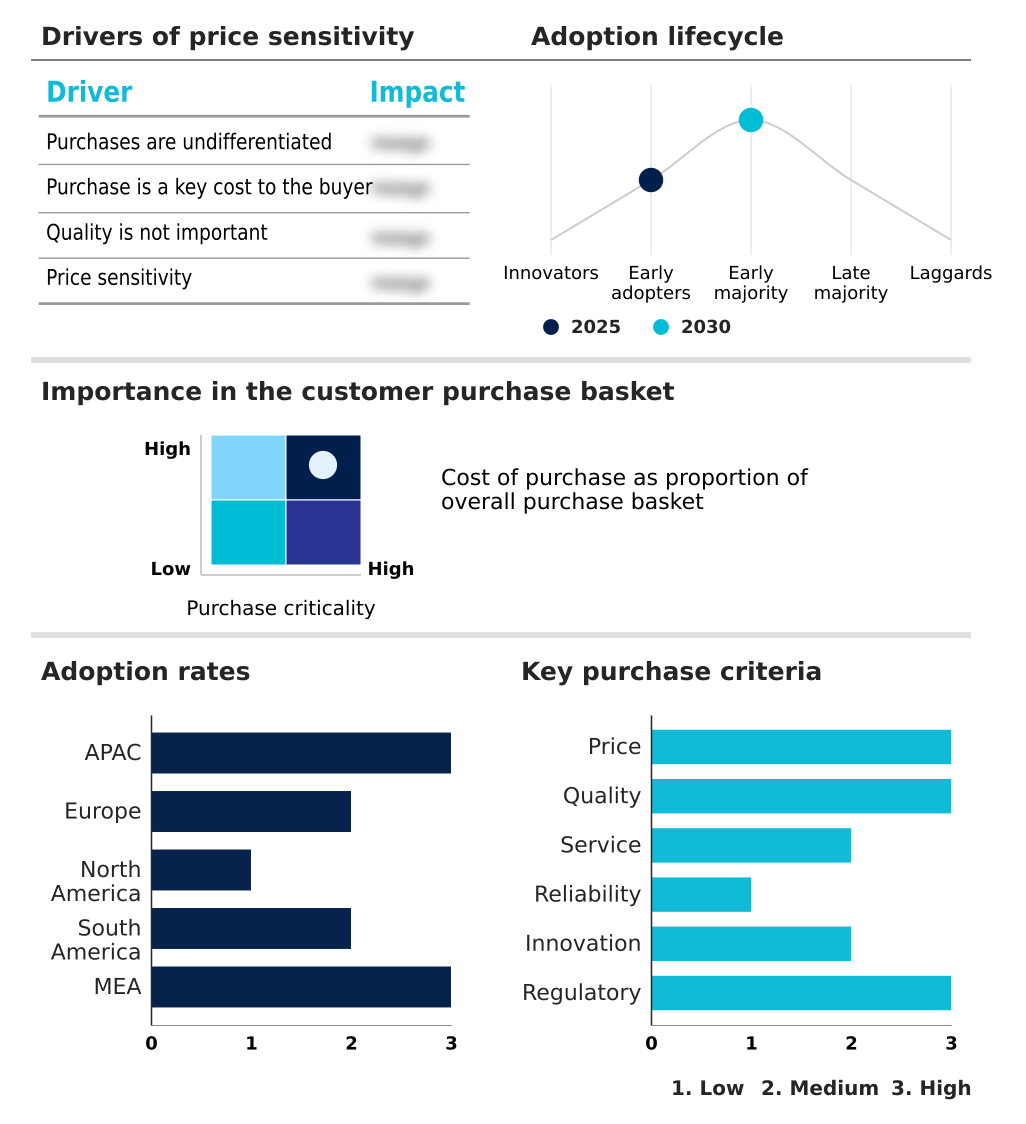
Customer Landscape of Amino Acid Industry

Competitive Landscape

Companies are implementing various strategies, such as strategic alliances, amino acid market forecast, partnerships, mergers and acquisitions, geographical expansion, and product/service launches, to enhance their presence in the industry.

Adisseo France SAS - Focusing on animal nutrition additives, the entity provides specialized solutions such as Rhodimet AT88 and MetSmart to enhance livestock feed efficiency and agricultural productivity globally.

The industry research and growth report includes detailed analyses of the competitive landscape of the market and information about key companies, including:

  • Adisseo France SAS
  • Ajinomoto Co. Inc.
  • Amino GmbH
  • Archer Daniels Midland Co.
  • Bachem AG
  • China Amino Acid Co. Ltd.
  • CJ CheilJedang Corp.
  • Daesang Corp.
  • Evonik Industries AG
  • Fufeng Group Ltd.
  • Global Bio chem Technology Group
  • Hebei Feng Pharmaceutical
  • Hebei Huaheng Biological Tech
  • Iris Biotech GmbH
  • Kemin Industries Inc.
  • Meihua Holdings Group Co. Ltd.
  • Resonac Holdings Corp.
  • Sichuan Tongsheng Amino acid
  • Sumitomo Chemical Co. Ltd.
  • Yuki Gosei Kogyo Co. Ltd.

Qualitative and quantitative analysis of companies has been conducted to help clients understand the wider business environment as well as the strengths and weaknesses of key industry players. Data is qualitatively analyzed to categorize companies as pure play, category-focused, industry-focused, and diversified; it is quantitatively analyzed to categorize companies as dominant, leading, strong, tentative, and weak.

Recent Development and News in Amino acid market

  • In the Commodity Chemicals industry, the rapid deployment of biological wastewater treatment units to meet stringent environmental standards has elevated base manufacturing costs, directly impacting Amino Acid demand by forcing suppliers to optimize downstream purification.
  • The structural shift toward renewable biomass utilization for producing synthetic chemical intermediates has accelerated fermentation yield optimization, directly impacting Amino Acid supply chains by lowering the input costs of raw materials.
  • The integration of computational strain design in advanced biomanufacturing processes has revolutionized recombinant protein expression capabilities, directly impacting Amino Acid production efficiency by increasing the commercial output of bio-derived raw materials by over 18%.
  • The implementation of circular economy models for organic wastewater management has transformed raw material sourcing, directly impacting Amino Acid market dynamics by encouraging the adoption of plant-derived functional ingredients over petroleum-based alternatives.

Dive into Technavio’s robust research methodology, blending expert interviews, extensive data synthesis, and validated models for unparalleled Amino Acid Market insights. See full methodology.

Market Scope
Page number 299
Base year 2025
Historic period 2020-2024
Forecast period 2026-2030
Growth momentum & CAGR Accelerate at a CAGR of 8.1%
Market growth 2026-2030 USD 15136.2 million
Market structure Fragmented
YoY growth 2025-2026(%) 7.9%
Key countries China, Japan, India, South Korea, Indonesia, Australia, Germany, France, UK, Italy, Spain, The Netherlands, US, Canada, Mexico, Brazil, Argentina, Chile, South Africa, Saudi Arabia, UAE, Egypt and Turkey
Competitive landscape Leading Companies, Market Positioning of Companies, Competitive Strategies, and Industry Risks

Request Free Sample

Research Analyst Overview

  • The Amino Acid Market demonstrates continuous operational evolution, fundamentally propelled by advancements in synthetic biological processing and targeted cellular formulation. Enterprise leadership teams are actively recalibrating product strategies to incorporate advanced biosurfactants and plant-derived functional components, directly responding to rigorous clean-label mandates. This strategic shift away from petrochemical derivatives necessitates heavy capital allocation toward continuous process optimization and high-purity extraction.
  • Consequently, manufacturing facilities integrating these advanced bio-processing frameworks report that overall resource efficiency increased by 18% compared to traditional synthesis models. The rapid adoption of metabolic regulation techniques and recombinant protein integration further enables producers to commercialize rare biochemical compounds at unprecedented scales.
  • Boardroom decisions increasingly prioritize securing reliable fermentation inputs to buffer against volatile agricultural commodity cycles and safeguard profit margins. Furthermore, the integration of targeted bioactive structures into clinical nutrition pipelines ensures robust compliance with international pharmacopeia standards.
  • By optimizing these sophisticated biochemical pathways, global supply chains maintain high-purity output while successfully navigating the complex matrix of modern environmental and therapeutic regulatory demands.

What are the Key Data Covered in this Amino Acid Market Research and Growth Report?

  • What is the expected growth of the Amino Acid Market between 2026 and 2030?

    • USD 15.14 billion, at a CAGR of 8.1%

  • What segmentation does the market report cover?

    • The report is segmented by Application (Animal feed, Pharmaceuticals, and Food and beverages), Type (Plant based, and Animal based), Product (Non-essential, and Essential) and Geography (APAC, Europe, North America, South America, Middle East and Africa)

  • Which regions are analyzed in the report?

    • APAC, Europe, North America, South America and Middle East and Africa

  • What are the key growth drivers and market challenges?

    • Expanding global animal protein consumption drives feed efficiency solutions demand, Fluctuating feedstock costs create substantial economic uncertainty for global fermentation operations

  • Who are the major players in the Amino Acid Market?

    • Adisseo France SAS, Ajinomoto Co. Inc., Amino GmbH, Archer Daniels Midland Co., Bachem AG, China Amino Acid Co. Ltd., CJ CheilJedang Corp., Daesang Corp., Evonik Industries AG, Fufeng Group Ltd., Global Bio chem Technology Group, Hebei Feng Pharmaceutical, Hebei Huaheng Biological Tech, Iris Biotech GmbH, Kemin Industries Inc., Meihua Holdings Group Co. Ltd., Resonac Holdings Corp., Sichuan Tongsheng Amino acid, Sumitomo Chemical Co. Ltd. and Yuki Gosei Kogyo Co. Ltd.

Market Research Insights

  • The Amino Acid Market is undergoing rapid modernization as enterprises prioritize bio-based ingredients to enhance operational resilience. By integrating customized amino acid ingredients into supply chains, manufacturers report that raw material waste dropped by 18%, significantly optimizing overhead costs.
  • Furthermore, the adoption of advanced biological wastewater treatment enables a 25% increase in resource recovery rates, ensuring strict alignment with international environmental mandates. The shift toward natural flavor enhancers in food processing has also accelerated, allowing brands to improve product shelf-life stability by 12%.
  • Leveraging fermentation yield optimization and renewable biomass utilization, commercial producers are successfully mitigating supply chain volatility while meeting the complex regulatory requirements of modern biopharmaceutical and agricultural sectors.

We can help! Our analysts can customize this amino acid market research report to meet your requirements.

Get in touch

1. Executive Summary

1.1 Market overview

Executive Summary - Chart on Market Overview
Executive Summary - Data Table on Market Overview
Executive Summary - Chart on Global Market Characteristics
Executive Summary - Chart on Market by Geography
Executive Summary - Chart on Market Segmentation by Application
Executive Summary - Chart on Market Segmentation by Type
Executive Summary - Chart on Market Segmentation by Product
Executive Summary - Chart on Incremental Growth
Executive Summary - Data Table on Incremental Growth
Executive Summary - Chart on Company Market Positioning

2. Technavio Analysis

2.1 Analysis of price sensitivity, lifecycle, customer purchase basket, adoption rates, and purchase criteria

2.2 Criticality of inputs and Factors of differentiation

Chart on Overview on criticality of inputs and factors of differentiation

2.3 Factors of disruption

Chart on Overview on factors of disruption

2.4 Impact of drivers and challenges

Chart on Impact of drivers and challenges in 2025 and 2030

3. Market Landscape

3.1 Market ecosystem

Chart on Parent Market
Data Table on - Parent Market

3.2 Market characteristics

Chart on Market characteristics analysis

3.3 Value chain analysis

Chart on Value chain analysis

4. Market Sizing

4.1 Market definition

Data Table on Offerings of companies included in the market definition

4.2 Market segment analysis

Market segments

4.3 Market size 2025

4.4 Market outlook: Forecast for 2025-2030

Chart on Global - Market size and forecast 2025-2030 ($ million)
Data Table on Global - Market size and forecast 2025-2030 ($ million)
Chart on Global Market: Year-over-year growth 2025-2030 (%)
Data Table on Global Market: Year-over-year growth 2025-2030 (%)

5. Historic Market Size

5.1 Global Amino Acid Market 2020 - 2024

Historic Market Size - Data Table on Global Amino Acid Market 2020 - 2024 ($ million)

5.2 Application segment analysis 2020 - 2024

Historic Market Size - Application Segment 2020 - 2024 ($ million)

5.3 Type segment analysis 2020 - 2024

Historic Market Size - Type Segment 2020 - 2024 ($ million)

5.4 Product segment analysis 2020 - 2024

Historic Market Size - Product Segment 2020 - 2024 ($ million)

5.5 Geography segment analysis 2020 - 2024

Historic Market Size - Geography Segment 2020 - 2024 ($ million)

5.6 Country segment analysis 2020 - 2024

Historic Market Size - Country Segment 2020 - 2024 ($ million)

6. Qualitative Analysis

6.1 Impact of AI on global amino acid market

6.2 Impact of geopolitical conflicts on global amino acid market

7. Five Forces Analysis

7.1 Five forces summary

Five forces analysis - Comparison between 2025 and 2030

7.2 Bargaining power of buyers

Bargaining power of buyers - Impact of key factors 2025 and 2030

7.3 Bargaining power of suppliers

Bargaining power of suppliers - Impact of key factors in 2025 and 2030

7.4 Threat of new entrants

Threat of new entrants - Impact of key factors in 2025 and 2030

7.5 Threat of substitutes

Threat of substitutes - Impact of key factors in 2025 and 2030

7.6 Threat of rivalry

Threat of rivalry - Impact of key factors in 2025 and 2030

7.7 Market condition

Chart on Market condition - Five forces 2025 and 2030

8. Market Segmentation by Application

8.1 Market segments

Chart on Application - Market share 2025-2030 (%)
Data Table on Application - Market share 2025-2030 (%)

8.2 Comparison by Application

Chart on Comparison by Application
Data Table on Comparison by Application

8.3 Animal feed - Market size and forecast 2025-2030

Chart on Animal feed - Market size and forecast 2025-2030 ($ million)
Data Table on Animal feed - Market size and forecast 2025-2030 ($ million)
Chart on Animal feed - Year-over-year growth 2025-2030 (%)
Data Table on Animal feed - Year-over-year growth 2025-2030 (%)

8.4 Pharmaceuticals - Market size and forecast 2025-2030

Chart on Pharmaceuticals - Market size and forecast 2025-2030 ($ million)
Data Table on Pharmaceuticals - Market size and forecast 2025-2030 ($ million)
Chart on Pharmaceuticals - Year-over-year growth 2025-2030 (%)
Data Table on Pharmaceuticals - Year-over-year growth 2025-2030 (%)

8.5 Food and beverages - Market size and forecast 2025-2030

Chart on Food and beverages - Market size and forecast 2025-2030 ($ million)
Data Table on Food and beverages - Market size and forecast 2025-2030 ($ million)
Chart on Food and beverages - Year-over-year growth 2025-2030 (%)
Data Table on Food and beverages - Year-over-year growth 2025-2030 (%)

8.6 Market opportunity by Application

Market opportunity by Application ($ million)
Data Table on Market opportunity by Application ($ million)

9. Market Segmentation by Type

9.1 Market segments

Chart on Type - Market share 2025-2030 (%)
Data Table on Type - Market share 2025-2030 (%)

9.2 Comparison by Type

Chart on Comparison by Type
Data Table on Comparison by Type

9.3 Plant based - Market size and forecast 2025-2030

Chart on Plant based - Market size and forecast 2025-2030 ($ million)
Data Table on Plant based - Market size and forecast 2025-2030 ($ million)
Chart on Plant based - Year-over-year growth 2025-2030 (%)
Data Table on Plant based - Year-over-year growth 2025-2030 (%)

9.4 Animal based - Market size and forecast 2025-2030

Chart on Animal based - Market size and forecast 2025-2030 ($ million)
Data Table on Animal based - Market size and forecast 2025-2030 ($ million)
Chart on Animal based - Year-over-year growth 2025-2030 (%)
Data Table on Animal based - Year-over-year growth 2025-2030 (%)

9.5 Market opportunity by Type

Market opportunity by Type ($ million)
Data Table on Market opportunity by Type ($ million)

10. Market Segmentation by Product

10.1 Market segments

Chart on Product - Market share 2025-2030 (%)
Data Table on Product - Market share 2025-2030 (%)

10.2 Comparison by Product

Chart on Comparison by Product
Data Table on Comparison by Product

10.3 Non-essential - Market size and forecast 2025-2030

Chart on Non-essential - Market size and forecast 2025-2030 ($ million)
Data Table on Non-essential - Market size and forecast 2025-2030 ($ million)
Chart on Non-essential - Year-over-year growth 2025-2030 (%)
Data Table on Non-essential - Year-over-year growth 2025-2030 (%)

10.4 Essential - Market size and forecast 2025-2030

Chart on Essential - Market size and forecast 2025-2030 ($ million)
Data Table on Essential - Market size and forecast 2025-2030 ($ million)
Chart on Essential - Year-over-year growth 2025-2030 (%)
Data Table on Essential - Year-over-year growth 2025-2030 (%)

10.5 Market opportunity by Product

Market opportunity by Product ($ million)
Data Table on Market opportunity by Product ($ million)

11. Customer Landscape

11.1 Customer landscape overview

Analysis of price sensitivity, lifecycle, customer purchase basket, adoption rates, and purchase criteria

12. Geographic Landscape

12.1 Geographic segmentation

Chart on Market share by geography 2025-2030 (%)
Data Table on Market share by geography 2025-2030 (%)

12.2 Geographic comparison

Chart on Geographic comparison
Data Table on Geographic comparison

12.3 APAC - Market size and forecast 2025-2030

Chart on APAC - Market size and forecast 2025-2030 ($ million)
Data Table on APAC - Market size and forecast 2025-2030 ($ million)
Chart on APAC - Year-over-year growth 2025-2030 (%)
Data Table on APAC - Year-over-year growth 2025-2030 (%)
Chart on Regional Comparison - APAC
Data Table on Regional Comparison - APAC

12.3.1 China - Market size and forecast 2025-2030

Chart on China - Market size and forecast 2025-2030 ($ million)
Data Table on China - Market size and forecast 2025-2030 ($ million)
Chart on China - Year-over-year growth 2025-2030 (%)
Data Table on China - Year-over-year growth 2025-2030 (%)

12.3.2 Japan - Market size and forecast 2025-2030

Chart on Japan - Market size and forecast 2025-2030 ($ million)
Data Table on Japan - Market size and forecast 2025-2030 ($ million)
Chart on Japan - Year-over-year growth 2025-2030 (%)
Data Table on Japan - Year-over-year growth 2025-2030 (%)

12.3.3 India - Market size and forecast 2025-2030

Chart on India - Market size and forecast 2025-2030 ($ million)
Data Table on India - Market size and forecast 2025-2030 ($ million)
Chart on India - Year-over-year growth 2025-2030 (%)
Data Table on India - Year-over-year growth 2025-2030 (%)

12.3.4 South Korea - Market size and forecast 2025-2030

Chart on South Korea - Market size and forecast 2025-2030 ($ million)
Data Table on South Korea - Market size and forecast 2025-2030 ($ million)
Chart on South Korea - Year-over-year growth 2025-2030 (%)
Data Table on South Korea - Year-over-year growth 2025-2030 (%)

12.3.5 Indonesia - Market size and forecast 2025-2030

Chart on Indonesia - Market size and forecast 2025-2030 ($ million)
Data Table on Indonesia - Market size and forecast 2025-2030 ($ million)
Chart on Indonesia - Year-over-year growth 2025-2030 (%)
Data Table on Indonesia - Year-over-year growth 2025-2030 (%)

12.3.6 Australia - Market size and forecast 2025-2030

Chart on Australia - Market size and forecast 2025-2030 ($ million)
Data Table on Australia - Market size and forecast 2025-2030 ($ million)
Chart on Australia - Year-over-year growth 2025-2030 (%)
Data Table on Australia - Year-over-year growth 2025-2030 (%)

12.4 Europe - Market size and forecast 2025-2030

Chart on Europe - Market size and forecast 2025-2030 ($ million)
Data Table on Europe - Market size and forecast 2025-2030 ($ million)
Chart on Europe - Year-over-year growth 2025-2030 (%)
Data Table on Europe - Year-over-year growth 2025-2030 (%)
Chart on Regional Comparison - Europe
Data Table on Regional Comparison - Europe

12.4.1 Germany - Market size and forecast 2025-2030

Chart on Germany - Market size and forecast 2025-2030 ($ million)
Data Table on Germany - Market size and forecast 2025-2030 ($ million)
Chart on Germany - Year-over-year growth 2025-2030 (%)
Data Table on Germany - Year-over-year growth 2025-2030 (%)

12.4.2 France - Market size and forecast 2025-2030

Chart on France - Market size and forecast 2025-2030 ($ million)
Data Table on France - Market size and forecast 2025-2030 ($ million)
Chart on France - Year-over-year growth 2025-2030 (%)
Data Table on France - Year-over-year growth 2025-2030 (%)

12.4.3 UK - Market size and forecast 2025-2030

Chart on UK - Market size and forecast 2025-2030 ($ million)
Data Table on UK - Market size and forecast 2025-2030 ($ million)
Chart on UK - Year-over-year growth 2025-2030 (%)
Data Table on UK - Year-over-year growth 2025-2030 (%)

12.4.4 Italy - Market size and forecast 2025-2030

Chart on Italy - Market size and forecast 2025-2030 ($ million)
Data Table on Italy - Market size and forecast 2025-2030 ($ million)
Chart on Italy - Year-over-year growth 2025-2030 (%)
Data Table on Italy - Year-over-year growth 2025-2030 (%)

12.4.5 Spain - Market size and forecast 2025-2030

Chart on Spain - Market size and forecast 2025-2030 ($ million)
Data Table on Spain - Market size and forecast 2025-2030 ($ million)
Chart on Spain - Year-over-year growth 2025-2030 (%)
Data Table on Spain - Year-over-year growth 2025-2030 (%)

12.4.6 The Netherlands - Market size and forecast 2025-2030

Chart on The Netherlands - Market size and forecast 2025-2030 ($ million)
Data Table on The Netherlands - Market size and forecast 2025-2030 ($ million)
Chart on The Netherlands - Year-over-year growth 2025-2030 (%)
Data Table on The Netherlands - Year-over-year growth 2025-2030 (%)

12.5 North America - Market size and forecast 2025-2030

Chart on North America - Market size and forecast 2025-2030 ($ million)
Data Table on North America - Market size and forecast 2025-2030 ($ million)
Chart on North America - Year-over-year growth 2025-2030 (%)
Data Table on North America - Year-over-year growth 2025-2030 (%)
Chart on Regional Comparison - North America
Data Table on Regional Comparison - North America

12.5.1 US - Market size and forecast 2025-2030

Chart on US - Market size and forecast 2025-2030 ($ million)
Data Table on US - Market size and forecast 2025-2030 ($ million)
Chart on US - Year-over-year growth 2025-2030 (%)
Data Table on US - Year-over-year growth 2025-2030 (%)

12.5.2 Canada - Market size and forecast 2025-2030

Chart on Canada - Market size and forecast 2025-2030 ($ million)
Data Table on Canada - Market size and forecast 2025-2030 ($ million)
Chart on Canada - Year-over-year growth 2025-2030 (%)
Data Table on Canada - Year-over-year growth 2025-2030 (%)

12.5.3 Mexico - Market size and forecast 2025-2030

Chart on Mexico - Market size and forecast 2025-2030 ($ million)
Data Table on Mexico - Market size and forecast 2025-2030 ($ million)
Chart on Mexico - Year-over-year growth 2025-2030 (%)
Data Table on Mexico - Year-over-year growth 2025-2030 (%)

12.6 South America - Market size and forecast 2025-2030

Chart on South America - Market size and forecast 2025-2030 ($ million)
Data Table on South America - Market size and forecast 2025-2030 ($ million)
Chart on South America - Year-over-year growth 2025-2030 (%)
Data Table on South America - Year-over-year growth 2025-2030 (%)
Chart on Regional Comparison - South America
Data Table on Regional Comparison - South America

12.6.1 Brazil - Market size and forecast 2025-2030

Chart on Brazil - Market size and forecast 2025-2030 ($ million)
Data Table on Brazil - Market size and forecast 2025-2030 ($ million)
Chart on Brazil - Year-over-year growth 2025-2030 (%)
Data Table on Brazil - Year-over-year growth 2025-2030 (%)

12.6.2 Argentina - Market size and forecast 2025-2030

Chart on Argentina - Market size and forecast 2025-2030 ($ million)
Data Table on Argentina - Market size and forecast 2025-2030 ($ million)
Chart on Argentina - Year-over-year growth 2025-2030 (%)
Data Table on Argentina - Year-over-year growth 2025-2030 (%)

12.6.3 Chile - Market size and forecast 2025-2030

Chart on Chile - Market size and forecast 2025-2030 ($ million)
Data Table on Chile - Market size and forecast 2025-2030 ($ million)
Chart on Chile - Year-over-year growth 2025-2030 (%)
Data Table on Chile - Year-over-year growth 2025-2030 (%)

12.7 Middle East and Africa - Market size and forecast 2025-2030

Chart on Middle East and Africa - Market size and forecast 2025-2030 ($ million)
Data Table on Middle East and Africa - Market size and forecast 2025-2030 ($ million)
Chart on Middle East and Africa - Year-over-year growth 2025-2030 (%)
Data Table on Middle East and Africa - Year-over-year growth 2025-2030 (%)
Chart on Regional Comparison - Middle East and Africa
Data Table on Regional Comparison - Middle East and Africa

12.7.1 South Africa - Market size and forecast 2025-2030

Chart on South Africa - Market size and forecast 2025-2030 ($ million)
Data Table on South Africa - Market size and forecast 2025-2030 ($ million)
Chart on South Africa - Year-over-year growth 2025-2030 (%)
Data Table on South Africa - Year-over-year growth 2025-2030 (%)

12.7.2 Saudi Arabia - Market size and forecast 2025-2030

Chart on Saudi Arabia - Market size and forecast 2025-2030 ($ million)
Data Table on Saudi Arabia - Market size and forecast 2025-2030 ($ million)
Chart on Saudi Arabia - Year-over-year growth 2025-2030 (%)
Data Table on Saudi Arabia - Year-over-year growth 2025-2030 (%)

12.7.3 UAE - Market size and forecast 2025-2030

Chart on UAE - Market size and forecast 2025-2030 ($ million)
Data Table on UAE - Market size and forecast 2025-2030 ($ million)
Chart on UAE - Year-over-year growth 2025-2030 (%)
Data Table on UAE - Year-over-year growth 2025-2030 (%)

12.7.4 Egypt - Market size and forecast 2025-2030

Chart on Egypt - Market size and forecast 2025-2030 ($ million)
Data Table on Egypt - Market size and forecast 2025-2030 ($ million)
Chart on Egypt - Year-over-year growth 2025-2030 (%)
Data Table on Egypt - Year-over-year growth 2025-2030 (%)

12.7.5 Turkey - Market size and forecast 2025-2030

Chart on Turkey - Market size and forecast 2025-2030 ($ million)
Data Table on Turkey - Market size and forecast 2025-2030 ($ million)
Chart on Turkey - Year-over-year growth 2025-2030 (%)
Data Table on Turkey - Year-over-year growth 2025-2030 (%)

12.8 Market opportunity by geography

Market opportunity by geography ($ million)
Data Tables on Market opportunity by geography ($ million)

13. Drivers, Challenges, and Opportunity

13.1 Market drivers

Expanding global animal protein consumption drives feed efficiency solutions demand
Surging consumer interest in clean personal care fuels biosurfactant adoption
Increasing pharmaceutical applications accelerate need for high purity specialty ingredients

13.2 Market challenges

Fluctuating feedstock costs create substantial economic uncertainty for global fermentation operations
Stringent environmental regulations escalate compliance overhead across international production facilities
Aggressive price competition disrupts profit margins within animal nutrition sectors

13.3 Impact of drivers and challenges

Impact of drivers and challenges in 2025 and 2030

13.4 Market opportunities

Shift toward sustainable plant based feedstocks transforms global manufacturing operations
Synthetic biology innovations modernize fermentation strains and enhance yield rates
Growing consumer preference for clean label foods boosts natural ferment adoption

14. Competitive Landscape

14.1 Overview

14.2

Overview on criticality of inputs and factors of differentiation

14.3 Landscape disruption

Overview on factors of disruption

14.4 Industry risks

Impact of key risks on business

15. Competitive Analysis

15.1 Companies profiled

Companies covered

15.2 Company ranking index

15.3 Market positioning of companies

Matrix on companies position and classification

15.4 Adisseo France SAS

Adisseo France SAS - Overview
Adisseo France SAS - Product / Service
Adisseo France SAS - Key offerings
SWOT

15.5 Ajinomoto Co. Inc.

Ajinomoto Co. Inc. - Overview
Ajinomoto Co. Inc. - Business segments
Ajinomoto Co. Inc. - Key offerings
Ajinomoto Co. Inc. - Segment focus
SWOT

15.6 Archer Daniels Midland Co.

Archer Daniels Midland Co. - Overview
Archer Daniels Midland Co. - Business segments
Archer Daniels Midland Co. - Key news
Archer Daniels Midland Co. - Key offerings
Archer Daniels Midland Co. - Segment focus
SWOT

15.7 Bachem AG

Bachem AG - Overview
Bachem AG - Business segments
Bachem AG - Key news
Bachem AG - Key offerings
Bachem AG - Segment focus
SWOT

15.8 China Amino Acid Co. Ltd.

China Amino Acid Co. Ltd. - Overview
China Amino Acid Co. Ltd. - Product / Service
China Amino Acid Co. Ltd. - Key offerings
SWOT

15.9 Daesang Corp.

Daesang Corp. - Overview
Daesang Corp. - Business segments
Daesang Corp. - Key offerings
Daesang Corp. - Segment focus
SWOT

15.10 Evonik Industries AG

Evonik Industries AG - Overview
Evonik Industries AG - Business segments
Evonik Industries AG - Key news
Evonik Industries AG - Key offerings
Evonik Industries AG - Segment focus
SWOT

15.11 Fufeng Group Ltd.

Fufeng Group Ltd. - Overview
Fufeng Group Ltd. - Business segments
Fufeng Group Ltd. - Key offerings
Fufeng Group Ltd. - Segment focus
SWOT

15.12 Global Bio chem Technology Group

Global Bio chem Technology Group - Overview
Global Bio chem Technology Group - Business segments
Global Bio chem Technology Group - Key offerings
Global Bio chem Technology Group - Segment focus
SWOT

15.13 Hebei Feng Pharmaceutical

Hebei Feng Pharmaceutical - Overview
Hebei Feng Pharmaceutical - Product / Service
Hebei Feng Pharmaceutical - Key offerings
SWOT

15.14 Hebei Huaheng Biological Tech

Hebei Huaheng Biological Tech - Overview
Hebei Huaheng Biological Tech - Product / Service
Hebei Huaheng Biological Tech - Key offerings
SWOT

15.15 Meihua Holdings Group Co. Ltd.

Meihua Holdings Group Co. Ltd. - Overview
Meihua Holdings Group Co. Ltd. - Product / Service
Meihua Holdings Group Co. Ltd. - Key offerings
SWOT

15.16 Resonac Holdings Corp.

Resonac Holdings Corp. - Overview
Resonac Holdings Corp. - Business segments
Resonac Holdings Corp. - Key offerings
Resonac Holdings Corp. - Segment focus
SWOT

15.17 Sumitomo Chemical Co. Ltd.

Sumitomo Chemical Co. Ltd. - Overview
Sumitomo Chemical Co. Ltd. - Business segments
Sumitomo Chemical Co. Ltd. - Key offerings
Sumitomo Chemical Co. Ltd. - Segment focus
SWOT

15.18 Yuki Gosei Kogyo Co. Ltd.

Yuki Gosei Kogyo Co. Ltd. - Overview
Yuki Gosei Kogyo Co. Ltd. - Product / Service
Yuki Gosei Kogyo Co. Ltd. - Key offerings
SWOT

16. Appendix

16.1 Scope of the report

Market definition
Objectives
Notes and caveats

16.2 Inclusions and exclusions checklist

Inclusions checklist
Exclusions checklist

16.3 Currency conversion rates for US$

16.4 Research methodology

16.5 Data procurement

Information sources

16.6 Data validation

16.7 Validation techniques employed for market sizing

16.8 Data synthesis

16.9 360 degree market analysis

16.10 List of abbreviations

Research Methodology

Technavio presents a detailed picture of the market by way of study, synthesis, and summation of data from multiple sources. The analysts have presented the various facets of the market with a particular focus on identifying the key industry influencers. The data thus presented is comprehensive, reliable, and the result of extensive research, both primary and secondary.

INFORMATION SOURCES

Primary sources

  • Manufacturers and suppliers
  • Channel partners
  • Industry experts
  • Strategic decision makers

Secondary sources

  • Industry journals and periodicals
  • Government data
  • Financial reports of key industry players
  • Historical data
  • Press releases

DATA ANALYSIS

Data Synthesis

  • Collation of data
  • Estimation of key figures
  • Analysis of derived insights

Data Validation

  • Triangulation with data models
  • Reference against proprietary databases
  • Corroboration with industry experts

REPORT WRITING

Qualitative

  • Market drivers
  • Market challenges
  • Market trends
  • Five forces analysis

Quantitative

  • Market size and forecast
  • Market segmentation
  • Geographical insights
  • Competitive landscape

Interested in this report?

Get your sample now to see our research methodology and insights!

Download Now

Frequently Asked Questions

Amino Acid market growth will increase by USD 15136.2 million during 2026-2030.

The Amino Acid market is expected to grow at a CAGR of 8.1% during 2026-2030.

Amino Acid market is segmented by Application (Animal feed, Pharmaceuticals, Food and beverages) Type (Plant based, Animal based) Product (Non-essential, Essential)

Adisseo France SAS, Ajinomoto Co. Inc., Amino GmbH, Archer Daniels Midland Co., Bachem AG, China Amino Acid Co. Ltd., CJ CheilJedang Corp., Daesang Corp., Evonik Industries AG, Fufeng Group Ltd., Global Bio chem Technology Group, Hebei Feng Pharmaceutical, Hebei Huaheng Biological Tech, Iris Biotech GmbH, Kemin Industries Inc., Meihua Holdings Group Co. Ltd., Resonac Holdings Corp., Sichuan Tongsheng Amino acid, Sumitomo Chemical Co. Ltd., Yuki Gosei Kogyo Co. Ltd. are a few of the key vendors in the Amino Acid market.

APAC will register the highest growth rate of 46.8% among the other regions. Therefore, the Amino Acid market in APAC is expected to garner significant business opportunities for the vendors during the forecast period.

China, Japan, India, South Korea, Indonesia, Australia, Germany, France, UK, Italy, Spain, The Netherlands, US, Canada, Mexico, Brazil, Argentina, Chile, South Africa, Saudi Arabia, UAE, Egypt, Turkey

  • Expanding global animal protein consumption drives feed efficiency solutions demand is the driving factor this market.

The Amino Acid market vendors should focus on grabbing business opportunities from the Application segment as it accounted for the largest market share in the base year.
RIA - Research AI Assistant
Ask RIA
