ACDC Power Supply Market Analysis, Size, and Forecast 2026-2030: APAC (China, Japan, and India), North America (US, Canada, and Mexico), Europe (Germany, UK, and France), Middle East and Africa (Saudi Arabia, UAE, and South Africa), South America (Brazil, Argentina, and Chile), and Rest of World (ROW)

ACDC Power Supply Market Analysis, Size, and Forecast 2026-2030:
APAC (China, Japan, and India), North America (US, Canada, and Mexico), Europe (Germany, UK, and France), Middle East and Africa (Saudi Arabia, UAE, and South Africa), South America (Brazil, Argentina, and Chile), and Rest of World (ROW)

Published: Oct 2026 304 Pages SKU: IRTNTR77910

Market Overview at a Glance

$13.77 B
Market Opportunity
6.6%
CAGR 2025 - 2030
46.2%
APAC Growth
$14.01 B
Consumer electronics segment 2024

Acdc Power Supply Market Size 2026-2030

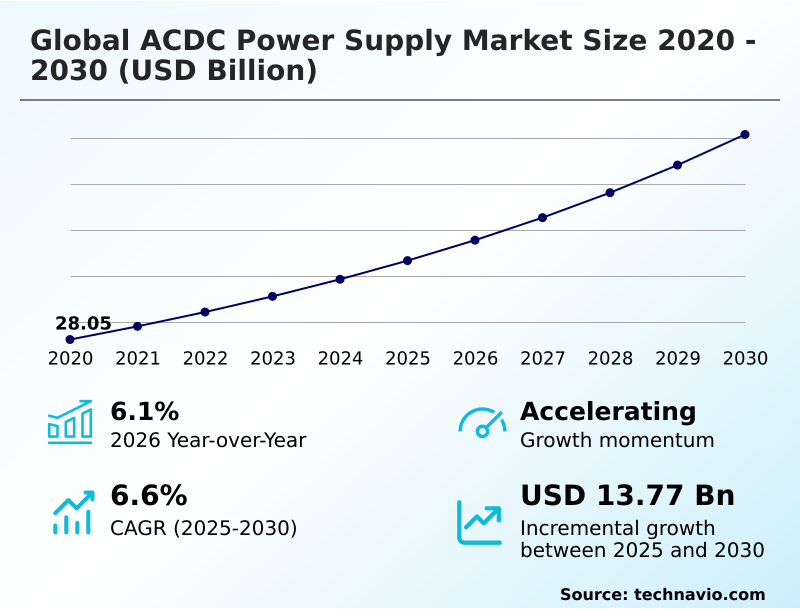
The acdc power supply market size is valued to increase by USD 13.77 billion, at a CAGR of 6.6% from 2025 to 2030. Accelerated expansion of high-density data centers will drive the acdc power supply market.

Major Market Trends & Insights

  • APAC dominated the market and accounted for a 46.2% growth during the forecast period.
  • By Application - Consumer electronics segment was valued at USD 14.01 billion in 2024
  • By Type - AC-DC segment accounted for the largest market revenue share in 2024

Market Size & Forecast

  • Market Opportunities: USD 22.37 billion
  • Market Future Opportunities: USD 13.77 billion
  • CAGR from 2025 to 2030 : 6.6%

Market Summary

  • The ACDC Power Supply Market demonstrates rigorous operational scaling, driven by the absolute necessity to convert alternating current grids into stable direct current for sensitive microelectronics. Enterprise data centers and automated manufacturing facilities require highly resilient power infrastructure to sustain continuous digital workflows.
  • For instance, hyperscale cloud operators deploying high-density server racks utilize digitally controlled power shelves to manage dynamic processing loads, achieving a 22% improvement in overall facility energy utilization compared to legacy linear architectures. This accelerated expansion of artificial intelligence and cloud computing serves as a primary demand catalyst, as operators aggressively seek wide bandgap semiconductor integration to minimize electrical waste.
  • Conversely, intense thermal dissipation limits and high component density create severe engineering challenges, frequently leading to premature capacitor degradation if cooling configurations are not perfectly optimized. Securing consistent, high-purity magnetic materials amid supply chain friction further complicates production schedules.
  • By prioritizing modular designs and active power factor correction, equipment manufacturers continue to optimize conversion efficiency and reinforce infrastructure reliability across critical economic sectors.

What will be the Size of the Acdc Power Supply Market during the forecast period?
Get Key Insights on Market Forecast (PDF) Get Free Sample

How is the Acdc Power Supply Market Segmented?

The acdc power supply industry research report provides comprehensive data (region-wise segment analysis), with forecasts and estimates in "USD million" for the period 2026-2030, as well as historical data from 2020-2024 for the following segments.

  • Application
    • Consumer electronics
    • Wireless communication and infrastructure
    • Automotive
    • Energy
    • Others
  • Type
    • AC-DC
    • DC-DC
  • Power output
    • Between 25W-100W
    • Between 5W-12W
    • Between 13W-24W
    • Above 100W
  • Geography
    • APAC
      • China
      • Japan
      • India
      • South Korea
      • Australia
      • Indonesia
    • North America
      • US
      • Canada
      • Mexico
    • Europe
      • Germany
      • UK
      • France
      • Italy
      • Spain
      • The Netherlands
    • Middle East and Africa
      • Saudi Arabia
      • UAE
      • South Africa
      • Turkey
      • Israel
    • South America
      • Brazil
      • Argentina
      • Chile

By Application Insights

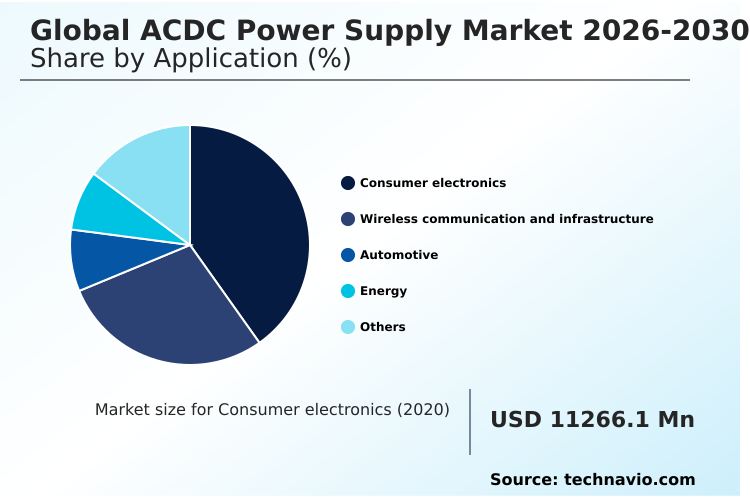
The consumer electronics segment is estimated to witness significant growth during the forecast period.

The consumer electronics application tier represents a high-volume operational category focused on ultra compact enclosure platforms and fast-charging architecture. Manufacturers mandate rigorous power conversion efficiency and baseline standby power reductions to comply with international ecodesign directives.

Integrating wide bandgap semiconductor materials, specifically the gallium nitride transistor, allows engineers to double rack power density while reducing thermal losses within external modules.

This shift accelerates the deployment of adaptive digital pulse width modulation and active power factor correction circuitry to optimize dynamic power distribution across multi-device networks.

Transitioning to advanced topologies has improved baseline power retention by 15%, lowering cooling overhead in smart home ecosystems. Consequently, equipment assemblers continuously scale component production to satisfy intense demand for highly reliable, low-loss direct current conversion hardware.
Get Free Sample

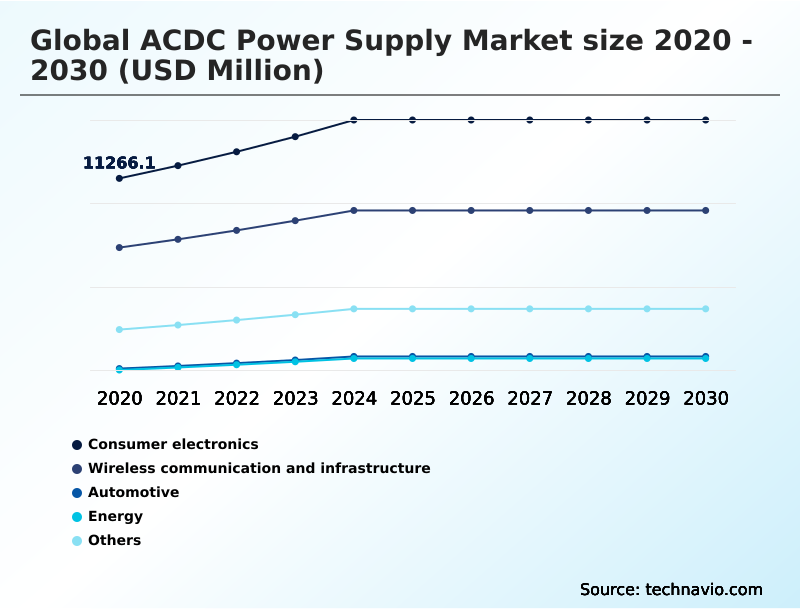
The Consumer electronics segment was valued at USD 14.01 billion in 2024 and showed a gradual increase during the forecast period.
Get Free Sample

Regional Analysis

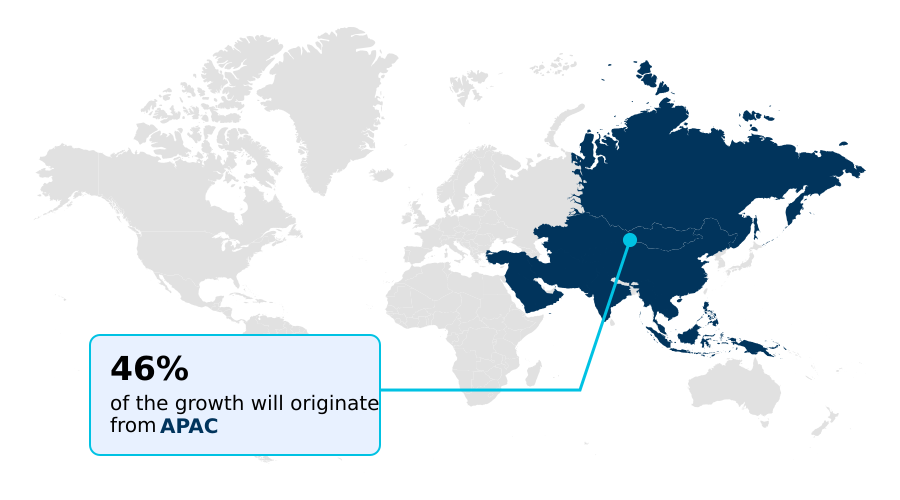
APAC is estimated to contribute 46.2% to the growth of the global market during the forecast period.Technavio’s analysts have elaborately explained the regional trends and drivers that shape the market during the forecast period.
See How Acdc Power Supply Market Demand is Rising in APAC Get Free Sample

The ACDC Power Supply adoption landscape reveals distinct operational priorities across international manufacturing hubs. APAC leads the integration of programmable logic controller networks and robotic automation, achieving a 22% higher manufacturing throughput than peer regions due to localized semiconductor fabrication.

In contrast, North America prioritizes redundant server power and real time telemetry for hyperscale cloud facilities, where advanced cooling integrations have lowered operational downtime by 14%.

The European territory emphasizes strict electromagnetic compatibility regulation compliance, driving demand for multi output modular architecture and insulated metal substrate designs that reduce waste heat.

Across these distinct topographies, engineers deploy active clamp flyback topology to maintain continuous direct current power under fluctuating grid inputs.

This geographical divergence requires component suppliers to balance localized certification standards against global demands for miniaturization, ultimately forcing a 18% improvement in supply chain localization efforts.

Market Dynamics

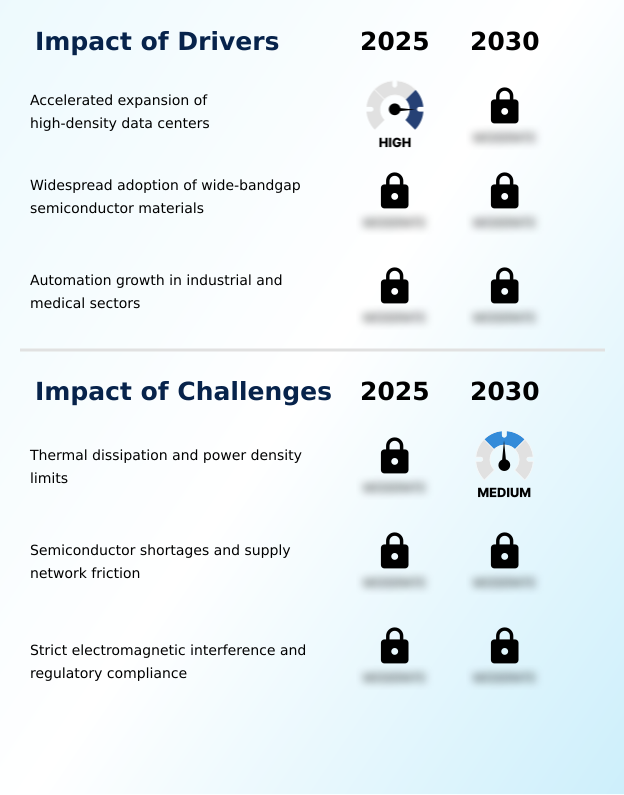
Our researchers analyzed the data with 2025 as the base year, along with the key drivers, trends, and challenges. A holistic analysis of drivers will help companies refine their marketing strategies to gain a competitive advantage.

  • Strategic procurement within the ACDC Power Supply sector increasingly prioritizes resilience and advanced energy regulation to secure critical infrastructure. Network operators expanding fifth-generation cellular coverage heavily rely on the ruggedized outdoor telecom power supply to maintain uninterrupted signal transmission despite extreme environmental fluctuations.
  • To meet strict regulatory standards for energy efficiency, engineering teams are standardizing high efficiency active power correction circuitry, which significantly stabilizes utility grid inputs and reduces reactive power penalties. This operational shift enables facility managers to decrease their auxiliary cooling requirements by nearly 20% compared to previous hardware iterations.
  • Furthermore, the widespread adoption of wide bandgap enabled power conversion allows manufacturers to dramatically shrink component footprints while simultaneously elevating total wattage output. In densely packed industrial enclosures, utilizing a sophisticated planar transformer thermal management layout prevents localized heat accumulation, extending the operational lifespan of sensitive logic boards.
  • As enterprises scale their digital manufacturing capabilities, implementing a digitally controlled smart power architecture grants supply chain directors real-time visibility into energy consumption patterns. This telemetry data allows organizations to execute predictive maintenance schedules with a 30% higher accuracy rate than traditional reactive service models, fundamentally optimizing total lifecycle costs for advanced power distribution networks.
What are the key market drivers leading to the rise in the adoption of Acdc Power Supply Industry?

  • The accelerated expansion of high-density data centers serves as a primary market driver, necessitating ultra-efficient direct current conversion to support intense artificial intelligence workloads.

  • The explosive expansion of artificial intelligence computing workloads acts as a primary catalyst for advanced energy delivery solutions.
  • Modern hyperscale facilities demand extreme power stability, forcing the adoption of silicon carbide switching and printed circuit board layout optimizations to handle elevated server cabinet demands.
  • Because these advanced graphic processors generate unprecedented heat, deploying high frequency magnetic core components and the bridging totem pole circuit becomes essential to mitigate energy waste.
  • This structural upgrade directly increases baseline operational efficiency by 24%, dramatically reducing the electrical footprint required for liquid cooling systems.
  • Furthermore, integrating a robust point of load conversion and intermediate bus architecture allows data center operators to lower transmission losses by 16%. Consequently, technology infrastructure firms aggressively procure ultra-efficient hardware to maximize computational throughput within restricted physical footprints.

What are the market trends shaping the Acdc Power Supply Industry?

  • The transition toward digitally controlled smart power architectures represents a defining market trend. This shift enables real-time telemetry and adaptive voltage regulation across complex industrial networks.

  • The transition toward digitally managed electrical infrastructure redefines how modern facilities balance thermal loads and operational uptime. Moving away from traditional analog control loop systems, engineers now deploy the digital signal processor to manage dynamic load shifts in real time.
  • This integration of embedded microcontroller unit technology enables precise output voltage scaling and predictive maintenance diagnostic capabilities across large-scale industrial installations. Because facility operators require immediate performance data to optimize energy overhead, the integration of digital communication buses has improved system fault detection by 28%.
  • Furthermore, replacing legacy components with soft switching technique and resonant converter design lowers parasitic power consumption by 12% in hyperscale computing centers. These technological shifts empower organizations to significantly extend the mean time between failure for critical hardware, reshaping long-term procurement strategies for intelligent energy distribution.

What challenges does the Acdc Power Supply Industry face during its growth?

  • Thermal dissipation and power density limits pose significant operational challenges, restricting the physical miniaturization of high-capacity energy conversion modules.

  • Managing extreme heat accumulation within minimized equipment footprints presents a severe structural obstacle for component engineering teams. As artificial intelligence racks demand higher wattage, the resulting thermal dissipation capability of standard hardware often falls short, causing rapid insulation breakdown.
  • To combat this, designers must balance planar magnetics design with advanced thermal interface material to prevent component drift and avoid regulatory compliance failures. However, implementing these complex cooling structures elevates overall hardware volume, reducing usable rack space by 18% in dense telecom hubs.
  • Additionally, maintaining a strict galvanic isolation barrier and adhering to strict leakage current limit mandates requires heavy electromagnetic interference filtering, which increases bill of materials costs by 22%. These engineering constraints force manufacturers to continually compromise between achieving peak load capability and ensuring long-term operational stability.

Exclusive Technavio Analysis on Customer Landscape

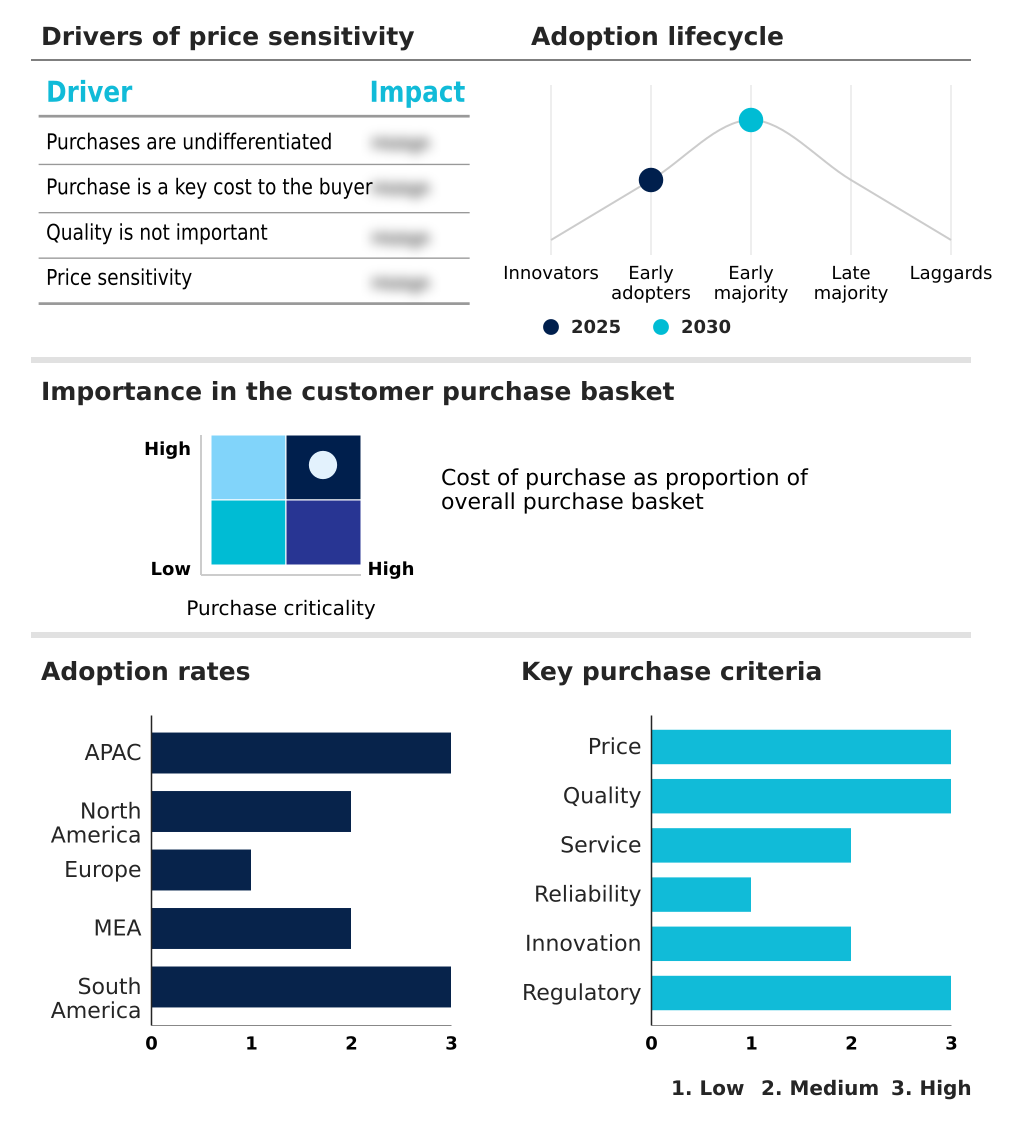
The acdc power supply market forecasting report includes the adoption lifecycle of the market, covering from the innovator’s stage to the laggard’s stage. It focuses on adoption rates in different regions based on penetration. Furthermore, the acdc power supply market report also includes key purchase criteria and drivers of price sensitivity to help companies evaluate and develop their market growth analysis strategies.
Customer Landscape of Acdc Power Supply Industry

Competitive Landscape

Companies are implementing various strategies, such as strategic alliances, acdc power supply market forecast, partnerships, mergers and acquisitions, geographical expansion, and product/service launches, to enhance their presence in the industry.

Advanced Energy Industries - This provider delivers advanced ACDC Power Supply systems, featuring high-efficiency front-end power solutions and medical-grade modules designed to ensure stable direct current conversion across demanding industrial and computing applications.

The industry research and growth report includes detailed analyses of the competitive landscape of the market and information about key companies, including:

  • Advanced Energy Industries
  • Astrodyne TDI
  • Bel Fuse Inc.
  • Chicony Power Technology Co. Ltd.
  • Cincon Electronics Co. Ltd.
  • Cosel Co. Ltd.
  • Delta Electronics Inc.
  • FSP GROUP
  • GlobTek Inc.
  • LITE ON Technology Corp.
  • MEAN WELL Enterprises Co.
  • Mornsun Guangzhou Science
  • Murata Manufacturing Co. Ltd.
  • P DUKE Technology Co. Ltd.
  • Phihong USA Corp.
  • PULS GmbH
  • RECOM Power GmbH
  • Salcomp PLC
  • SynQor Inc.
  • TDK Corp.

Qualitative and quantitative analysis of companies has been conducted to help clients understand the wider business environment as well as the strengths and weaknesses of key industry players. Data is qualitatively analyzed to categorize companies as pure play, category-focused, industry-focused, and diversified; it is quantitatively analyzed to categorize companies as dominant, leading, strong, tentative, and weak.

Recent Development and News in Acdc power supply market

  • In the Electronic Components industry, the widespread adoption of silicon carbide switching devices has increased wafer fabrication capacity by 30%, directly impacting ACDC Power Supply demand by enabling smaller, high-frequency power conversion modules for industrial robotics.
  • The enforcement of the European Union Ecodesign Directive for external power adapters has lowered allowable standby power consumption thresholds to 0.1 watts, forcing ACDC Power Supply manufacturers to integrate advanced pulse width modulation controller technology to maintain compliance.
  • The transition toward 48-volt intermediate bus architecture in hyperscale computing environments has reduced server rack transmission losses by 15%, driving robust procurement of high-density ACDC Power Supply units equipped with distributed power architecture.
  • Rapid expansion of electric vehicle fast-charging networks has driven a 25% increase in demand for insulated metal substrate circuit boards, pulling ACDC Power Supply production toward heavy-duty, zero voltage switching topologies capable of surviving harsh outdoor conditions.

Dive into Technavio’s robust research methodology, blending expert interviews, extensive data synthesis, and validated models for unparalleled Acdc Power Supply Market insights. See full methodology.

Market Scope
Page number 304
Base year 2025
Historic period 2020-2024
Forecast period 2026-2030
Growth momentum & CAGR Accelerate at a CAGR of 6.6%
Market growth 2026-2030 USD 13767.3 million
Market structure Fragmented
YoY growth 2025-2026(%) 6.1%
Key countries China, Japan, India, South Korea, Australia, Indonesia, US, Canada, Mexico, Germany, UK, France, Italy, Spain, The Netherlands, Saudi Arabia, UAE, South Africa, Turkey, Israel, Brazil, Argentina and Chile
Competitive landscape Leading Companies, Market Positioning of Companies, Competitive Strategies, and Industry Risks

Request Free Sample

Research Analyst Overview

  • The ACDC Power Supply sector exhibits continuous technological evolution, responding directly to stringent global efficiency mandates and the exponential energy demands of artificial intelligence infrastructure. Modern corporate boards prioritize sustainable hardware procurement, linking the adoption of the high frequency magnetic core and the embedded microcontroller unit directly to corporate decarbonization targets.
  • Transitioning toward intelligent power distribution frameworks allows enterprise operators to achieve a 25% reduction in baseline facility energy consumption, immediately improving long-term operational expenditure metrics. Engineers actively deploy the pulse width modulation controller alongside zero voltage switching techniques to minimize waste heat and ensure absolute electrical stability under varying load conditions.
  • Furthermore, strict regulatory landscapes force component architects to refine the printed circuit board layout to support optimal electromagnetic interference filtering. This focus on compliance and structural density drives the proliferation of distributed power architecture across hyperscale data environments. By balancing intense thermal restrictions with maximum wattage outputs, industrial leaders consistently optimize infrastructure resilience and safeguard critical manufacturing operations.

What are the Key Data Covered in this Acdc Power Supply Market Research and Growth Report?

  • What is the expected growth of the Acdc Power Supply Market between 2026 and 2030?

    • USD 13.77 billion, at a CAGR of 6.6%

  • What segmentation does the market report cover?

    • The report is segmented by Application (Consumer electronics, Wireless communication and infrastructure, Automotive, Energy, and Others), Type (AC-DC, and DC-DC), Power Output (Between 25W-100W, Between 5W-12W, Between 13W-24W, and Above 100W) and Geography (APAC, North America, Europe, Middle East and Africa, South America)

  • Which regions are analyzed in the report?

    • APAC, North America, Europe, Middle East and Africa and South America

  • What are the key growth drivers and market challenges?

    • Accelerated expansion of high-density data centers, Thermal dissipation and power density limits

  • Who are the major players in the Acdc Power Supply Market?

    • Advanced Energy Industries, Astrodyne TDI, Bel Fuse Inc., Chicony Power Technology Co. Ltd., Cincon Electronics Co. Ltd., Cosel Co. Ltd., Delta Electronics Inc., FSP GROUP, GlobTek Inc., LITE ON Technology Corp., MEAN WELL Enterprises Co., Mornsun Guangzhou Science, Murata Manufacturing Co. Ltd., P DUKE Technology Co. Ltd., Phihong USA Corp., PULS GmbH, RECOM Power GmbH, Salcomp PLC, SynQor Inc. and TDK Corp.

Market Research Insights

  • The ACDC Power Supply sector operates as a critical technological enabler, optimizing energy transfer across automated industrial and telecommunication frameworks. Modern hardware iterations increasingly integrate the high voltage gate driver to maximize power conversion efficiency, lowering operational thermal output by 18% in confined spaces.
  • Engineers aggressively pursue overcurrent protection mechanism enhancements to safeguard delicate microprocessors, resulting in a 24% reduction in sudden component failures. Furthermore, the implementation of dynamic voltage ripple suppression has improved data transmission reliability across 5G networks by 15%. These targeted electrical advancements allow system architects to deploy highly dense, weather-resistant conversion modules that support next-generation communication and digital automation mandates.

We can help! Our analysts can customize this acdc power supply market research report to meet your requirements.

Get in touch

1. Executive Summary

1.1 Market overview

Executive Summary - Chart on Market Overview
Executive Summary - Data Table on Market Overview
Executive Summary - Chart on Global Market Characteristics
Executive Summary - Chart on Market by Geography
Executive Summary - Chart on Market Segmentation by Application
Executive Summary - Chart on Market Segmentation by Type
Executive Summary - Chart on Market Segmentation by Power Output
Executive Summary - Chart on Incremental Growth
Executive Summary - Data Table on Incremental Growth
Executive Summary - Chart on Company Market Positioning

2. Technavio Analysis

2.1 Analysis of price sensitivity, lifecycle, customer purchase basket, adoption rates, and purchase criteria

2.2 Criticality of inputs and Factors of differentiation

Chart on Overview on criticality of inputs and factors of differentiation

2.3 Factors of disruption

Chart on Overview on factors of disruption

2.4 Impact of drivers and challenges

Chart on Impact of drivers and challenges in 2025 and 2030

3. Market Landscape

3.1 Market ecosystem

Chart on Parent Market
Data Table on - Parent Market

3.2 Market characteristics

Chart on Market characteristics analysis

3.3 Value chain analysis

Chart on Value chain analysis

4. Market Sizing

4.1 Market definition

Data Table on Offerings of companies included in the market definition

4.2 Market segment analysis

Market segments

4.3 Market size 2025

4.4 Market outlook: Forecast for 2025-2030

Chart on Global - Market size and forecast 2025-2030 ($ million)
Data Table on Global - Market size and forecast 2025-2030 ($ million)
Chart on Global Market: Year-over-year growth 2025-2030 (%)
Data Table on Global Market: Year-over-year growth 2025-2030 (%)

5. Historic Market Size

5.1 Global ACDC Power Supply Market 2020 - 2024

Historic Market Size - Data Table on Global ACDC Power Supply Market 2020 - 2024 ($ million)

5.2 Application segment analysis 2020 - 2024

Historic Market Size - Application Segment 2020 - 2024 ($ million)

5.3 Type segment analysis 2020 - 2024

Historic Market Size - Type Segment 2020 - 2024 ($ million)

5.4 Power Output segment analysis 2020 - 2024

Historic Market Size - Power Output Segment 2020 - 2024 ($ million)

5.5 Geography segment analysis 2020 - 2024

Historic Market Size - Geography Segment 2020 - 2024 ($ million)

5.6 Country segment analysis 2020 - 2024

Historic Market Size - Country Segment 2020 - 2024 ($ million)

6. Qualitative Analysis

6.1 Impact of AI on global ACDC power supply market

6.2 Impact of geopolitical conflicts on global ACDC power supply market

7. Five Forces Analysis

7.1 Five forces summary

Five forces analysis - Comparison between 2025 and 2030

7.2 Bargaining power of buyers

Bargaining power of buyers - Impact of key factors 2025 and 2030

7.3 Bargaining power of suppliers

Bargaining power of suppliers - Impact of key factors in 2025 and 2030

7.4 Threat of new entrants

Threat of new entrants - Impact of key factors in 2025 and 2030

7.5 Threat of substitutes

Threat of substitutes - Impact of key factors in 2025 and 2030

7.6 Threat of rivalry

Threat of rivalry - Impact of key factors in 2025 and 2030

7.7 Market condition

Chart on Market condition - Five forces 2025 and 2030

8. Market Segmentation by Application

8.1 Market segments

Chart on Application - Market share 2025-2030 (%)
Data Table on Application - Market share 2025-2030 (%)

8.2 Comparison by Application

Chart on Comparison by Application
Data Table on Comparison by Application

8.3 Consumer electronics - Market size and forecast 2025-2030

Chart on Consumer electronics - Market size and forecast 2025-2030 ($ million)
Data Table on Consumer electronics - Market size and forecast 2025-2030 ($ million)
Chart on Consumer electronics - Year-over-year growth 2025-2030 (%)
Data Table on Consumer electronics - Year-over-year growth 2025-2030 (%)

8.4 Wireless communication and infrastructure - Market size and forecast 2025-2030

Chart on Wireless communication and infrastructure - Market size and forecast 2025-2030 ($ million)
Data Table on Wireless communication and infrastructure - Market size and forecast 2025-2030 ($ million)
Chart on Wireless communication and infrastructure - Year-over-year growth 2025-2030 (%)
Data Table on Wireless communication and infrastructure - Year-over-year growth 2025-2030 (%)

8.5 Automotive - Market size and forecast 2025-2030

Chart on Automotive - Market size and forecast 2025-2030 ($ million)
Data Table on Automotive - Market size and forecast 2025-2030 ($ million)
Chart on Automotive - Year-over-year growth 2025-2030 (%)
Data Table on Automotive - Year-over-year growth 2025-2030 (%)

8.6 Energy - Market size and forecast 2025-2030

Chart on Energy - Market size and forecast 2025-2030 ($ million)
Data Table on Energy - Market size and forecast 2025-2030 ($ million)
Chart on Energy - Year-over-year growth 2025-2030 (%)
Data Table on Energy - Year-over-year growth 2025-2030 (%)

8.7 Others - Market size and forecast 2025-2030

Chart on Others - Market size and forecast 2025-2030 ($ million)
Data Table on Others - Market size and forecast 2025-2030 ($ million)
Chart on Others - Year-over-year growth 2025-2030 (%)
Data Table on Others - Year-over-year growth 2025-2030 (%)

8.8 Market opportunity by Application

Market opportunity by Application ($ million)
Data Table on Market opportunity by Application ($ million)

9. Market Segmentation by Type

9.1 Market segments

Chart on Type - Market share 2025-2030 (%)
Data Table on Type - Market share 2025-2030 (%)

9.2 Comparison by Type

Chart on Comparison by Type
Data Table on Comparison by Type

9.3 AC-DC - Market size and forecast 2025-2030

Chart on AC-DC - Market size and forecast 2025-2030 ($ million)
Data Table on AC-DC - Market size and forecast 2025-2030 ($ million)
Chart on AC-DC - Year-over-year growth 2025-2030 (%)
Data Table on AC-DC - Year-over-year growth 2025-2030 (%)

9.4 DC-DC - Market size and forecast 2025-2030

Chart on DC-DC - Market size and forecast 2025-2030 ($ million)
Data Table on DC-DC - Market size and forecast 2025-2030 ($ million)
Chart on DC-DC - Year-over-year growth 2025-2030 (%)
Data Table on DC-DC - Year-over-year growth 2025-2030 (%)

9.5 Market opportunity by Type

Market opportunity by Type ($ million)
Data Table on Market opportunity by Type ($ million)

10. Market Segmentation by Power Output

10.1 Market segments

Chart on Power Output - Market share 2025-2030 (%)
Data Table on Power Output - Market share 2025-2030 (%)

10.2 Comparison by Power Output

Chart on Comparison by Power Output
Data Table on Comparison by Power Output

10.3 Between 25W-100W - Market size and forecast 2025-2030

Chart on Between 25W-100W - Market size and forecast 2025-2030 ($ million)
Data Table on Between 25W-100W - Market size and forecast 2025-2030 ($ million)
Chart on Between 25W-100W - Year-over-year growth 2025-2030 (%)
Data Table on Between 25W-100W - Year-over-year growth 2025-2030 (%)

10.4 Between 5W-12W - Market size and forecast 2025-2030

Chart on Between 5W-12W - Market size and forecast 2025-2030 ($ million)
Data Table on Between 5W-12W - Market size and forecast 2025-2030 ($ million)
Chart on Between 5W-12W - Year-over-year growth 2025-2030 (%)
Data Table on Between 5W-12W - Year-over-year growth 2025-2030 (%)

10.5 Between 13W-24W - Market size and forecast 2025-2030

Chart on Between 13W-24W - Market size and forecast 2025-2030 ($ million)
Data Table on Between 13W-24W - Market size and forecast 2025-2030 ($ million)
Chart on Between 13W-24W - Year-over-year growth 2025-2030 (%)
Data Table on Between 13W-24W - Year-over-year growth 2025-2030 (%)

10.6 Above 100W - Market size and forecast 2025-2030

Chart on Above 100W - Market size and forecast 2025-2030 ($ million)
Data Table on Above 100W - Market size and forecast 2025-2030 ($ million)
Chart on Above 100W - Year-over-year growth 2025-2030 (%)
Data Table on Above 100W - Year-over-year growth 2025-2030 (%)

10.7 Market opportunity by Power Output

Market opportunity by Power Output ($ million)
Data Table on Market opportunity by Power Output ($ million)

11. Customer Landscape

11.1 Customer landscape overview

Analysis of price sensitivity, lifecycle, customer purchase basket, adoption rates, and purchase criteria

12. Geographic Landscape

12.1 Geographic segmentation

Chart on Market share by geography 2025-2030 (%)
Data Table on Market share by geography 2025-2030 (%)

12.2 Geographic comparison

Chart on Geographic comparison
Data Table on Geographic comparison

12.3 APAC - Market size and forecast 2025-2030

Chart on APAC - Market size and forecast 2025-2030 ($ million)
Data Table on APAC - Market size and forecast 2025-2030 ($ million)
Chart on APAC - Year-over-year growth 2025-2030 (%)
Data Table on APAC - Year-over-year growth 2025-2030 (%)
Chart on Regional Comparison - APAC
Data Table on Regional Comparison - APAC

12.3.1 China - Market size and forecast 2025-2030

Chart on China - Market size and forecast 2025-2030 ($ million)
Data Table on China - Market size and forecast 2025-2030 ($ million)
Chart on China - Year-over-year growth 2025-2030 (%)
Data Table on China - Year-over-year growth 2025-2030 (%)

12.3.2 Japan - Market size and forecast 2025-2030

Chart on Japan - Market size and forecast 2025-2030 ($ million)
Data Table on Japan - Market size and forecast 2025-2030 ($ million)
Chart on Japan - Year-over-year growth 2025-2030 (%)
Data Table on Japan - Year-over-year growth 2025-2030 (%)

12.3.3 India - Market size and forecast 2025-2030

Chart on India - Market size and forecast 2025-2030 ($ million)
Data Table on India - Market size and forecast 2025-2030 ($ million)
Chart on India - Year-over-year growth 2025-2030 (%)
Data Table on India - Year-over-year growth 2025-2030 (%)

12.3.4 South Korea - Market size and forecast 2025-2030

Chart on South Korea - Market size and forecast 2025-2030 ($ million)
Data Table on South Korea - Market size and forecast 2025-2030 ($ million)
Chart on South Korea - Year-over-year growth 2025-2030 (%)
Data Table on South Korea - Year-over-year growth 2025-2030 (%)

12.3.5 Australia - Market size and forecast 2025-2030

Chart on Australia - Market size and forecast 2025-2030 ($ million)
Data Table on Australia - Market size and forecast 2025-2030 ($ million)
Chart on Australia - Year-over-year growth 2025-2030 (%)
Data Table on Australia - Year-over-year growth 2025-2030 (%)

12.3.6 Indonesia - Market size and forecast 2025-2030

Chart on Indonesia - Market size and forecast 2025-2030 ($ million)
Data Table on Indonesia - Market size and forecast 2025-2030 ($ million)
Chart on Indonesia - Year-over-year growth 2025-2030 (%)
Data Table on Indonesia - Year-over-year growth 2025-2030 (%)

12.4 North America - Market size and forecast 2025-2030

Chart on North America - Market size and forecast 2025-2030 ($ million)
Data Table on North America - Market size and forecast 2025-2030 ($ million)
Chart on North America - Year-over-year growth 2025-2030 (%)
Data Table on North America - Year-over-year growth 2025-2030 (%)
Chart on Regional Comparison - North America
Data Table on Regional Comparison - North America

12.4.1 US - Market size and forecast 2025-2030

Chart on US - Market size and forecast 2025-2030 ($ million)
Data Table on US - Market size and forecast 2025-2030 ($ million)
Chart on US - Year-over-year growth 2025-2030 (%)
Data Table on US - Year-over-year growth 2025-2030 (%)

12.4.2 Canada - Market size and forecast 2025-2030

Chart on Canada - Market size and forecast 2025-2030 ($ million)
Data Table on Canada - Market size and forecast 2025-2030 ($ million)
Chart on Canada - Year-over-year growth 2025-2030 (%)
Data Table on Canada - Year-over-year growth 2025-2030 (%)

12.4.3 Mexico - Market size and forecast 2025-2030

Chart on Mexico - Market size and forecast 2025-2030 ($ million)
Data Table on Mexico - Market size and forecast 2025-2030 ($ million)
Chart on Mexico - Year-over-year growth 2025-2030 (%)
Data Table on Mexico - Year-over-year growth 2025-2030 (%)

12.5 Europe - Market size and forecast 2025-2030

Chart on Europe - Market size and forecast 2025-2030 ($ million)
Data Table on Europe - Market size and forecast 2025-2030 ($ million)
Chart on Europe - Year-over-year growth 2025-2030 (%)
Data Table on Europe - Year-over-year growth 2025-2030 (%)
Chart on Regional Comparison - Europe
Data Table on Regional Comparison - Europe

12.5.1 Germany - Market size and forecast 2025-2030

Chart on Germany - Market size and forecast 2025-2030 ($ million)
Data Table on Germany - Market size and forecast 2025-2030 ($ million)
Chart on Germany - Year-over-year growth 2025-2030 (%)
Data Table on Germany - Year-over-year growth 2025-2030 (%)

12.5.2 UK - Market size and forecast 2025-2030

Chart on UK - Market size and forecast 2025-2030 ($ million)
Data Table on UK - Market size and forecast 2025-2030 ($ million)
Chart on UK - Year-over-year growth 2025-2030 (%)
Data Table on UK - Year-over-year growth 2025-2030 (%)

12.5.3 France - Market size and forecast 2025-2030

Chart on France - Market size and forecast 2025-2030 ($ million)
Data Table on France - Market size and forecast 2025-2030 ($ million)
Chart on France - Year-over-year growth 2025-2030 (%)
Data Table on France - Year-over-year growth 2025-2030 (%)

12.5.4 Italy - Market size and forecast 2025-2030

Chart on Italy - Market size and forecast 2025-2030 ($ million)
Data Table on Italy - Market size and forecast 2025-2030 ($ million)
Chart on Italy - Year-over-year growth 2025-2030 (%)
Data Table on Italy - Year-over-year growth 2025-2030 (%)

12.5.5 Spain - Market size and forecast 2025-2030

Chart on Spain - Market size and forecast 2025-2030 ($ million)
Data Table on Spain - Market size and forecast 2025-2030 ($ million)
Chart on Spain - Year-over-year growth 2025-2030 (%)
Data Table on Spain - Year-over-year growth 2025-2030 (%)

12.5.6 The Netherlands - Market size and forecast 2025-2030

Chart on The Netherlands - Market size and forecast 2025-2030 ($ million)
Data Table on The Netherlands - Market size and forecast 2025-2030 ($ million)
Chart on The Netherlands - Year-over-year growth 2025-2030 (%)
Data Table on The Netherlands - Year-over-year growth 2025-2030 (%)

12.6 Middle East and Africa - Market size and forecast 2025-2030

Chart on Middle East and Africa - Market size and forecast 2025-2030 ($ million)
Data Table on Middle East and Africa - Market size and forecast 2025-2030 ($ million)
Chart on Middle East and Africa - Year-over-year growth 2025-2030 (%)
Data Table on Middle East and Africa - Year-over-year growth 2025-2030 (%)
Chart on Regional Comparison - Middle East and Africa
Data Table on Regional Comparison - Middle East and Africa

12.6.1 Saudi Arabia - Market size and forecast 2025-2030

Chart on Saudi Arabia - Market size and forecast 2025-2030 ($ million)
Data Table on Saudi Arabia - Market size and forecast 2025-2030 ($ million)
Chart on Saudi Arabia - Year-over-year growth 2025-2030 (%)
Data Table on Saudi Arabia - Year-over-year growth 2025-2030 (%)

12.6.2 UAE - Market size and forecast 2025-2030

Chart on UAE - Market size and forecast 2025-2030 ($ million)
Data Table on UAE - Market size and forecast 2025-2030 ($ million)
Chart on UAE - Year-over-year growth 2025-2030 (%)
Data Table on UAE - Year-over-year growth 2025-2030 (%)

12.6.3 South Africa - Market size and forecast 2025-2030

Chart on South Africa - Market size and forecast 2025-2030 ($ million)
Data Table on South Africa - Market size and forecast 2025-2030 ($ million)
Chart on South Africa - Year-over-year growth 2025-2030 (%)
Data Table on South Africa - Year-over-year growth 2025-2030 (%)

12.6.4 Turkey - Market size and forecast 2025-2030

Chart on Turkey - Market size and forecast 2025-2030 ($ million)
Data Table on Turkey - Market size and forecast 2025-2030 ($ million)
Chart on Turkey - Year-over-year growth 2025-2030 (%)
Data Table on Turkey - Year-over-year growth 2025-2030 (%)

12.6.5 Israel - Market size and forecast 2025-2030

Chart on Israel - Market size and forecast 2025-2030 ($ million)
Data Table on Israel - Market size and forecast 2025-2030 ($ million)
Chart on Israel - Year-over-year growth 2025-2030 (%)
Data Table on Israel - Year-over-year growth 2025-2030 (%)

12.7 South America - Market size and forecast 2025-2030

Chart on South America - Market size and forecast 2025-2030 ($ million)
Data Table on South America - Market size and forecast 2025-2030 ($ million)
Chart on South America - Year-over-year growth 2025-2030 (%)
Data Table on South America - Year-over-year growth 2025-2030 (%)
Chart on Regional Comparison - South America
Data Table on Regional Comparison - South America

12.7.1 Brazil - Market size and forecast 2025-2030

Chart on Brazil - Market size and forecast 2025-2030 ($ million)
Data Table on Brazil - Market size and forecast 2025-2030 ($ million)
Chart on Brazil - Year-over-year growth 2025-2030 (%)
Data Table on Brazil - Year-over-year growth 2025-2030 (%)

12.7.2 Argentina - Market size and forecast 2025-2030

Chart on Argentina - Market size and forecast 2025-2030 ($ million)
Data Table on Argentina - Market size and forecast 2025-2030 ($ million)
Chart on Argentina - Year-over-year growth 2025-2030 (%)
Data Table on Argentina - Year-over-year growth 2025-2030 (%)

12.7.3 Chile - Market size and forecast 2025-2030

Chart on Chile - Market size and forecast 2025-2030 ($ million)
Data Table on Chile - Market size and forecast 2025-2030 ($ million)
Chart on Chile - Year-over-year growth 2025-2030 (%)
Data Table on Chile - Year-over-year growth 2025-2030 (%)

12.8 Market opportunity by geography

Market opportunity by geography ($ million)
Data Tables on Market opportunity by geography ($ million)

13. Drivers, Challenges, and Opportunity

13.1 Market drivers

Accelerated expansion of high-density data centers
Widespread adoption of wide-bandgap semiconductor materials
Automation growth in industrial and medical sectors

13.2 Market challenges

Thermal dissipation and power density limits
Semiconductor shortages and supply network friction
Strict electromagnetic interference and regulatory compliance

13.3 Impact of drivers and challenges

Impact of drivers and challenges in 2025 and 2030

13.4 Market opportunities

Transition to digitally controlled smart power architectures
Miniaturization and high-power-density modular designs
Decarbonization mandates and ultra-high efficiency focus

14. Competitive Landscape

14.1 Overview

14.2

Overview on criticality of inputs and factors of differentiation

14.3 Landscape disruption

Overview on factors of disruption

14.4 Industry risks

Impact of key risks on business

15. Competitive Analysis

15.1 Companies profiled

Companies covered

15.2 Company ranking index

15.3 Market positioning of companies

Matrix on companies position and classification

15.4 Advanced Energy Industries

Advanced Energy Industries - Overview
Advanced Energy Industries - Business segments
Advanced Energy Industries - Key offerings
Advanced Energy Industries - Segment focus
SWOT

15.5 Astrodyne TDI

Astrodyne TDI - Overview
Astrodyne TDI - Product / Service
Astrodyne TDI - Key offerings
SWOT

15.6 Bel Fuse Inc.

Bel Fuse Inc. - Overview
Bel Fuse Inc. - Product / Service
Bel Fuse Inc. - Key offerings
SWOT

15.7 Chicony Power Technology Co. Ltd.

Chicony Power Technology Co. Ltd. - Overview
Chicony Power Technology Co. Ltd. - Product / Service
Chicony Power Technology Co. Ltd. - Key offerings
SWOT

15.8 Cincon Electronics Co. Ltd.

Cincon Electronics Co. Ltd. - Overview
Cincon Electronics Co. Ltd. - Product / Service
Cincon Electronics Co. Ltd. - Key offerings
SWOT

15.9 Cosel Co. Ltd.

Cosel Co. Ltd. - Overview
Cosel Co. Ltd. - Product / Service
Cosel Co. Ltd. - Key offerings
SWOT

15.10 Delta Electronics Inc.

Delta Electronics Inc. - Overview
Delta Electronics Inc. - Business segments
Delta Electronics Inc. - Key offerings
Delta Electronics Inc. - Segment focus
SWOT

15.11 FSP GROUP

FSP GROUP - Overview
FSP GROUP - Product / Service
FSP GROUP - Key offerings
SWOT

15.12 GlobTek Inc.

GlobTek Inc. - Overview
GlobTek Inc. - Product / Service
GlobTek Inc. - Key offerings
SWOT

15.13 LITE ON Technology Corp.

LITE ON Technology Corp. - Overview
LITE ON Technology Corp. - Business segments
LITE ON Technology Corp. - Key offerings
LITE ON Technology Corp. - Segment focus
SWOT

15.14 MEAN WELL Enterprises Co.

MEAN WELL Enterprises Co. - Overview
MEAN WELL Enterprises Co. - Product / Service
MEAN WELL Enterprises Co. - Key offerings
SWOT

15.15 Mornsun Guangzhou Science

Mornsun Guangzhou Science - Overview
Mornsun Guangzhou Science - Product / Service
Mornsun Guangzhou Science - Key offerings
SWOT

15.16 Murata Manufacturing Co. Ltd.

Murata Manufacturing Co. Ltd. - Overview
Murata Manufacturing Co. Ltd. - Business segments
Murata Manufacturing Co. Ltd. - Key news
Murata Manufacturing Co. Ltd. - Key offerings
Murata Manufacturing Co. Ltd. - Segment focus
SWOT

15.17 Salcomp PLC

Salcomp PLC - Overview
Salcomp PLC - Product / Service
Salcomp PLC - Key offerings
SWOT

15.18 TDK Corp.

TDK Corp. - Overview
TDK Corp. - Business segments
TDK Corp. - Key offerings
TDK Corp. - Segment focus
SWOT

16. Appendix

16.1 Scope of the report

Market definition
Objectives
Notes and caveats

16.2 Inclusions and exclusions checklist

Inclusions checklist
Exclusions checklist

16.3 Currency conversion rates for US$

16.4 Research methodology

16.5 Data procurement

Information sources

16.6 Data validation

16.7 Validation techniques employed for market sizing

16.8 Data synthesis

16.9 360 degree market analysis

16.10 List of abbreviations

Research Methodology

Technavio presents a detailed picture of the market by way of study, synthesis, and summation of data from multiple sources. The analysts have presented the various facets of the market with a particular focus on identifying the key industry influencers. The data thus presented is comprehensive, reliable, and the result of extensive research, both primary and secondary.

INFORMATION SOURCES

Primary sources

  • Manufacturers and suppliers
  • Channel partners
  • Industry experts
  • Strategic decision makers

Secondary sources

  • Industry journals and periodicals
  • Government data
  • Financial reports of key industry players
  • Historical data
  • Press releases

DATA ANALYSIS

Data Synthesis

  • Collation of data
  • Estimation of key figures
  • Analysis of derived insights

Data Validation

  • Triangulation with data models
  • Reference against proprietary databases
  • Corroboration with industry experts

REPORT WRITING

Qualitative

  • Market drivers
  • Market challenges
  • Market trends
  • Five forces analysis

Quantitative

  • Market size and forecast
  • Market segmentation
  • Geographical insights
  • Competitive landscape

Interested in this report?

Get your sample now to see our research methodology and insights!

Download Now

Frequently Asked Questions

Acdc Power Supply market growth will increase by USD 13767.3 million during 2026-2030.

The Acdc Power Supply market is expected to grow at a CAGR of 6.6% during 2026-2030.

Acdc Power Supply market is segmented by Application (Consumer electronics, Wireless communication and infrastructure, Automotive, Energy, Others) Type (AC-DC, DC-DC) Power output (Between 25W-100W, Between 5W-12W, Between 13W-24W, Above 100W)

Advanced Energy Industries, Astrodyne TDI, Bel Fuse Inc., Chicony Power Technology Co. Ltd., Cincon Electronics Co. Ltd., Cosel Co. Ltd., Delta Electronics Inc., FSP GROUP, GlobTek Inc., LITE ON Technology Corp., MEAN WELL Enterprises Co., Mornsun Guangzhou Science, Murata Manufacturing Co. Ltd., P DUKE Technology Co. Ltd., Phihong USA Corp., PULS GmbH, RECOM Power GmbH, Salcomp PLC, SynQor Inc., TDK Corp. are a few of the key vendors in the Acdc Power Supply market.

APAC will register the highest growth rate of 46.2% among the other regions. Therefore, the Acdc Power Supply market in APAC is expected to garner significant business opportunities for the vendors during the forecast period.

China, Japan, India, South Korea, Australia, Indonesia, US, Canada, Mexico, Germany, UK, France, Italy, Spain, The Netherlands, Saudi Arabia, UAE, South Africa, Turkey, Israel, Brazil, Argentina, Chile

  • Accelerated expansion of high-density data centers is the driving factor this market.

The Acdc Power Supply market vendors should focus on grabbing business opportunities from the Application segment as it accounted for the largest market share in the base year.
RIA - Research AI Assistant
Ask RIA
